Introduction
The theory of metapopuation ecology describes the presence of many organisms in a network of more or less interconnected local habitats (Hanski, Reference Hanski1991; Hanski & Gyllenberg, Reference Hanski and Gyllenberg1993). The survival probability of such a population network is determined by many factors like the ratio of habitat edge to interior (Chen et al., Reference Chen, Franklin and Spies1995; Radeloff et al., Reference Radeloff, Mladenoff and Boyce2000), the isolation of habitat fragments (Collinge, Reference Collinge2000), patch area (Kruess & Tscharntke, Reference Kruess and Tscharntke2000), patch quality (Dennis & Eales, Reference Dennis and Eales.1997; Kuussaari et al., Reference Kuussaari, Hanski and Singer2000; Hanski & Singer, Reference Hanski and Singer2001), microclimate (Braman et al., Reference Braman, Latimer, Oetting, McQueen, Eckberg and Prinster2000) and the matrix between patches (Maes et al., Reference Maes, Vanreuse, Talloen and Van Dyck2004). All these factors contribute to determining the abundance of organisms in a landscape and, thus, influence a turnover equilibrium of colonisations, extinctions and recolonisations. However, habitat quality is of special importance for the persistence, principally of sendentary species, and, thus, their incidence probability in a patch (Dennis & Eales, Reference Dennis and Eales.1997).
Therefore, anthropogenic habitat fragmentation of previously continuous habitats has become a topic of growing interest in conservation biology (Wilcox & Murphy, Reference Wilcox and Murphy1985; Saunders et al., Reference Saunders, Hobbs and Margules1991; Frankham, Reference Frankham1995; Young et al., Reference Young, Boyle and Brown1996) because isolation of large populations into several smaller and isolated populations may alter demographic and genetic factors, thereby increasing the risk of population extirpation (Goodman, Reference Goodman and Soulé1987; Lacy, Reference Lacy1987; Harrison, Reference Harrison1991). Especially sedentary species with specific ecological requirements are affected by these changes because they occupy only part of their potential habitats as a consequence of habitat isolation (Dennis & Eales, Reference Dennis and Eales.1997; Maes et al., Reference Maes, Vanreuse, Talloen and Van Dyck2004). One major goal of conservation genetic studies is, therefore, the analysis of the effects of such habitat fragmentations through the documentation of genetic differentiation among isolated populations and levels of genetic diversity within these populations (Harrisson & Hastings, Reference Harrison and Hastings1996; Oostermeijer et al., Reference Oostermeijer, Brugman, Den Boer and Den Nijs1996; Young et al., Reference Young, Boyle and Brown1996). The effects of fragmentation are mostly determined by three key factors: (i) population density within patches; (ii) distances between patches (i.e. habitat availability); and (iii) dispersal ability of an organism. Population density and habitat availability depend on the ecological requirements (biotic and abiotic) of a species; dispersal behaviour influences the realised ecosystem connectivity of species (Holzhauer et al., Reference Holzhauer, Ekschmitt, Sanders, Dauber and Wolters2005; Louy et al., Reference Louy, Habel, Schmitt, Assmann, Meyer and Müller2007). Even in a group of mobile insects, such as butterflies, sedentary species are known with very restricted exchange rates between habitats (Conradt et al., Reference Conradt, Roper and Thomas2001; Baguette, Reference Baguette2003; Vandewoestijne et al., Reference Vandewoestijne, Martin, Liégeois and Baguette2004; Schmitt et al., Reference Schmitt, Habel, Besold, Becker, Johnen, Knolle, Rzepecki, Schultze and Zapp2006).
We hypothesize that species with high dispersal capacity, and thus high exchange rates among populations, show a continuous refreshment of their gene pool. On the other hand, colonisations of some few individuals often imply genetic bottlenecks and losses of rare alleles (Hedrick & Kalinowski, Reference Hedrick and Kalinowski.2000; Keller & Waller, Reference Keller and Waller2002; Reed & Frankham, Reference Reed and Frankham2003). Only some few main alleles persist, if such bottlenecks are repeated several times. Low exchange rates and high potential genetic drift within habitats will lead to a loss of genetic diversity in sedentary species. These processes may be counterbalanced by high population densities and low fluctuations, thus preserving a high genetic diversity.
To test the influence of different dispersal abilities and population densities of species living in fragmented environments, we selcted two lycaenid butterfly species with opposed ecological constraints. Cupido minimus (Fuessly, 1775) is one of the most sedentary buttterfly species of Europe (Weidemann, Reference Weidemann1988; Bink, Reference Bink1992; Cowley et al., Reference Cowley, Thomas, Roy, Wilson, Léon-Cortés, Guitiérrez, Bulman, Quinn, Moss and Gastzzon2001), building up high population densities. In contrast, Aricia agestis (Denis & Schiffermüller, 1775) is a much better disperser, and recently one of the most expansive butterfly species of Europe, but its population densities in general are considerably lower than in C. minimus (Bourn & Thomas, Reference Bourn and Thomas1993; Asher et al., Reference Asher, Warren, Fox, Harding, Jeffcoate and Jeffcoate2001; Lewis & Bryan, Reference Lewis and Bryant2002). Individuals of C. minimus from seven sites and A. agestis from eight sites were analysed by allozyme electrophoresis.
As a study area, we chose the Rhineland-Palantinate and the Saarland (southwest Germany), including some adjoining areas in Luxembourg and northeastern France. With our study, we intend to answer the following questions:
i) Do the two butterfly species show remarkable differences in their population genetic structures within and among the populations analysed?
ii) Is the low dispersal power and the high population density of C. minimus reflected in its genetic structure, e.g. by a high genetic differentiation among populations, but a relatively high genetic diversity of the single populations?
iii) Is the higher dispersal power and the lower average density of A. agestis mirrored in its genetic structure, as well, for example, by only moderate genetic differentiations among populations, eventually with a remarkable isolation-by-distance structure but only a relatively low average of the genetic diversity of the single populations due to this limited census size?
Materials and methods
Study species
Cupido minimus is a sedentary butterfly species, which builds up very high densities and exists in mostly isolated populations. Inferred from censuses and the geography of populations, Weidemann (Reference Weidemann1988) and Bink (Reference Bink1992) reported very low migration rates for this species, and Cowley et al. (Reference Cowley, Thomas, Roy, Wilson, Léon-Cortés, Guitiérrez, Bulman, Quinn, Moss and Gastzzon2001) ranked C. minimus as the most sedentary butterfly species in a comparison with 49 other British butterflies. Anthyllis vulneraria is the single food plant and main nectar source of C. minimus; and the species recently became mostly restricted to calcareous grasslands (Honnay et al., Reference Honnay, Coart, Butaye, Adriaens, Van Glabeke and Roldán-Ruiz2006), resulting in a patchy distribution (Ebert & Rennwald, Reference Ebert and Rennwald1991; Asher et al., Reference Asher, Warren, Fox, Harding, Jeffcoate and Jeffcoate2001; Van Swaay, Reference Van Swaay2002).
Aricia agestis has high dispersal power and quickly spreads to newly emerging habitats. Therefore, the species recently has extended its distribution considerably, e.g. in the UK (Bourn & Thomas, Reference Bourn and Thomas1993; Asher et al., Reference Asher, Warren, Fox, Harding, Jeffcoate and Jeffcoate2001; Lewis & Bryant, Reference Lewis and Bryant2002). In our study area, this species occurs on warm and dry slopes, meadows and fallow land (Ebert & Rennwald, Reference Ebert and Rennwald1991). The larvae feed on different Geranium species, Erodium cicutarium and Helianthemum nummularium in our study region (Settele et al., Reference Settele, Feldmann and Reinhardt1999). Aricia agestis shows lower intermediate densities (Bink, Reference Bink1992). Thus, the two analysed species represent two contrary behaviours of dispersal and population biology.
Sampling
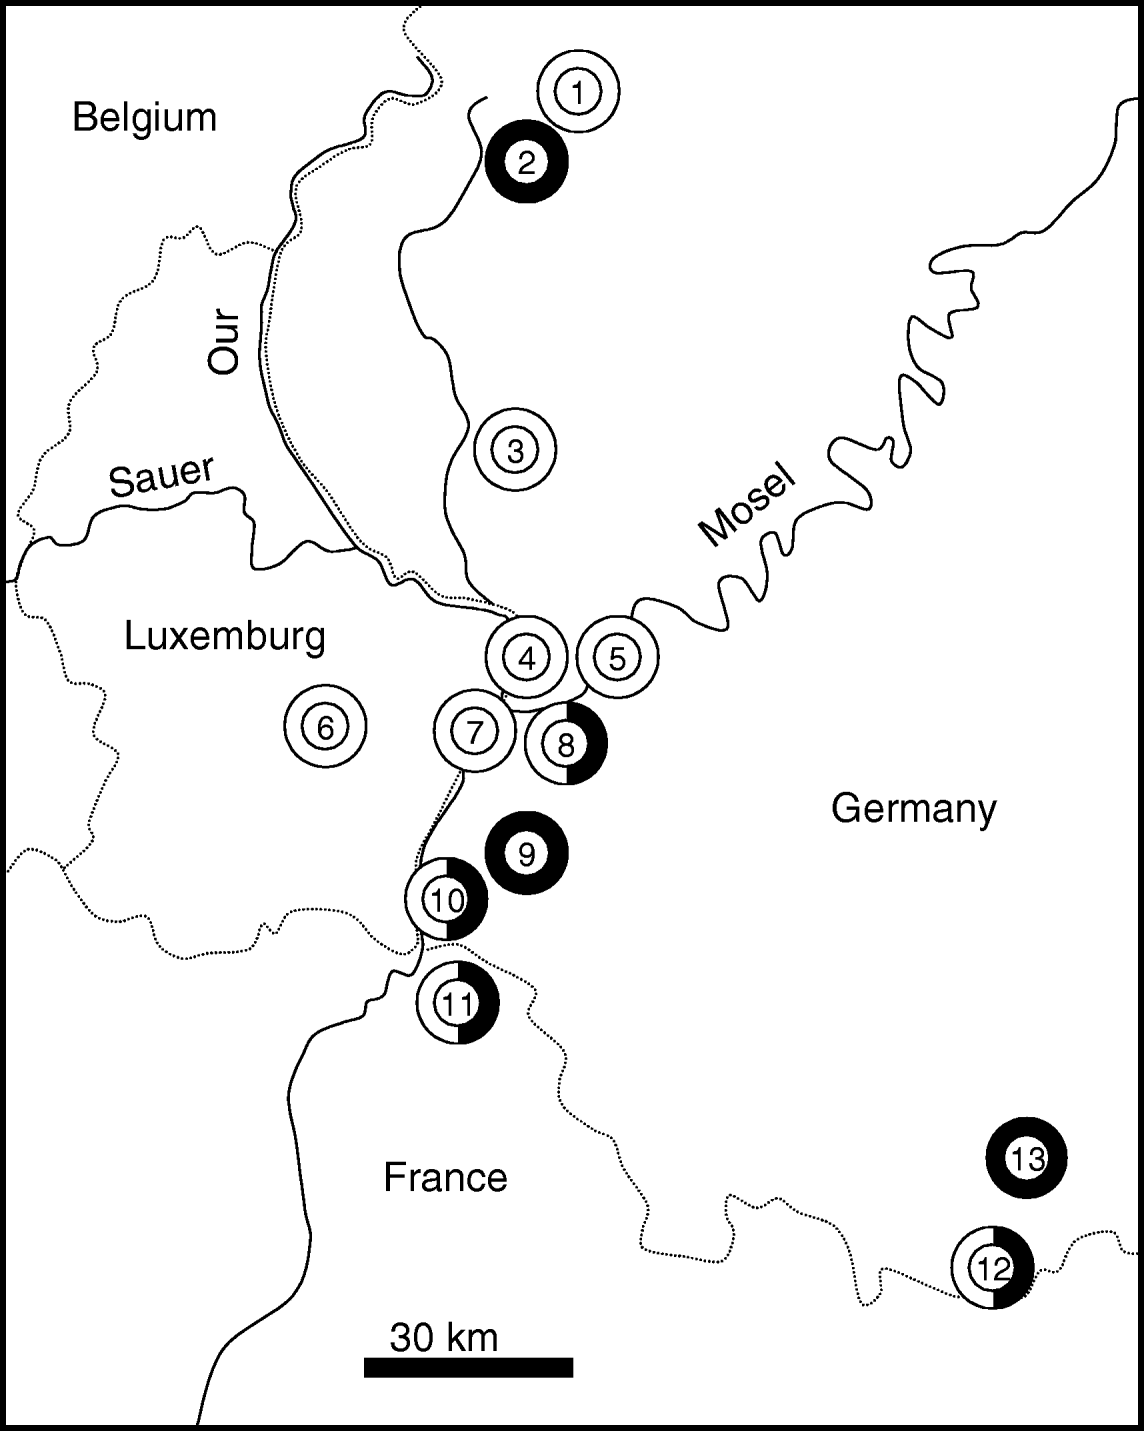
A total of 594 individuals of A. agestis and C. minimus were collected during the summers 2003 to 2005 in our study area (Rhineland-Palatinate and Saarland (western Germany) and adjacent regions of Luxembourg and northeastern France) (fig. 1) (314 individuals of A. agestis at eight sites, 280 of C. minimus at seven sites). Individuals were stored in liquid nitrogene until allozyme analysis. Sample sizes were 40 for each site of C. minimus and 38–40 individuals per site of A. agestis. We distinguished the sample locations in big and small habitats with 15 ha representing the threshold.
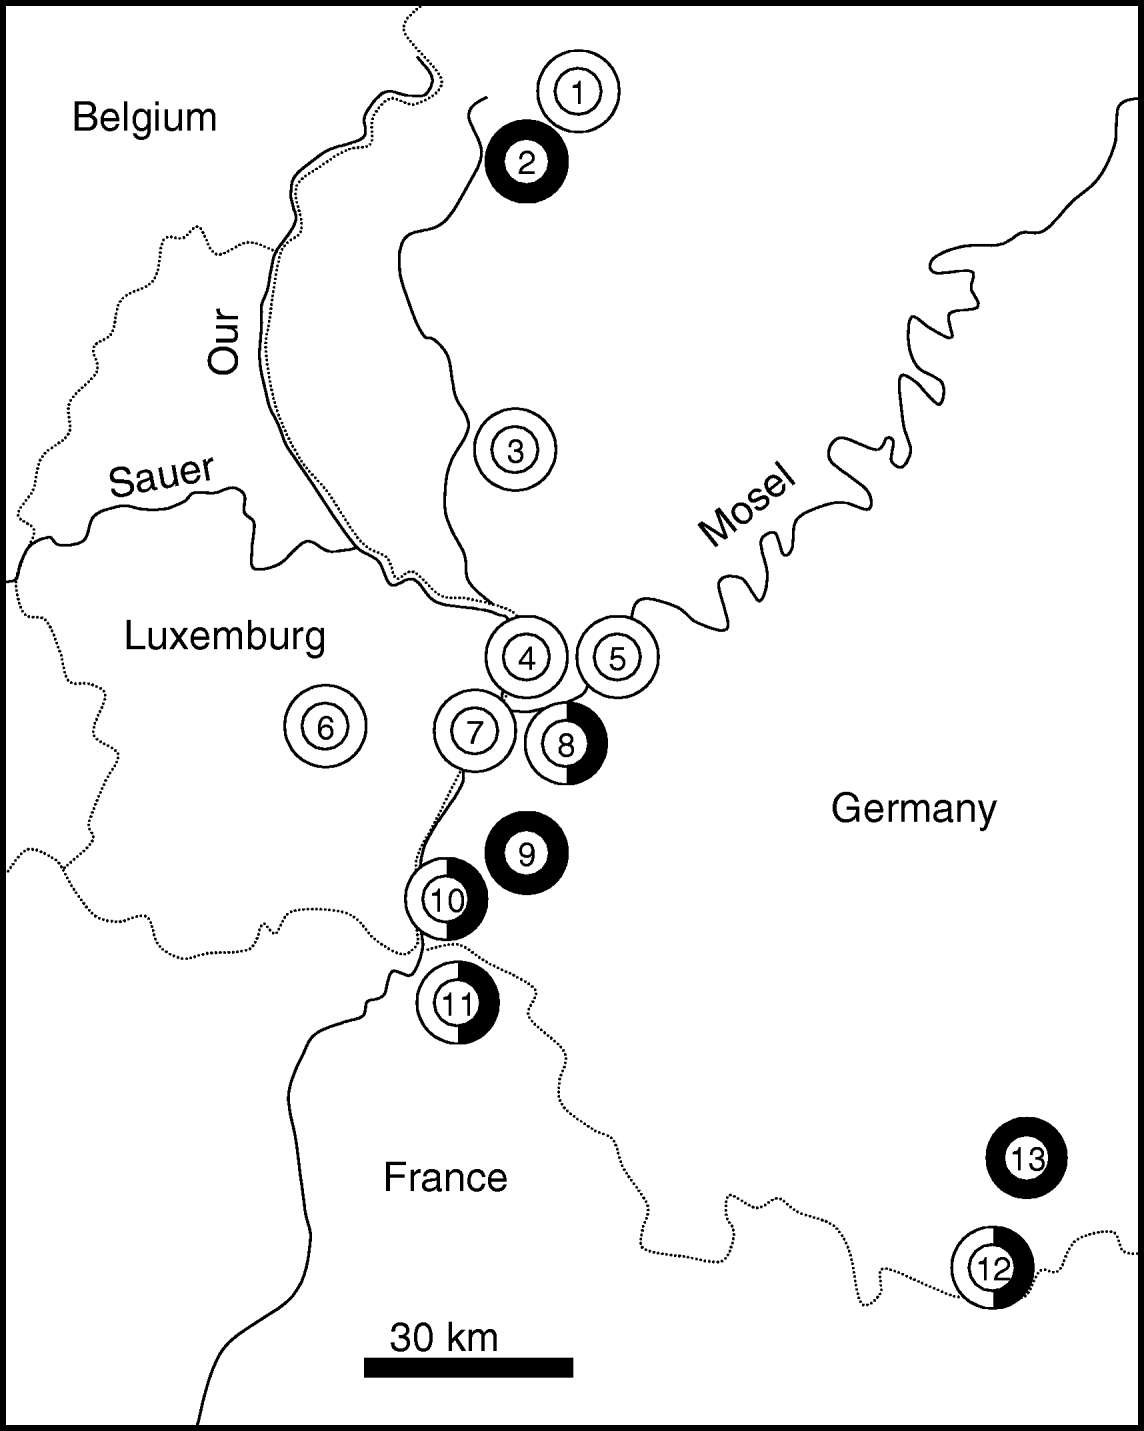
Fig. 1. The geographic location of the sample stations of Cupido minimus (black) and Aricia agestis (white) in Rhineland-Palatinate, Saarland, Loraine and Luxembourg. Dotted lines: country borders. 1, Lissendorf; 2, Weinsheim; 3, Ingendorf; 4, Igel; 5, Trier; 6, Niederanven; 7, Nittel; 8, Wasserliesch; 9, Freudenburg; 10, Perl; 11, Montenach; 12, Niedergailbach; 13, Mimbach.
Allozyme analysis
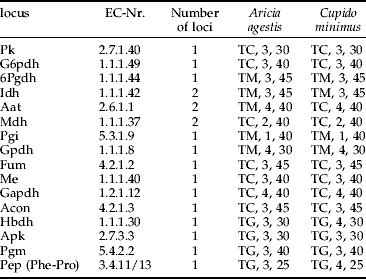
Half of the abdomens of the imagos were homogenised in Pgm-buffer (Harris & Hopkinson, Reference Harris and Hopkinson1978) by ultrasound and centrifuged at 17,000 Xg for 5 min. The remaining tissue was stored for further analysis. We ran electrophoreses on cellulose acetate plates (Hebert & Beaton, Reference Hebert and Beaton1993). We analysed 16 enzyme systems representing 19 loci for both species (for running conditions, see table 1).
Table 1. Electrophoretic conditions for the different enzymes analysed for Aricia agestis and Cupido minimus. For each species, the following information is given: buffer, applications of homogenate and running time at 200 V.
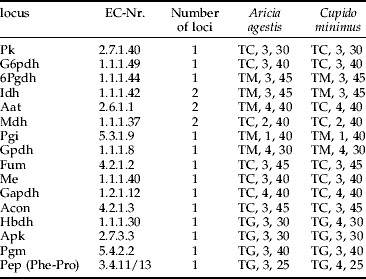
TC, Tris-citrate, pH=8.2 (Richardson et al., Reference Richardson, Baverstock and Adams1986); TG, Tris-glycine pH=8.5 (Hebert & Beaton, Reference Hebert and Beaton1993); TM, Tris-maleic acid pH=7.0 (adjusted from TM pH=7.8 (Richardson et al., Reference Richardson, Baverstock and Adams1986)).
Statistics
Alleles were labelled according to their relative mobility, starting with ‘1’ for the slowest. The allele frequencies and genetic distances (Nei, Reference Nei1978) were calculated with the package G-Stat (Siegismund, Reference Siegismund1993). Hardy-Weinberg equilibrium (Louis & Dempster, Reference Louis and Dempster1987), genetic disequilibrium (Weir, Reference Weir1991), locus by locus F-statistics and AMOVA variance analyses were calculated with the package Arlequin 2.000 (Schneider et al., Reference Schneider, Roessli and Excoffier2000). Differences among means were analysed by Friedmann ANOVAs, Wilcoxon matched pairs tests or Mann-Whitney U tests using STATISTICA. Mantel tests were performed using X-Stat (http://www.xlstat.com/de/home/, July 2006).
Results
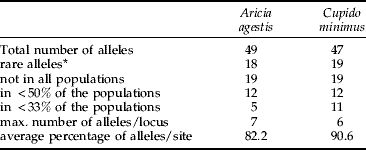
For C. minimus, 14 of the 19 loci analysed were polymorphic (see appendix) and only five loci had a single allele (Aat2, Fum, Gapdh, Acon, Hbdh). In A. agestis, only 11 of 19 loci analysed had two or more alleles (see appendix), whereas eight loci were monomorphic (6Pgdh, Idh2, Aat1, Gpdh, Fum, Gapdh, Acon, Apk). However, the total number of alleles detected in both species was quite similar, 49 in A. agestis and 47 in C. minimus (table 2). Both species also had similar mean numbers of alleles per locus (A. agestis: 2.12±0.10 SD, range 2.00–2.28; C. minimus: 2.24±0.22 SD, range 1.93–2.64; Wilcoxon test: P=0.176).
Table 2. Overview of detected alleles and their distribution pattern over the populations analysed of Aricia agestis and Cupido minimus.
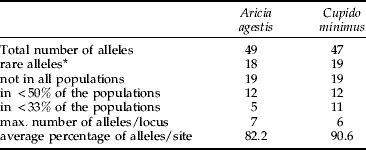
* , overall frequency of less than 5%.
Rare alleles (fraction <5%) were similarly common in C. minimus (19, i.e. 45.2% of all alleles) and A. agestis (18, i.e. 43.9% of all alleles). Nineteen alleles were not found in all populations of each of the two. Similar relations were found for alleles detected in less than half of the populations (C. minimus: 12, i.e. 28.6% of all alleles; A. agestis: 12, i.e. 29.3% of all alleles; Wilcoxon test: P=0.32). However, alleles observed in less than 33% of all populations were significantly more common in C. minimus (11, i.e. 26.2% of all alleles) than in A. agestis (5, i.e. 12.2%; Wilcoxon text: P<0.001). On average, 90.6% of all detected alleles were observed in a population of C. minimus, whereas 17.8% of all known alleles on average were missing in the A. agestis samples (table 2). The maximum number of alleles deteted per locus was higher in A. agestis (seven) than in C. minimus (six).
All further parameters of genetic diversity investigated were higher in C. minimus than in A. agestis (table 3). Except for P 95, these differences between both species were significant (H e: A. agestis: 15.7%±1.5 SD, range 13.6–17.8%; C. minimus: 18.3%±1.6 SD, range 16.2–19.8%, U test: P=0.012; H o: A. agestis: 12.1%±0.9 SD, range 10.5–13.4%; C. minimus: 17.3%±1.8 SD, range 15.1–19.3%, U test: P=0.001; P 95: A. agestis: 38.9±4.5 SD, range 33.3% to 44.4%, C. minimus: 42.9% ±10.1 SD, range 28.6–50.0%, U-test: P=0.481; P tot: A. agestis: of 52.1±4.4 SD, range 44.4–55.6%; C. minimus 73.5%±16.4 SD, range 50.0–100.0%, U test: P=0.007).
Table 3. Five parameters of genetic diversity for all populations analysed of Aricia agestis and Cupido minimus: mean number of alleles per locus (A), percentage of expected heterozygosity (H e), percentage of observed heterozygosity (H o), observed heterozygosity divided by the expected heterozygosity (H o/H e) percentage of loci with the most common allele not exceeding 95% (P 95) and total percentage of polymorphic loci (P tot).

e, Eifel; m, Mosel region; b, Bliesgau; A.a., Aricia agestis; C. m., Cupido minimus.
Tests for significant differences are performed using U test.
Remarkable deviations from Hardy-Weinberg equilibrium were detected after Bonferroni correction (A. agestis: G6pdh, Mdh1, Mdh2, Me in Perl (D), G6pdh, Aat2, Hbdh, Mdh1, Me, Pgm in Niedergailbach (D), G6pdh, Pgi, Hbdh, Me, Pgm in Igel (D), G6pdh, Aat2, Mdh2, Me in Lissendorf (D), G6pdh, Hbdh, Mdh2 in Niederanven (L), Me in Nittel (D) and G6pdh, Hbdh, Idh1, Mdh1 and Me in Ingendorf (D); C. minimus: Pgi and Pep in Wasserliesch (D), G6pdh in Badstube and Pep in Perl (D)). While 28 deviations from Hardy Weinberg equilibrium were detected for A. agestis, only four cases were found for C. minimus. No significant linkage disequilibrium was detected for any pair of loci, an expected result in species with about 24 chromosome pairs (Fernández-Rubio, Reference Fernández-Rubio1991).
All analysed parameters of genetic diversity were not significantly different between populations thriving on big and small patches in both species (U test: all P>0.05).
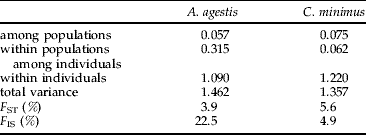
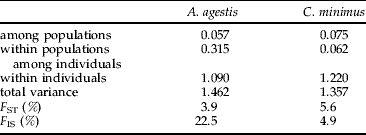
The total genetic variance among populations and within individuals was higher in C. minimus than in A. agestis (see table 4). The relative differentiation among populations of A. agestis (F ST=3.9%, P<0.001) was also lower than in C. minimus (F ST=5.6%, P<0.001). The F IS value was high for A. agestis (F IS=22.5%, P=0.001) and comparatively low for C. minimus (F IS=4.9%, P<0.001).
Table 4. Non-hierarchical variance analysis of the Aricia agestis and Cupido minimus populations analysed.
The mean of the genetic distances (Nei, Reference Nei1978) between C. minimus samples (0.0304±0.0103 SD) was higher than in A. agestis (0.0232±0.0096 SD). These means were marginally significantly different (U test, P=0.06). A significant isolation-by-distance system was detected in both species; this correlation between geographic and genetic distances was stronger in A. agestis (r²=0.318; Mantel test: P=0.003) than in C. minimus (r²=0.218, Mantel test: P=0.031) (fig. 2).

Fig. 2. Correlation between the geographic distances and the respective genetic distances (Nei, Reference Nei1978) of the populations of (a) Aricia agestis (r²=0.318; Mantel test: P=0.003) and (b) Cupido minimus (r²=0.218, Mantel test: P=0.031).
Discussion
The genetic diversity for all parameters analysed of the studied populations of C. minimus was higher than in A. agestis with most of the differences being significant. The parameters of the genetic diversity of both species are at an upper intermediate level in comparison with other butterfly and moth species (Porter & Geiger, Reference Porter and Geiger1988; Porter & Shapiro, Reference Porter and Shapiro1989; Descimon, Reference Descimon1995; Pelz, Reference Pelz1995; Johannesen et al., Reference Johannesen, Veith and Seitz1996, Reference Johannesen, Schwing, Seufert, Seitz and Veith1997; Meglecz et al., Reference Meglecz, Pecsenye, Peregovits and Varga1997; Schmitt & Seitz, Reference Schmitt and Seitz2001a; Habel et al., Reference Habel, Schmitt and Müller2005; Schmitt et al., Reference Schmitt, Röber and Seitz2005). However, genetic diversities tend to be rather high in lycaenid butterflies (Peterson, Reference Peterson1995; Brookes et al., Reference Brookes, Graneau, King, Rose, Thomas and Mallet1997; Schmitt & Seitz, Reference Schmitt and Seitz2001b; Schmitt et al., Reference Schmitt, Gießl and Seitz2003), and only some rare and localised species of this family show considerably lower values than in our case (Gadeberg & Boomsma, Reference Gadeberg and Boomsma1997; Packer et al., Reference Packer, Taylor, Savignano, Bleser, Lane and Sommers1998; Figurny-Puchalska et al., Reference Figurny-Puchalska, Gadeberg and Boomsma2000; Bereczki et al., Reference Bereczki, Pecsenye, Peregovits and Varga2005). Two other lycaenid butterflies analysed in the same study area (Polyommatus coridon: Schmitt & Seitz, Reference Schmitt and Seitz2002; Schmitt et al., Reference Schmitt, Gießl and Seitz2002; Polyommatus icarus: Schmitt et al., Reference Schmitt, Gießl and Seitz2003; both data sets adapted to the study area of this study), in general, show considerably higher values of their parameters of genetic diversity than C. minimus and A. agestis (table 5).
Table 5. Overview of the parameters of genetic diversity and F ST for four Lycaenidae in our study area.

For abbreviations, see table 3.
The genetic differentiation among the analysed C. minimus samples was comparatively high. The F ST value of 5.6% was in the order of magnitude or even higher than in common species on the continental scale (Porter & Geiger, Reference Porter and Geiger1995; Schmitt & Seitz, Reference Schmitt and Seitz2001b; Schmitt et al., Reference Schmitt, Gießl and Seitz2003, Reference Schmitt, Röber and Seitz2005; Habel et al., Reference Habel, Schmitt and Müller2005). Another habitat specialist butterfly, the skipper Thymelicus acteon, showed a quite similar value in the same study area (Louy et al., Reference Louy, Habel, Schmitt, Assmann, Meyer and Müller2007), whereas two common skipper species (T. sylvestris and T. lineola) and the two lycaenid species, P. coridon and P. icarus (Schmitt & Seitz, Reference Schmitt and Seitz2001b; Schmitt et al., Reference Schmitt, Gießl and Seitz2002, Reference Schmitt, Gießl and Seitz2003: table 5), had much less of their genetic variance distributed among populations.
The F ST value calculated for A. agestis is somewhat lower than in C. minimus but, nevertheless, higher than in the two other lycaenid species analysed in the same study area. However, the F IS of this species (22.5%) is considerably higher than in all the other studies mentioned above.
These values of genetic diversity of the populations and differentiation among populations reflect the population ecology and distribution patterns of both species in the study area. Cupido minimus is known as a very sedentary species (Weidemann, Reference Weidemann1988; Bink, Reference Bink1992; Baguette et al., Reference Baguette, Petit and Quéva2000), ranked as the most sedentary butterfly of the UK (Cowley et al., Reference Cowley, Thomas, Roy, Wilson, Léon-Cortés, Guitiérrez, Bulman, Quinn, Moss and Gastzzon2001). As the species is restricted to semi-natural calcareous grasslands in our study area, a strong restriction of gene-flow among the mostly isolated patches would seem to be the logical consequence, generating the observed high F ST value. Although A. agestis is also restricted to isolated habitat patches of extensively managed grasslands, the dispersal ability of this species is considerably higher (Bink, Reference Bink1992; Cowley et al., Reference Cowley, Thomas, Roy, Wilson, Léon-Cortés, Guitiérrez, Bulman, Quinn, Moss and Gastzzon2001; Thomas et al., Reference Thomas, Bourn, Clarke, Stewart, Simcox, Pearman, Curtis and Goodger2001), thus explaining the lower genetic differentiation among populations. Interestingly, A. agestis exhibits considerably higher genetic differentiation among populations (F ST=9.3%) in a regional study in the UK, where the habitat fragmentation is more pronounced than in our study area, thus leading to less exchange of individuals (Wynne et al., Reference Wynne, Wilson, Burke, Simpson, Pullin, Thomas and Mallet2008). The lack of genetic differentiation among populations of the widespread habitat generalist, P. icarus, in our study area (Schmitt et al., Reference Schmitt, Gießl and Seitz2003) fits with the genetic differentiation of the other lycaenid species analysed, as well as the low or missing differentiation in the two generalist skipper species, T. sylvestris and T. lineola, respectively (Louy et al., Reference Louy, Habel, Schmitt, Assmann, Meyer and Müller2007).
However, the rather low F ST value of P. coridon in the study area (1.4%) seems contradictory because this species is strongly restricted to semi-natural calcareous grasslands (Ebert & Rennwald, Reference Ebert and Rennwald1991; Asher et al., Reference Asher, Warren, Fox, Harding, Jeffcoate and Jeffcoate2001) and only moderately mobile but with occasional long distance dispersal (Ebert & Rennwald, Reference Ebert and Rennwald1991; Asher et al., Reference Asher, Warren, Fox, Harding, Jeffcoate and Jeffcoate2001; Cowley et al., Reference Cowley, Thomas, Roy, Wilson, Léon-Cortés, Guitiérrez, Bulman, Quinn, Moss and Gastzzon2001). However, the population densities and total numbers of individuals per population, in general, strongly exceed the ones observed, e.g. in A. agestis (Bink, Reference Bink1992). Therefore, genetic bottlenecks might be rare in P. coridon and occasional exchange of individuals between populations might not notably influence their genetic texture, thus not leading to an isolation-by-distance equilibrium, neither in our study area (Schmitt & Seitz, Reference Schmitt and Seitz2002) nor in a study in Lower Saxony (Krauss et al., Reference Krauss, Steffan-Dewenter and Tscharntke2004a).
In A. agestis, the relatively low mean population densities make this species prone to population bottlenecks and, thus, enhance the importance of immigration of individuals on the genetic texture of each single population. These ecological constraints might explain the evolution of a pronounced isolation-by-distance equilibrium over our study area, explaining about 32% of the genetic differentiation among populations. As population densities of C. minimus are, on average, considerably higher than in A. agestis and exchange of individuals between populations is much less, the isolation-by-distance system is less pronounced in C. minimus.
The ecological demands of these four lycaenid butterflies analysed in our study area are also mirrored in their genetic diversities; the lowest average genetic richness of the populations was found in A. agestis, the species with the lowest population densities and most probably frequent genetic bottlenecks. Such bottlenecks are further supported by the relatively low average percentage of alleles per population compared to all detected alleles (82%) being considerably lower than in C. miminus (91%), which most probably is less prone to bottlenecks. Apparently, the populations of the latter species are so large and stable that most of the populations' genetic diversity is preserved over time; a similar situation with even higher population densities and higher genetic richness was found in P. coridon (Schmitt & Seitz, Reference Schmitt and Seitz2002). In contrast, the total genetic diversity observed in A. agestis is not maintained within the single populations but by the interaction among populations in a metapopulation system; a somewhat similar situation, but in a widely distributed generalist species, might exist in the case of P. icarus (Schmitt et al., Reference Schmitt, Gießl and Seitz2003).
Conservation implications
Our results have a positive message for nature conservation in our study area. The genetic data obtained for the weakly dispersing C. minimus point out that this species is not vitally dependent upon an intact metapopulation structure. Rather, each population analysed seems to have a high survival probability based on the high genetic diversities found in all of them, and deleterious effects due to genetic depressions are little likely. Therefore, the conservation of its habitats is crucial for the survival of this species; here, the habitat quality is the driving force for the number of observed individuals and not the geographical extension. The density of the larval food plant, Anthyllis vulneraria, is of outstanding importance in the case of C. minimus (León-Cortés et al., Reference León-Cortés, Lennon and Tomas2003; Krauss et al., Reference Krauss, Steffan-Dewenter and Tscharntke2004b). The connectivity between habitats (and thus the exchange of single individuals) seems to be of less importance. Similar situations have been observed in other sedentary species, mostly based on ecological data sets (e.g. Hesperia comma, T. acteon and Mellicta athalia: Thomas et al., Reference Thomas, Bourn, Clarke, Stewart, Simcox, Pearman, Curtis and Goodger2001; Coenonympha tullia: Dennis & Eales, Reference Dennis and Eales.1997; Melitaea cinxia: Hanski, Reference Hanski1999; Polyommatus coridon: Schmitt et al., Reference Schmitt, Habel, Besold, Becker, Johnen, Knolle, Rzepecki, Schultze and Zapp2006; Maculinea alcon: Wallis DeVries, Reference Wallis DeVries2004, Habel et al., Reference Habel, Schmitt, Härdtle, Lütkepohl and Assmann2007).
The situation of A. agestis is strongly divergent from the one of C. minumus because of the existence of an intact metapopulation structure with an extinction-recolonisation cycle, and a strong gene-flow among habitats seems to be vital for this species (Habel, personal observations; Wynne et al., Reference Wynne, Wilson, Burke, Simpson, Pullin, Thomas and Mallet2008). This is underlined by the existence of a pronounced isolation-by-distance equilibrium in this species. Therefore, habitat quality itself and the geographical extension of patches apparently play a minor role. Similar situations are commonly observed in other species (Hanski, Reference Hanski1994; Nève et al., Reference Nève, Barascud, Hughes, Aubert, Descimon, Lebrun and Baguette1996; Mousson et al., Reference Mousson, Nève and Baguette1999).
The combination of these two opposed strategies warns against untroubled optimism because conservation strategies focused on one of these two groups distinguished above will have detrimental consequences for the other one. Further, several species follow one of the scenarios in one landscape, but seem to be completely adapted to the other one in other parts of the species' distribution area (e.g. Maculinea species: Wynhoff, Reference Wynhoff2001), thus making the definition of clear conservation guidelines even for single species a difficult task, if aimed on an interregional scale. Therefore, the combination of (i) a strict conservation of the existing habitats maintaining their quality for the species in focus on the one hand and (ii) a well elaborated conservation plan for the sustainment of habitat interconnections and metapopulations including the preservation of multiple stepping stone habitats on the other hand will be crucial to preserve the biodiversity resources of Central European agricultural landscapes with all their complexity.
Acknowledgement
We acknowledge a grant from the German Science Foundation DFG (grant number SCHM 1659/3-1 and 1659/3-2) and the scholarship ‘Arten- und Biotopschutz’ of Rhineland-Palatinate, enabling the collecting of trips and the allozyme electrophoresis. We thank Matthias Weitzel (Trier), Marc Meyer (Luxembourg) and Dirk Louy (Trier) for field assistance. We are grateful to the governments of the Rhineland-Palatinate, the Saarland and Luxembourg for the sampling permits and to France for not demanding such a permission. We thank Desmond Kime (La Fontaine) for critical comments on a draft version of this article and the correction of our English.
Appendix. Allele frequencies of all polymorphic loci of all populations analysed of Aricia agestis and Cupido minimus. Abbreviations of the sites as in fig. 1.
Aricia agestis

Cupido minimus


