Introduction
The Mediterranean flour moth, Ephestia kuehniella (Zeller), is a major pest of stored products (Marec, Reference Marec1991; Hill, Reference Hill2002; Rees, Reference Rees2003). The species is often found in flour, grain and where ever starchy products are stored (Sedlacek et al., Reference Sedlacek, Weston, Barney, Subramanyam and Hagstrum1996; Athanassiou et al., Reference Athanassiou, Kavallieratos, Palyvos and Buchelos2003, Reference Athanassiou, Kavallieratos, Palyvos, Sciarretta and Trematerra2005). The species is widely used to rear parasitoids and predators for use in integrated pest management of a number of major pests (e.g., Kim & Riedl, Reference Kim and Riedl2005; Hamasaki & Matsui, Reference Hamasaki and Matsui2006; Paust et al., Reference Paust, Reichmuth, Buttner, Prozell, Adler and Scholler2008), and in fundamental studies in molecular biology, behavior, and biochemistry (e.g., Corbet, Reference Corbet1973; Rahman et al., Reference Rahman, Roberts and Schmidt2007; Jamoussi et al., Reference Jamoussi, Sellami, Abdelkefi-Mesrati, Givaudan and Jaoua2009).
Many biotic factors affect development and growth of insects but temperature is the single most important abiotic factor affecting the poikilothermic organism development (Rwomushana et al., Reference Rwomushana, Ekesi, Ogol and Gordon2008; Pakyari et al., Reference Pakyari, Fathipour and Enkegaard2011a). Understanding the relationship between developmental rates and the temperatures a pest species experiences is critical to forecasting the seasonal occurrence of the pest and phenological events in their life cycle, such as egg hatch time, pupation, and adult emergence as well as for planning and implementing mass rearing and integrated pest management strategies (Kim & Lee, Reference Kim and Lee2010; Notter-Hausmann & Dorn, Reference Notter-Hausmann and Dorn2010; Ahn et al., Reference Ahn, Yang and Jung2012). Foundational to understanding this relationship is to develop a reliable model of temperature-dependent development for the target species.
An insect's developmental rate is almost linear below the limit of sub-lethal maximum temperatures (Pakyari et al., Reference Pakyari, Fathipour and Enkegaard2011a; Liu et al., Reference Liu, Liu, Yang, Kontodimas, Yu and Lian2014) and a linear model is widely used to describe the relationship between developmental rate and a limited range of temperatures as it enables estimation of the thermal constant and lower temperature threshold (Campbell et al., Reference Campbell, Frazer, Gilbert, Gutierrez and Mackauer1974). The developmental rate is basically zero at and below the lower threshold temperature. At the optimal temperature, development rate is maximal, and drops quickly at temperatures above the optimum (Roy et al., Reference Roy, Brodeur and Cloutier2002; Pakyari et al., Reference Pakyari, Fathipour and Enkegaard2011b).
Even though the relationship between developmental rate and temperature is nearly linear at intermediate temperatures, it is curved near the lower and higher threshold temperatures (Wagner et al., Reference Wagner, Wu, Sharpe, Schoolfield and Coulson1984). Various nonlinear models have been utilized to describe the relationship between developmental rate and temperature (Roy et al., Reference Roy, Brodeur and Cloutier2002; Kontodimas et al., Reference Kontodimas, Milonas, Stathas, Economou and Kavallieratos2007; Zahiri et al., Reference Zahiri, Fathipour, Khanjani, Moharramipourand and Zalucki2010; Golizadeh & Zalucki, Reference Golizadeh and Zalucki2012). Nonlinear models enable estimation of the optimal temperatures and upper threshold temperatures for various stages of an insects’ development. Temperature-driven rate models have been utilized to forecast the seasonal population dynamics and activity of pests (Roy et al., Reference Roy, Brodeur and Cloutier2002; Liu et al., Reference Liu, Liu, Yang, Kontodimas, Yu and Lian2014). Wagner et al. (Reference Wagner, Wu, Sharpe, Schoolfield and Coulson1984), Hagstrum & Milliken (Reference Hagstrum and Milliken1988), and Subramanyam & Hagstrum (Reference Subramanyam and Hagstrum1993) highlighted the nonlinear relationship between temperature and development for several beetles of stored product.
For stored-product pest moths comprehensive data are available on the temperature influences on development times of insects reared at various humidity levels and on different diets (Subramanyam & Hagstrum, Reference Subramanyam and Hagstrum1993). Previous studies provide information on the influence of temperature and humidity on E. kuehniella at 16L:8D photoperiod but over a limited range of temperatures (20–30°C) (Siddiqui & Barlow, Reference Siddiqui and Barlow1973; Subramanyam & Hagstrum, Reference Subramanyam and Hagstrum1993). For mass production of this moth factory managers prefer to rear in the dark (saves on lighting costs) and in some cases maintaining life history stages at low temperatures can be advantageous (to delay development). Estimates of upper lethal temperatures would be useful as it better defines the thermal bounds within which a rearing facility will need to operate.
Our aim was to clarify the survival and developmental rate of each stage of E. kuehniella at a range of constant temperatures thereby facilitating the development of factory based mass rearing of this species. We reared immatures in the dark which is not normally done for this species. We calculated the lower threshold temperature and thermal constant for each stage of E. kuehniella using a linear model. In addition, nonlinear models were utilized to estimate the optimal temperatures and upper temperature threshold for each stage.
Material and methods
Our primary laboratory culture was built up utilizing 0.02 g of eggs gathered from infested wheat flour acquired from the Biological Control Research Institute of Gorgan, Iran. The eggs were put on a mix of 30 g yeast powder and 970 g wheat flour. The eggs were kept in metal containers (30 × 20 × 5 cm) wrapped with black cloth. The culture was maintained under room conditions set at 28 ± 2°C, 50 ± 5% relative humidity (RH), and a photoperiod of 0:24 (L:D) h.
Fifty pairs of moths (a male and female <12 h old) were obtained from the laboratory culture, placed in a Plexiglas oviposition box (6 × 6 × 17 cm) and provisioned with cotton soaked with 5% sugar–water as a source of nourishment. The mouth of the container was covered with a fine mesh gauze cover. Eggs laid were gathered daily from the gauze and individually moved to Petri dishes (50 mm diameter, 10 mm deep) utilizing a no. 0 brush. Each egg was stuck onto a black cardboard with sugar solution (10%).
Eggs (n = 100) were incubated and monitored daily and developmental characteristic of E. kuehniella were determined at nine temperatures: 10, 15, 17.5, 20, 22.5, 25, 27.5, 30 and 32.5°C (each ±0.5°C), 50 ± 5% RH, and a photoperiod of 0:24 (L:D) h in incubators (Binder KBWS 240, Germany). After eggs hatched, larvae at each temperature were transferred to Petri dishes provided with 20 mg of artificial diet (97% wheat flour + 3% yeast powder) until pupation (Coelho & Parra, Reference Coelho and Parra2013). These Petri dishes were placed in growth chambers with constant temperature at 15, 17.5, 20, 22.5, 25, 27.5, 30 and 32.5°C (each ±0.5°C) for development of larvae and pupae and monitored once daily.
Upon adult emergence the sex of the adults was determined to estimate the male to female ratio. For sex determination of adults, we used the morphology of the abdominal tip; in females remains quiet with the abdomen tip raised well above the level of her body with her ovipositor protruding 2–4 mm (Brindley, Reference Brindley1930). Survival rates of each stage were evaluated.
Temperature and development rate
The relationship between the temperature and rate of development was estimated utilizing the common linear model and six non-linear models (table 1). The common linear model or degree-day (DD) model estimates a lower threshold temperature and thermal constant (K), as follows:
where T is the temperature (°C), D r is the rate of development (days−1), a is the intercept, and b is the slope. The thermal constant (K, DD) and the lower threshold temperature (T 0) were evaluated as follows: T 0 = −a/b and K = 1/b (Campbell et al., Reference Campbell, Frazer, Gilbert, Gutierrez and Mackauer1974).
Table 1. Mathematical models utilized to describe the influence of temperature on the development of Ephestia kuehniella.

In Analytis-3/Kontodimas 16 model, a is an empirical constant, T is the rearing temperature (°C), and T max is the higher threshold temperature. In the Davidson logistic model, a, b, and K are empirical constants and T is the rearing temperature (°C). In both Logan 6/Lactin 2 and Logan 6/Lactin 1 models, T is the rearing temperature (°C), ρ is a constant defining the rate of optimum temperature, T max is the higher threshold temperature, Δ is the temperature range over physiological breakdown becomes the overriding influence and λ forces the curve to intercept the y-axis at a value below zero and thus allows the estimation of a low threshold temperature. In the Janish/Kontodimas model, T is the rearing temperature (°C), D min is the lower threshold temperature, T opt is the optimum temperature, and K and λ are empirical constants. In the Janish/Rosha model, T is the rearing temperature (°C), a, b, and C are empirical constants, and T min is the lower threshold temperature.
Among six nonlinear models commonly found in the literature, five of them can be used to estimate the lower and upper threshold temperature and optimal temperature for development: the Analytis-3/Kontodimas16 (Kontodimas et al., Reference Kontodimas, Eliopoulos, Stathas and Economou2004), Logan6/Lactin2 (Lactin et al., Reference Lactin, Holliday, Johnson and Craigen1995), Janish/Kontodimas (Kontodimas et al., Reference Kontodimas, Eliopoulos, Stathas and Economou2004), Janish/Rosha (Rochat & Gutierrez, Reference Rochat and Gutierrez2001), and Logan6/Lactin1 (Lactin et al., Reference Lactin, Holliday, Johnson and Craigen1995) (table 1).
Model fit was assessed on the following criteria: (1) the coefficient of determination (R 2); a higher value of R 2 demonstrates better fit, and (2) the residual sum of square (RSS); a lower RSS demonstrated better fit.
The R 2 value is not suitable for separating models with a different number of parameters since models with more parameters will generally give a superior fit. We utilized (3) the adjusted coefficient of determination R adj2, and (4) the Akaike information criterion (AIC), which are independent of the parameter number. A ‘good’ model should have a lower AIC value (Akaike, Reference Akaike1974; Vucetich et al., Reference Vucetich, Peterson and Schaefer2002), where AIC is:
where n is the number of observations, p is the number of model parameters involving the intercept, and SSE is the residual sum of squared error. A higher value of R adj2 demonstrates a better fit (Pakyari et al., Reference Pakyari, Fathipour and Enkegaard2011a). R adj2 was evaluated from the below equation:
where n is the observations number, p is the model parameter numbers, and R 2 is the nonlinear regression coefficient.
Statistical analysis
The temperature treatment influence on the development, sex ratio, and mortality during each stage was tested utilizing one-way analysis of variance (ANOVA). Normality tests were used to determine whether a data set is well-modeled by a normal distribution. If data were not normal, we utilized the arcsin-square root transformation for proportional data. If significant treatment effects were found, multiple mean comparisons were made utilizing the least significant difference (LSD) test (P < 0.05). The ANOVA was accomplished utilizing MINITAB software (MINITAB INC., 2000). The SPSS statically program (V. 13.0; SPSS, 2004) was utilized to estimate temperature-dependent models.
Results
Temperature development time studies
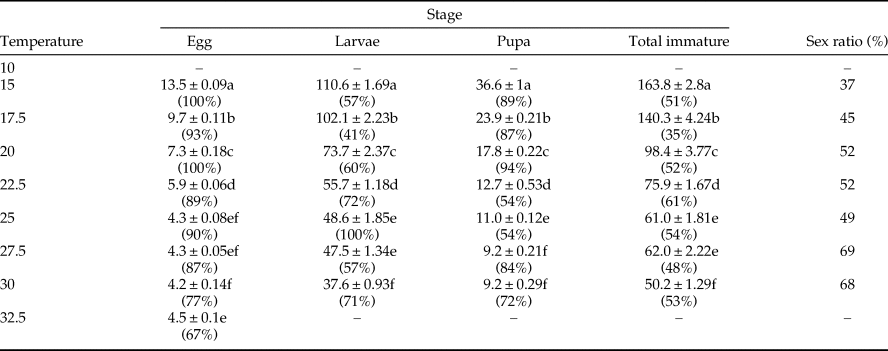
E. kuehniella completed development from egg to adult at seven temperatures between 15 and 30°C; none successfully completed development at 10 and 32.5°C (table 2).
Table 2. Development time (day ± SE) and stage survival (%) of immature stages of Ephestia kuehniella at eight constant temperatures.

Sex ratio is the percentage female.
Temperature had a significant effect on the egg development of E. kuehniella (table 2). No E. kuehniella egg could survive at 10°C. Mean egg development time ranged from 4.2 days at 30°C to 13.5 days at 15°C. Larval mean development time ranged from 37.6 days at 30°C to 110.6 days at 15°C. Pupal development ranged from a mean of 9.2 days at 27.5°C to 36.6 days at 15°C. Mean total development ranged from 50 days at 30°C to 164 days at 15°C (table 2).
Survivorship for immature stages was highest at 22.5°C (table 2). Egg mortality was high at 30 and 32.5°C (table 2). Sex ratio (male to female) of E. kuehniella was in favor of females in the range of 20–30°C. This suggests males are less heat tolerant and females less cold tolerant, with a 50% sex ratio at intermediate temperatures.
Model assessment
The linear model demonstrated a good fit to the data for the entire immature stages with high R 2 (>0.95) and R adj2 (>0.94) values (table 3). From the linear regression model E. kuehniella needed 1111 DD to finish development from egg to adult with a lower threshold temperature of 9°C.
Table 3. The parameters calculated by the common linear regression model between development rate (D r) and temperature (T) for different immature stages of Ephestia kuehniella.

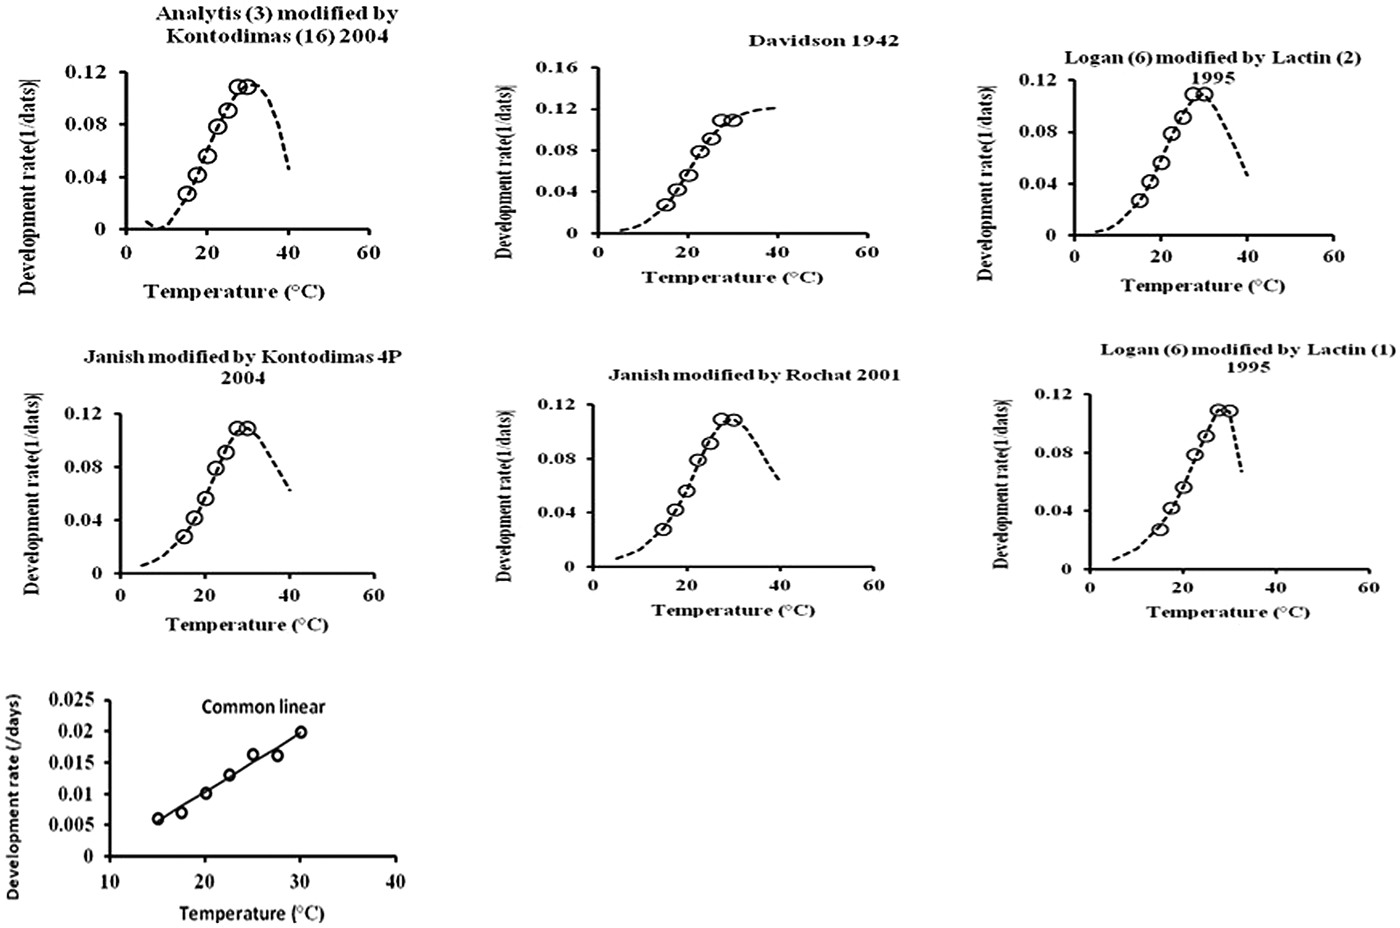
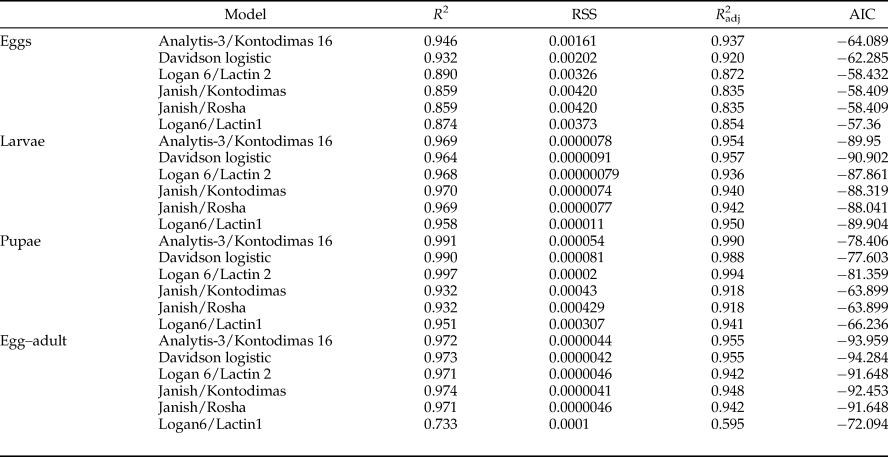
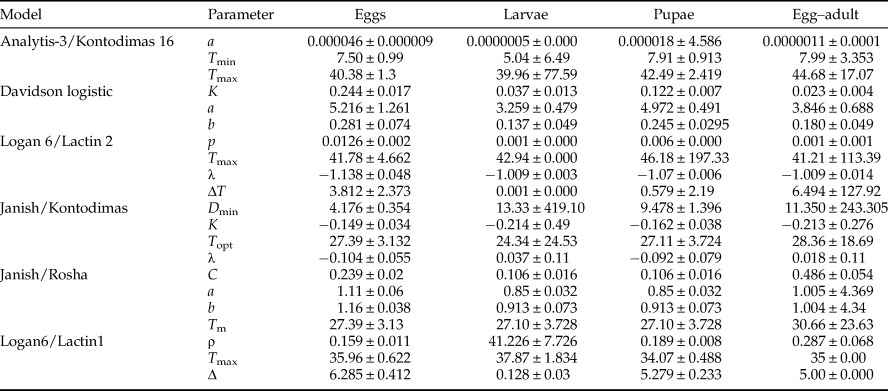
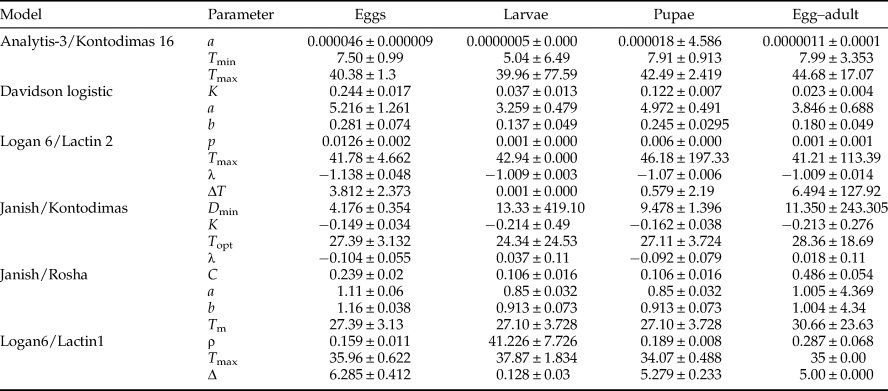
All six models fitted the data well within the temperature range 15–30°C (table 4, fig. 1). The values of AIC, RSS, R 2, and R adj2 utilized to estimate the goodness-of-fit for each model demonstrated that Analytis-3/Kontodimas 16, with the highest values for R 2 and R adj2 and the lowest values for AIC and RSS, provided the best fit to the data (table 4). The R adj2 for six nonlinear models for all developmental stages were in the range of 0.595–0.990 (table 4). The Analytis-3/Kontodimas 16 model had the highest R adj2 for all immature stages (table 4). The T opt for the development of egg, larvae, pupa, and the egg–adult stage estimated by the Janish/Kontodimas model ranged between 24 and 28°C. The T min and T max for the development of egg, larvae, pupa, and the egg–adult stage estimated by the Janish/Kontodimas and Logan6/Lactin1 ranged between 4 and 13°C and 34 and 38°C, respectively (table 5), whereas T max from the Analytis-3/Kontodimas 16 model were much higher (table 5).
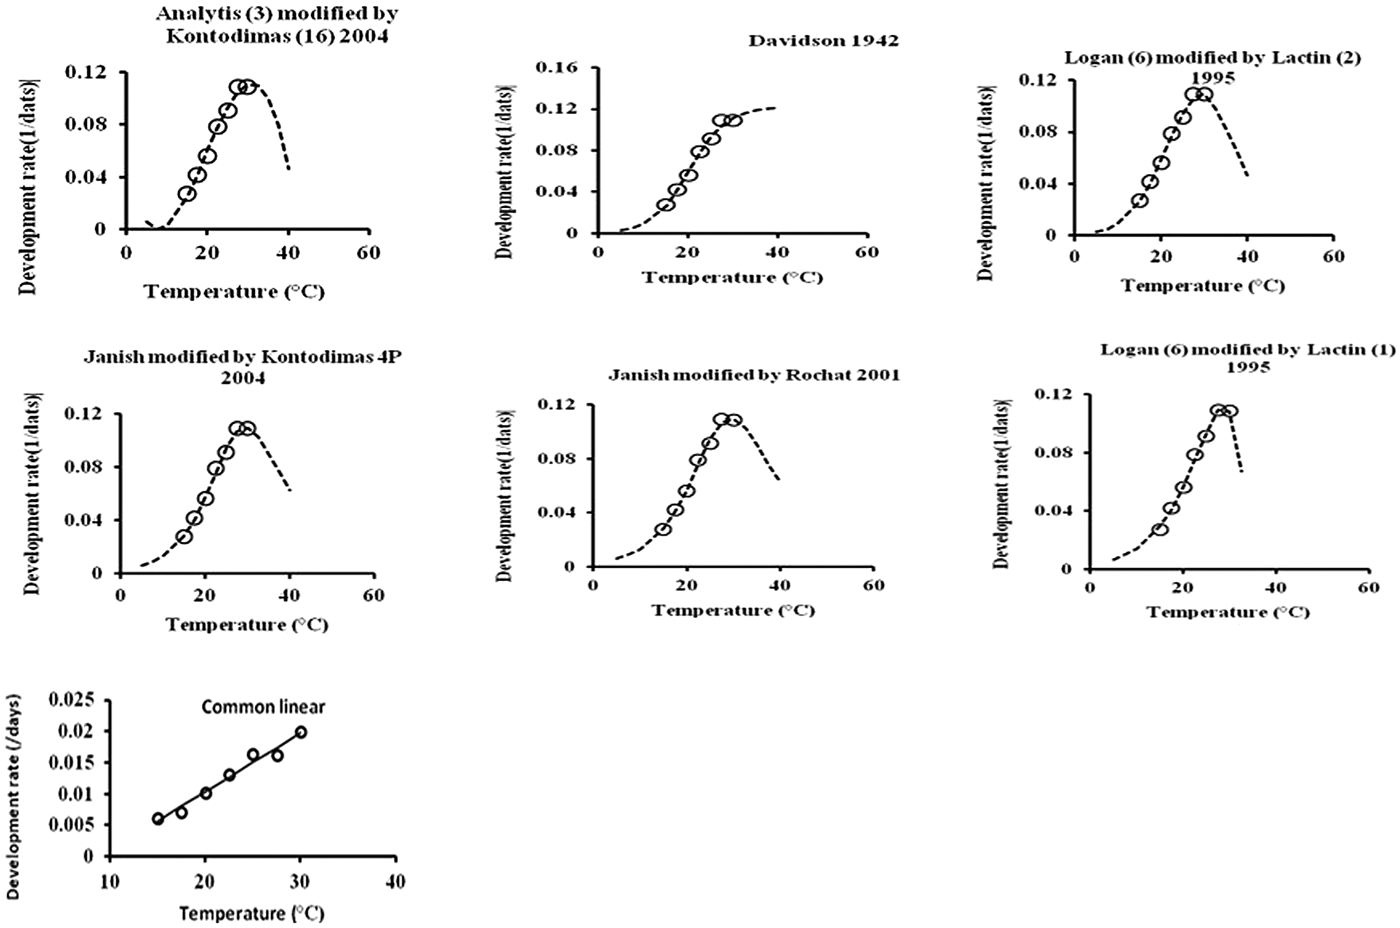
Fig. 1. Fitting the one linear and six nonlinear models to observed values of development rate for overall immature stages of E phestia kuehniella.
Table 4. Performance of non-linear models describing the relationship between temperature (°C) and development rates for all immature stages of Ephestia kuehniella.
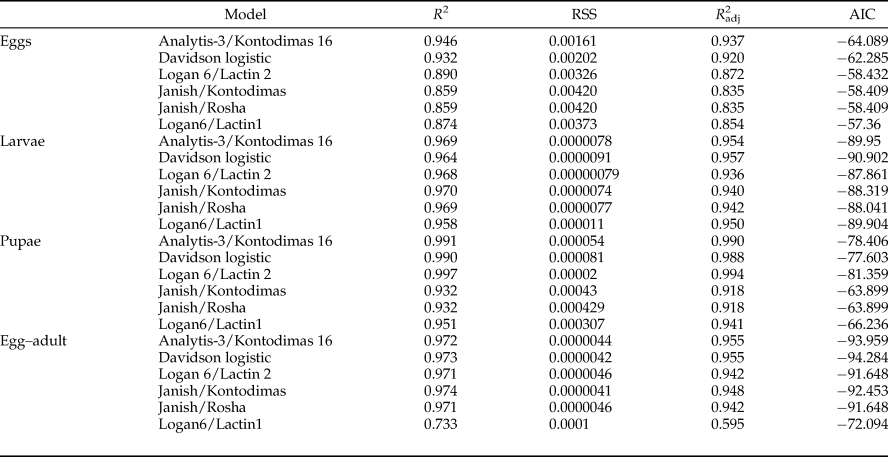
The best fit model for each stage is highlighted (see text for criteria).
Table 5. Parameter values calculated for various non-linear models for the development rate of life history stages of Ephestia kuehniella (eggs, larvae, pupae, and egg to adult) as a function of temperature.
Discussion
Our studies demonstrated that E. kuehniella is strongly affected by temperature, as expected (Siddiqui & Barlow, Reference Siddiqui and Barlow1973; Subramanyam & Hagstrum, Reference Subramanyam and Hagstrum1993; Coelho & Parra, Reference Coelho and Parra2013; Pakyari et al., Reference Pakyari, Amir-Maafi and Moghadamfar2016). All development times were longer at low temperatures than at the higher temperatures within the range of 15–30°C. Over the range of 20–30°C, survival from egg to adult exceeded 50% except at 25°C; at 15°C, it was 33%. Jacob & Cox (Reference Jacob and Cox1977) found survival from egg to adult exceeded 50%, over the range of 15–28°C but was lower (36%) at 25°C. Our development time at 25°C (61 days) was lower than that reported by Jacob & Cox (Reference Jacob and Cox1977) (104 days) but longer than that reported by Siddiqui & Barlow (Reference Siddiqui and Barlow1973) (46 days). These differences may reflect rearing differences in humidity and photoperiod utilized in the previous research (Moghadamfar et al., Reference Moghadamfar, Amir-Maafi and Pakyari2018). There was no survival or development at 10°C of any stages. At 32.5°C, eggs survived and larvae hatched but no larvae completed development. A suitable compromise between short developmental time and high survival rates would be to keep the egg and larvae at 25°C.
Our results and various published studies demonstrated that E. kuehniella is a factitious host that provides desirable nutritional quality for mass rearing of egg parasitoids. Eggs can be kept at 15°C; they will remain viable but development can be greatly delayed. To increase egg production Coelho & Parra (Reference Coelho and Parra2013) found adults reared at low temperatures were heavier, laid more eggs, and had longer lifespans that those reared from higher temperatures (28, 30, and 32°C). In addition, high temperatures (above 27.5°C) and low temperatures (10°C) during the larvae stage can lead to adult male sterility of E. kuehniella (Siddiqui & Barlow, Reference Siddiqui and Barlow1973; Daumal & Boinel, Reference Daumal and Boinel1994). The highest sex ratio of E. kuehniella occurred in the range of 27.5–30°C. A near equal sex ratio of males and females occurred in the range of 22.5–25°C. However, a bias in sex ratio might occur because of many factors (Hardy, Reference Hardy1994); such as host quality (Price, Reference Price1997), birth, death (Sapir et al., Reference Sapir, Mazer, Holzapfel, Erik and Brian2008), and environmental conditions (Wrensch & Ebbert, Reference Wrensch and Ebbert1993). Consistently female-biased E. kuehniella sex ratios may profit biological control because of increased host for parasitoid mass rearing.
The common linear model (Campbell et al., Reference Campbell, Frazer, Gilbert, Gutierrez and Mackauer1974) is widely utilized for evaluating the thermal constant and lower threshold temperature (Roy et al., Reference Roy, Brodeur and Cloutier2002; Zahiri, et al., Reference Zahiri, Fathipour, Khanjani, Moharramipourand and Zalucki2010; Pakyari et al., Reference Pakyari, Fathipour and Enkegaard2011a) as it is easy to calculate (Walgama & Zalucki, Reference Walgama and Zalucki2006; Pakyari et al., Reference Pakyari, Fathipour and Enkegaard2011a). The lower temperature threshold average value for the different immature stages of E. kuehniella was observed to be around 10°C and was near to that found by Subramanyam & Hagstrum (Reference Subramanyam and Hagstrum1993) and Howe (Reference Howe1965) (9–10°C). The thermal constant for immatures to complete development (1111 DD) is higher than that found by Subramanyam & Hagstrum (Reference Subramanyam and Hagstrum1993) (724 DD). There can be many reasons for such a difference, including diet, different population being used but rearing in the dark is expected to increase development time (Cymborowski & Giebułtowicz, Reference Cymborowski and Giebułtowicz1976). Moghadamfar et al. (Reference Moghadamfar, Amir-Maafi and Pakyari2018) investigated development and reproduction of E. kuehniella at two photoperiods (continuous darkness and 16L:8D photoperiod) under laboratory condition (30 ± 0.5°C and 50 ± 5% RH). They found that egg and larval development time were significant longer under continuous dark conditions than the 16L:8D photoperiod similar to our findings.
The developmental rate of E. kuehniella was well described by six non-linear models but the values of T max calculated by three nonlinear models ranged from 34 to 46°C, much higher than the temperature at which the insects could complete development in our study, 30°C and none developed at 32.5°C. The T max estimated here (34–46°C) is higher than that reported by Subramanyam & Hagstrum (Reference Subramanyam and Hagstrum1993) (29.11°C) using the Stinner model and fewer temperatures (20–30°C). The Stinner equation (Stinner et al., Reference Stinner, Gutierrez and Butler1974) is symmetrical around the optimum and so prone to overestimate the high temperature parameter (Zahiri et al., Reference Zahiri, Fathipour, Khanjani, Moharramipourand and Zalucki2010). The cautionary tale here is that just because a model ‘fits’ it does not necessarily give biologically realistic values.
The most essential parameter evaluated by the non-linear models is T opt, which is the temperature at which physiological processes are at a maximum. The model-averaged calculated T opt for each stage of development varied from 24 to 31°C, which were consistent with the temperature at which the most rapid development rate occurred (30°C). Howe (Reference Howe1965) found 24–27°C as the T opt range, slightly lower than those we estimated. Coelho & Parra (Reference Coelho and Parra2013) reported a T opt range for the development of E. kuehniella was between 20 and 30°C. Above 30°C there was a sharp decrease of egg development, and the larvae did not survival temperature above 34°C. Maintaining the mass rearing facility for this species within this temperature range will ensure suitable conditions for its basic biology and to produce large number of high quality insects for subsequent use in biological control programs or for research.
Our research demonstrated the temperature dependent development of E. kuehniella under a wide range of constant temperatures without light. Our developmental rate model can be utilized to calculate the development time of this species under various conditions of temperatures differing inside an appropriate range with the aim of developing an improved integrate pest management tactics in stored product situations. Information on the thresholds of development and thermal requirements can be utilized to predict E. kuehniella population dynamics and phenology and to evaluate optimal temperature conditions for mass rearing for other purposes.
Acknowledgements
We express great appreciation to the Islamic Azad University, Takestan Branch, Iran, and Iranian Research Institute of Plant Protection, Tehran, Iran, for providing generous support for the conduct of this study.


