Introduction
Predator-prey interactions are important processes driving animal population dynamics and are central to many ecological studies. Identification of trophic links can be difficult without disturbing the system under study, especially in predators which are small, active at night or living in the soil. Post-mortem determination of predator diets, using gut content analysis, is an accurate method, as the predators can be assumed to have been behaving naturally prior to their capture. Visual examination of predator gut contents is possible if recognisable prey fragments are ingested by the predator (Ingerson-Mahar, Reference Ingerson-Mahar and Holland2002). As most invertebrate predators are at least partly fluid feeders, many trophic links are inevitably missed using this approach. Biochemical and molecular techniques overcome these problems and have been rapidly developed over the last two decades (reviewed in Symondson, Reference Symondson2002; Sheppard & Harwood, Reference Sheppard and Harwood2005; Sunderland et al., Reference Sunderland, Powell, Symondson and Jervis2005; King et al., Reference King, Read, Traugott and Symondson2008). PCR-based techniques of post-mortem gut content analysis have been widely used and applied to insect predator-prey systems, including Coleoptera, Diptera, Heteroptera, Homoptera, Lepidoptera, Neuroptera and Collembola but also Annelida, Crustacea, Arachnida and Mollusca (Harper et al., Reference Harper, King, Dodd, Harwood, Glen, Bruford and Symondson2005; Read et al., Reference Read, Sheppard, Bruford, Glen and Symondson2006; Gariepy et al., Reference Gariepy, Kuhlmann, Gillott and Erlandson2007; Juen & Traugott, Reference Juen and Traugott2007). Although several studies investigate parameters that might affect detection periods and amplification success (Agustí et al., Reference Agustí, De Vicente and Gabarra1999; Zaidi et al., Reference Zaidi, Jaal, Hawkes, Hemingway and Symondson1999; Chen et al., Reference Chen, Giles, Payton and Greenstone2000; Hoogendoorn & Heimpel, Reference Hoogendoorn and Heimpel2001; Juen & Traugott, Reference Hoogendoorn and Heimpel2005), several factors remain to be explored, such as the effect of ambient temperature and predator taxon. The more we know about which factors affect prey DNA detection success, the better we will be able to interpret field-derived data and assess trophic links and their strength in natural systems.
One of the fundamental parameters affecting prey DNA detectability is the time elapsed since feeding (Symondson, Reference Symondson2002). In general, DNA detectability decreases with increasing digestion time, but considerable differences between predator species have been reported (Chen et al., Reference Chen, Giles, Payton and Greenstone2000; Hoogendoorn & Heimpel, Reference Hoogendoorn and Heimpel2001; Ma et al., Reference Ma, Li, Keller, Schmidt and Feng2005; Read et al., Reference Read, Sheppard, Bruford, Glen and Symondson2006; Greenstone et al., Reference Greenstone, Rowley, Weber, Payton and Hawthorne2007; Harwood et al., Reference Harwood, Desneux, Yoo, Rowley, Greenstone, Obrycki and O'Neil2007; Traugott & Symondson, Reference Traugott and Symondson2008). Furthermore, Hoogendorn & Heimpel (Reference Hoogendoorn and Heimpel2001) showed that an increase of ambient temperature significantly decreases prey DNA detectability within a coccinellid predator, indicating that temperature influences the rate of DNA digestion. Likewise, the size of the target DNA molecule influences the amplification success of prey DNA. This was first recognised by Zaidi et al. (Reference Zaidi, Jaal, Hawkes, Hemingway and Symondson1999), who showed longer post-feeding detection of a smaller amplicon (up to 28 h), compared with larger amplicons that were rapidly degraded.
In the present study, we investigated, in a full-factorial experimental design, whether ambient temperature and fragment length affect the post-feeding detectability of prey DNA in two different but closely related predator species. We hypothesised that: (i) the detectability of prey DNA differs even between closely related predator species (within one family), and (ii) the post-feeding prey detection period is affected by ambient temperature and target fragment size. Based on these results, we discuss whether PCR-based prey detection might allow us to calculate the time at which predation occurred in the field.
Materials and methods
Insects
During October 2005, adult carabid beetles, Nebria brevicollis (F.) and Pterostichus melanarius (Ill.), were collected from two fields at Burdens farm, Wenvoe, near Cardiff, UK by pitfall trapping and hand searching. Beetles were transferred individually into plastic containers (8.5 cm diameter, 4.5 cm height) filled with 80 g moist sphagnum peat and maintained in a controlled environment (L:D 16:8; 16°C). They were fed with one Calliphora vomitoria (L.) larva twice a week. Prior to the feeding experiments, beetles were starved for five days to ensure the same nutritional status in all individuals. Grain aphids, Sitobion avenae (F.), were reared on wheat plants in fine mesh cages. From these cultures, adult aphids were removed and frozen as prey for the subsequent feeding experiments at −80°C. Both carabid species are known to feed on cereal aphids in the field (Sunderland, Reference Sunderland and Holland2002).
Feeding experiments
Feeding experiments were carried out in controlled climate chambers at 12°C, 16°C and 20°C (L:D 16:8). Experiments were conducted separately for the two carabid species but simultaneously at all three temperature levels for each species. Petri dishes, lined with filter paper, were used as feeding arenas. Within each arena, one carabid beetle was allowed to feed for 1 h on five freeze-killed adult aphids. Beetles consuming fewer than three aphids were discarded from the experiment. After the one-hour feeding period, aphid remains were removed and arenas provided with fresh filter paper. Additionally, a piece of damp filter paper was added, serving as a shelter for the beetles. Beetles were frozen at −80°C after digesting their meal for 0, 3, 6, 12, 24, 36, 48 and 72 h from the end of the feeding period. At each time point post-feeding, seven individuals were frozen, except for P. melanarius at 12°C/0 h (n=6) and N. brevicollis at 12°C/72 h (n=6), at 16°C/72 h (n=6) and at 20°C/72 h (n=5). Due to problems with maintaining N. brevicollis at 20°C for extended time periods post feeding (36 h, 48 h and 72 h), an additional set of beetles was used for these three time points where carabids were kept in Petri dishes filled with damp soil.
Sequencing and primer design
For sequencing, DNA of aphids was extracted using a Chelex protocol. Whole aphids where homogenised separately in 20 μl PBS, mixed with 5 μl Proteinase K and 200 μl 10% Chelex solution and incubated at 56°C for 4 h on a rocking platform. After a final incubation at 94°C for 15 min, samples were stored at −24°C. Universal invertebrate primers LCO-1490 and HCO-2198 (Folmer et al., Reference Folmer, Black, Hoeh, Lutz and Vrijenhoek1994) were used to amplify part of the mitochondrial cytochrome oxidase subunit I gene. PCR was carried out in a GeneAmp 9700 thermocycler (Applied Biosystems, Foster City, CA, USA) in 20 μl reaction volumes containing 3 μl of extracted DNA, 0.25 mM dNTPs (Invitrogen GmbH, Karlsruhe, Germany), 1 μM of each primer, 2 μl 10× buffer (Invitrogen), 3 mM MgCl2, and 1.5 U Taq DNA polymerase (Invitrogen). Initial denaturation was done at 94°C for 2 min, followed by 35 cycles at 94°C for 15 s, 50°C for 30 s, 72°C for 45 s, and final elongation at 72°C for 2 min. PCR products were purified using ExoSAP-IT (USB, Staufen, Germany), subjected to sequencing PCR using Big-Dye Terminator mix (version 1.3, Applied Biosystems) and sequenced in both forward and reverse directions. Sequences were aligned using BioEdit (Hall, Reference Hall1999) and corrected manually.
Five forward (S101–S105) and three reverse primers (A101–A103) were designed using PrimerPremier (PREMIERE Biosoft) following the guidelines for primer design given by Hawkins (Reference Hawkins1997). The resulting 15 primer pair combinations were tested for their sensitivity using DNA from S. avenae and for their specificity using DNA from the two carabid species. Optimisation of the PCR protocol included determination of optimum annealing temperatures by temperature gradient PCR, testing different concentrations of primers and adjusting cycling conditions.
Screening predators for prey DNA
The beetles from the feeding trials were thawed, their complete digestive tract removed and homogenised in 50 μl of PCR water (distilled and autoclaved water) using a plastic pistil. For each beetle, separate gloves were used to avoid sample-to-sample contamination. As beetles often regurgitated as a defence reaction when they were transferred from the feeding arenas into the Eppendorf tubes, their gut was homogenized in the same tube the beetle was stored in, avoiding loss of any regurgitated material. Twenty-five microlitres of the homogenate were used for DNA extraction with DNeasy Blood & Tissue Kit (Qiagen GmbH, Hilden, Germany) following the manufacturer's instructions and 200 μl of the DNA extracts were stored at −24°C.
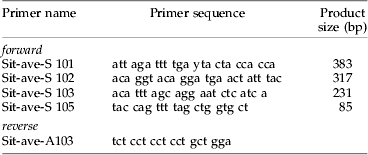
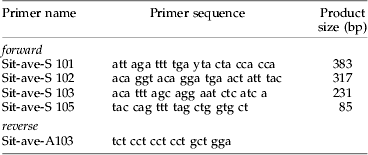
The extracts were analysed for the presence of aphid DNA using four primer pairs (table 1), amplifying fragments from 85 to 383 bp. PCRs were performed in 10 μl reactions containing 3 μl of extracted DNA, 0.25 mM dNTPs (Fermentas GmbH, St. Leon-Rot, Germany), 1 μM of each primer, 1 μl 10×buffer (Invitrogen), 3 mM MgCl2, 0.12 μg bovine serum albumin (BSA) and 1.5 U Taq DNA polymerase (Invitrogen). Amplifications were carried out in an Eppendorf Mastercycler Gradient PCR machine (Eppendorf AG, Hamburg, Germany); cycling conditions were 2 min at 94°C, 40 cycles of 15 s at 94°C, 30 s at 61°C, 45 s at 72°C, and final elongation of 2 min at 72°C. PCR water, as well as aphid and carabid DNA, were included within each PCR to test for DNA carry-over contamination, false-negative and false-positive amplifications. PCR products were visualised on a multi-channel capillary gel electrophoresis system HDA-GT12 (eGene, Inc., Irvine, CA, USA).
Table 1. Primers (5′–3′) designed from the cytochrome oxidase subunit I mtDNA of Sitobion avenae and expected product sizes of each forward primer combined with the reverse primer Sit-ave-A103.
Statistical analysis
Chi-square tests were performed to test for differences in detection rates for aphid DNA within each of the three temperature levels and each of the four fragment lengths between the two carabid species. To investigate the effects of temperature, fragment length and digestion time on detectability of aphid DNA within both predator species, a three-variable logistic regression was performed including prey DNA detectability (yes/no) as the dependent variable and temperature (12, 16 and 20°C), fragment length (85, 231, 317 and 383 bp) and time since feeding (0, 3, 6, 12, 24, 36, 48 and 72 h) as the independent variables. A logistic regression model was chosen because of the dichotomous and nominal character of the response variable. As the design is experimental and the independent variables are not correlated, we were testing all variables simultaneously instead of using variable selection methods (Cody & Smith, Reference Cody and Smith2006). In case of significant effects of independent variables, single logistic regressions were calculated comparing two factor levels at a time in all possible combinations within the variable, equivalent to performing protected ANOVAs following a significant MANOVA (Scheiner & Gurevitch, Reference Scheiner and Gurevitch2001). Logistic regressions and Chi-square tests were calculated using SAS 9.1 (SAS Institute Inc., Cary, NC, USA) and Statistica 7.1 (StatSoft, Tulsa, OK, USA), respectively. For the N. brevicollis feeding experiment at 20°C, all statistics were calculated without data from digestion times of 36, 48 and 72 h because too few beetles survived under these conditions. Instead of calculating the detectability half-life as described by Greenstone & Hunt (Reference Greenstone and Hunt1993), using an exponential model, the real time points, as defined by the experimental design, were determined where more than 50% of the beetles tested positive for aphid DNA.
Results
The four primer pairs S101/A103, S102/A103, S103/A103 and S105/A103 successfully amplified DNA fragments of S. avenae of 85, 231, 317 and 383 bp, respectively. The optimal annealing temperature identified by temperature gradient PCR was 61°C for all four primer pairs. All amplifications were optimised to run at the same cycle conditions and PCR reagent concentrations. The PCR assay proved to be (for our purposes) specific for S. avenae DNA, as no amplicons were obtained with DNA of the two carabid species.
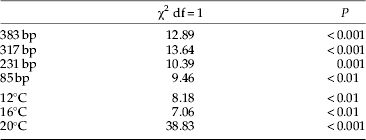
Detectability rates of aphid DNA in the predators' gut contents differed significantly between P. melanarius and N. brevicollis, with overall detection rates being significantly higher (χ2=41.63; P<0.001) in N. brevicollis (61%; n=145) than in P. melanarius (42%; n=146). These higher detection rates in N. brevicollis were significant within each of the three temperature levels and each of the four fragment lengths (table 2).
Table 2. Results of cross-tabulation tables testing for differences in DNA detectability of aphid prey between Pterostichus melanarius and Nebria brevicollis with respect to fragment length and temperature.
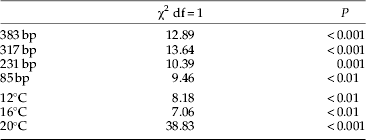
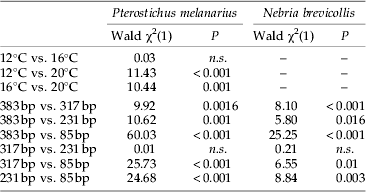
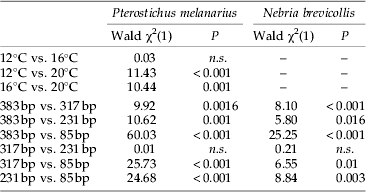
Detectability of aphid DNA in P. melanarius significantly decreased with increasing digestion time, temperature and fragment length (table 3). Mean detection rates were similar at 12°C (44%) and at 16°C (43%) but were significantly lower at 20°C (29%) (table 4). These lower detection rates were due to a rapid decline in detectability of aphid DNA within digestion times 0–12 h at 20°C compared to a moderate decline in detectability in beetles maintained at 12°C and 16°C (fig. 1a).

Fig. 1. Mean aphid prey DNA detection rates (%) in the gut of (a) Pterostichus melanarius and (b) Nebria brevicollis up to 72 h post-feeding of beetles kept at 12°C (–●–), 16°C (...○...) and 20°C (–▼–).
Table 3. Summary of logistic regression analysis for the effect of temperature, fragment length and time on aphid DNA detectability in the guts of Pterostichus melanarius (n=668) and Nebria brevicollis (n=420).

n.s., not significant.
Table 4. Results of single logistic regressions for the effect of each factor level combination of the factors temperature and fragment length on aphid DNA detectability in the guts of Pterostichus melanarius and Nebria brevicollis.
n.s., not significant.
In N. brevicollis prey DNA, detection rates significantly decreased with increasing fragment length and digestion time. Detection rates differed significantly between the three temperature levels depending on digestion time. Detectability of aphid DNA decreased markedly between 6 h and 12 h and between 12 h and 24 h at 20°C and 16°C, respectively, compared to a more constant detectability of aphid DNA up to 24 h in beetles maintained at 12°C (fig. 1b).
A clear effect of fragment length on prey detection in P. melanarius was observed: for the three larger fragments (231, 317, 383 bp) amplification success decreased below 50% between 0 h and 24 h post feeding at all temperature levels (fig. 2a). In contrast, the shortest fragment (85 bp) was detectable in over 50% of the beetles up to 24, 36 and 72 h at 20, 16 and 12°C, respectively. Prey DNA detection rates differed significantly among the different-sized amplicons except for the 231 bp and 317 bp fragments (table 4).

Fig. 2. Maximum time since feeding with more than 50% positive tested beetles for the four different sized amplicons (85, 231, 317 and 383 bp) of aphid DNA at 12°C (–●–), 16°C (...○...) and 20°C (–▼–) in (a) Pterostichus melanarius and (b) Nebria brevicollis. *Data for the detection times of aphid DNA in Nebria brevicollis at 20°C is only available up to 24 h.
In N. brevicollis, the effect of fragment length on prey detection was more distinctive between temperatures than in P. melanarius. The two larger fragments (317 and 383 bp) were successfully detectable in more than 50% of the beetles up to between 6 h and 24 h digestion time at all temperatures (fig. 2b). For the second shortest fragment (231 bp), 50% amplification success was similar at 16°C and 20°C (12 h), whereas even at 48 h post feeding more than 50% of the beetles tested positive at 12°C. For the shortest fragment (85 bp), more than 50% of the beetles still tested positive after 72 h at 12°C and 16°C and up to 24 h at 20°C. As in P. melanarius, detection rates among the different-sized amplicons in N. brevicollis differed significantly, except for the 231 bp and 317 bp fragments (table 4).
Discussion
Within the present study, we found that aphid prey DNA detection rates differed significantly in two carabid species, with a higher detectability in N. brevicollis compared to P. melanarius. It has been shown in previous studies that detection rates of prey protein (Sunderland et al., Reference Sunderland, Crook, Stacey and Fuller1987; Symondson & Liddell, Reference Symondson and Liddell1993; Hagler & Naranjo, Reference Hagler and Naranjo1997) and prey DNA (Chen et al., Reference Chen, Giles, Payton and Greenstone2000; Hoogendoorn & Heimpel, Reference Hoogendoorn and Heimpel2001; Ma et al., Reference Ma, Li, Keller, Schmidt and Feng2005; Read et al., Reference Read, Sheppard, Bruford, Glen and Symondson2006; Greenstone et al., Reference Greenstone, Rowley, Weber, Payton and Hawthorne2007; Traugott & Symondson, Reference Traugott and Symondson2008) can differ considerably in different predator species. Results from enzyme-linked immunosorbent assay (ELISA) suggest that staphylinids digest prey proteins faster than carabids and spiders (Sunderland et al., Reference Sunderland, Crook, Stacey and Fuller1987). The spiders' prolonged detection times for prey protein and prey DNA (Harwood et al., Reference Harwood, Sunderland and Symondson2004; Sheppard et al., Reference Sheppard, Bell, Sunderland, Fenlon, Skervin and Symondson2005; Traugott & Symondson, Reference Traugott and Symondson2008) are possibly due to their ability to vary their metabolic rates in response to starvation (Anderson, Reference Anderson1970) and/or to their use of gut diverticula to store partially digested food (Nakamura & Nakamura, Reference Nakamura and Nakamura1977). The longer detection times in carabids, compared with staphylinids, may possibly result from the intake of solid prey remains together with fluids, whereas rove beetles are mainly fluid feeders (Sunderland & Vickerman, Reference Sunderland and Vickerman1980; Lovei & Sunderland, Reference Lovei and Sunderland1996). Note that fluid-feeding carabid larvae were found to have extended prey DNA detection times as well, which, however, were significantly influenced by prey species (Juen & Traugott, Reference Juen and Traugott2005, Reference Juen and Traugott2006, Reference Juen and Traugott2007). Comparing detectability of potato beetle DNA in pentatomid nymphs and ladybird larvae, Greenstone et al. (Reference Greenstone, Rowley, Weber, Payton and Hawthorne2007) found significantly higher mean prey DNA detection times in the former, which has been ascribed to the bug's spider-like hunting style and feeding mode. In contrast to these studies, we, here, compared detection rates of the same prey species in taxonomically-related predators. Hoogendorn & Heimpel (Reference Hoogendoorn, Heimpel and van Driesche2002) compared, in a similar experiment, prey DNA detection rates between two coccinellid species, Coleomegilla maculata De Geer and Harmonia axyridis (Pallas), both of which are within the Cocciellini. Having fed both predators on eggs of Ostrinia nubilalis (Hübner) (Lepidoptera: Crambidae) and allowed them to digest their prey from between 0 and 8 h, no significant differences in prey DNA detection rates were found. On the other hand, in a similar study using antibodies to measure digestion of prey proteins in two related species of carabid, large differences were found in digestion rates between the smaller Pterostichus madidus and the larger Abax parallelepipedus (Symondson & Liddell, Reference Symondson and Liddell1993). Pterostichus melanarius and N. brevicollis, belonging to the carabid tribes Pterostichini and Nebriini, respectively, are both night-active autumn breeders, which hunt on the soil surface and have a similar feeding mode (Williams, Reference Williams1959; Greenslade, Reference Greenslade1963; Chapman et al., Reference Chapman, Armstrong and McKinlay1999). Despite these similarities, considerable differences in prey DNA detection rates were found between these two species. Interestingly, these differences were not altered by ambient temperature or prey amplicon length, indicating a fundamental dissimilarity in prey digestion capacities. These findings underscore the need to assess prey DNA detectability not only for predator taxa showing different feeding modes (Chen et al., Reference Chen, Giles, Payton and Greenstone2000; Greenstone et al., Reference Greenstone, Rowley, Weber, Payton and Hawthorne2007; Traugott & Symondson, Reference Traugott and Symondson2008) but also for closely related species sharing the same feeding mode to allow correct interpretation of field-derived data. Perhaps, closely-related species within the same taxonomical tribe (Hoogendorn & Heimpel, Reference Hoogendoorn, Heimpel and van Driesche2002) are more similar in their prey DNA digestion than species belonging to different tribes, such as the carabids investigated here, a hypothesis which needs to be tested in future studies.
The present experiment showed that DNA detection success in N. brevicollis prey was negatively correlated with increasing ambient temperature, whereas in P. melanarius prey detection rates were significantly reduced only at 20°C, compared to rates at 12° and 16°C. This suggests a non-linear relationship between DNA digestion rates and ambient temperature for this predator-prey system. Similar results were found by Read (Reference Read2007), who found that only at a temperature of 24°C were detection rates of nematode prey DNA in the guts of the collembolan Folsomia candida affected, whereas no significant differences in mean detection times occurred between ambient temperatures ranging from 4°C to 20°C. Significantly higher detectability rates of DNA from lepidopteran eggs in the ladybird Coleomegilla maculata (DeGeer) were observed at 20°C compared to 27°C (Hoogendoorn & Heimpel, Reference Hoogendoorn and Heimpel2001). These results indicate that the effects of temperature on prey digestion depend on the specific predator-prey system investigated and the environmental conditions within which these trophic interactions happen. Perhaps temperature effects can be neglected in systems where temperatures fluctuate only within a small range, e.g. in soil-dwelling predators (Juen & Traugott, Reference Juen and Traugott2007) or epigeic predators hunting under a dense plant canopy. In contrast, effects of ambient temperature on prey DNA digestion rates need to be considered in predators which are exposed to considerable temperature fluctuations. Clearly, further experimental work is needed on this topic to allow better interpretation of field-derived data on prey DNA detection rates.
Within the present study, we found that, in most cases, prey detection rates were positively correlated with decreasing prey DNA fragment length. Several studies have shown that this relationship holds true also in other predator-prey systems, with short amplicons allowing detection of prey DNA for longer periods post feeding (Agustí et al., Reference Agustí, De Vicente and Gabarra1999; Zaidi et al., Reference Zaidi, Jaal, Hawkes, Hemingway and Symondson1999; Hoogendoorn & Heimpel, Reference Hoogendoorn and Heimpel2001). However, we also found, within the present experiments, that prey DNA detection rates were not significantly different between the 231 bp and the 317 bp fragment. Similarly, Chen et al. (Reference Chen, Giles, Payton and Greenstone2000) found no differences in detectability half lives for fragments of 246 bp and shorter. No differences in detection rates of DNA fragments between 127 and 585 bp were found within 24 h post-feeding intervals, when scarabaeid larvae were fed to carabid larvae (Juen & Traugott, Reference Juen and Traugott2005, Reference Juen and Traugott2006, Reference Juen and Traugott2007). These results indicate that the efficiency of PCR to amplify semi-digested prey DNA fragments is, besides amplicon length, also determined by factors such as the quality of the template DNA extract, PCR reagents, cycle conditions and the efficiency of the primers (King et al., Reference King, Read, Traugott and Symondson2008). In our study, the impact of those effects was diminished by optimising all primers to amplify at the same PCR cycle conditions, using the same PCR reagent concentrations and by combining all forward primers with the same reverse primer. Therefore, differences in detection rates can be mainly ascribed to the factors investigated, strengthening the significance of our results.
By using a set of fragments that can be detected for different lengths of time, Hoogendoorn & Heimpel (Reference Hoogendoorn and Heimpel2001) aimed to estimate the time since feeding in a ladybird beetle-lepidopteran egg predator-prey system. The authors suggested that sequences increasing in length can be used to estimate a minimum and a maximum time since the predators consumed prey. This approach, however, demands a clear relationship between fragment length and amplification success at post-feeding intervals. Considering the results of the present study and of those discussed above, a set of primers amplifying fragments of considerably different amplicon size should be used to estimate the time point since feeding. Given all the confounding factors, the precision of such a system, based principally upon multiple amplicons of different sizes, is likely to be somewhat restricted. Nevertheless, ecologically relevant questions could be answered, for example differentiation between night and diurnal predator activity or temporal niche differentiation of predators.
Acknowleledgements
The authors thank Mr Robert Reader, Burdens Farm, Wenvoe, Cardiff, who allowed pitfall sampling on his fields. We also thank George Heimpel and one anonymous referee for helpful comments on a former draft of the manuscript. This work was funded by the German Research Foundation DFG Grant SCHE 376/14.


