


Introduction
Landscape fragmentation refers to the separation and division of a large and continuous landscape into smaller, isolated landscape fragments (Ranta et al., Reference Ranta, Blom, Niemela, Joensuu and Siitonen1998; Franklin et al., Reference Franklin, Noon, George, George and Dobkin2002), which can be induced by human (Fahrig, Reference Fahrig2003) or non-human factors (Bukey, Reference Bukey1995; Fagan, Reference Fagan2002; Leisnham & Jamieson, Reference Leisnham and Jamieson2002; Watson, Reference Watson2002). The negative effects of this process are decreases in overall habitat availability and quality and changes in the spatial configuration of habitats (Fahrig, Reference Fahrig2003; Henle et al., Reference Henle, Lindenmayer, Margules, Saunders and Wissel2004). Both theoretical and empirical studies show that habitat fragmentation can erode neutral and adaptive genetic diversity of populations because of decreases in effective population size and inter-population connectivity (Johansson et al., Reference Johansson, Primmer and Merilä2004; Marianna et al., Reference Marianna, Jeanpaul, Joãos and Kellyr2009; Wang et al., Reference Wang, Compton and Chen2011; Bao, Reference Bao2013; Goossens et al., Reference Goossens, Sharma, Othman, Kun-Rodrigues, Sakong, Ancrenaz, Ambu Laurentius, Jue Nathaniel, O'Neill, Bruford and Chikhi2016). Genetic diversity is required for evolution to occur, indicated by the expected relationship between heterozygosity and population fitness (Reed & Frankham, Reference Reed and Frankham2003). Therefore, landscape fragmentation threatens local, regional, national and ultimately global biodiversity (Tilman et al., Reference Tilman, May, Lehman and Nowak1994; Dobson et al., Reference Dobson, Bradshaw and Baker1997), and as a consequence, habitat fragmentation has become a central concern in biological conservation.
Thousand Island Lake (hereafter TIL) is an artificial lake created by the construction of the Xin-An Jiang dam in 1958 and is located in the west of Hangzhou, Zhejiang, China. TIL, as an anthropogenic fragmented island landscape, is an ideal model to investigate ecological effects of fragmentation because of the well-delineated boundaries, inhospitable surrounding matrix, relatively homogeneous habitats and consistent isolation time for different island habitats (Yu & Mcgeoch, Reference Yu and Mcgeoch2012; Bao, Reference Bao2013; Jia et al., Reference Jia, He, Weiser, Yin, Akbar, Kong, Tian, Jia, Lin, Yu and Tian2016).
Many studies indicate that reductions in habitat area lead to reductions in population size and colonization rates, which increase the risk of species extinction (Bowers & Matter, Reference Bowers and Matter1997; Bender et al., Reference Bender, Contreras and Fahrig1998; Hanski, Reference Hanski1998; Crooks et al., Reference Crooks, Suarez, Bolger and Soulé2001; Hames et al., Reference Hames, Rosenburg, Lowe and Dhondt2001; Schoereder et al., Reference Schoereder, Sorbrino, Ribas and Campos2004). Many studies also demonstrate that complex fragments have more frequent colonization than simple patches (Game, Reference Game1980; Collinge, Reference Collinge1996; Hamazaki, Reference Hamazaki1996; Bevers & Flather, Reference Bevers and Flather1999; Collinge & Palmer, Reference Collinge and Palmer2002; Cumming, Reference Cumming2002). Additionally, genetic differentiation among invertebrate populations is clearly related to fragment isolation in many studies (Van Dongen et al., Reference Van Dongen, Backeljau, Matthysen and Dhondt1998; Schmitt & Seitz, Reference Schmitt and Seitz2002; Krauss et al., Reference Krauss, Schmitt, Seitz, Steffan-Dewenter and Tscharntke2004), although not in all (Ramirez & Haakonsen, Reference Ramirez and Haakonsen1999; Wood & Pullin, Reference Wood and Pullin2002; Marianna et al., Reference Marianna, Jeanpaul, Joãos and Kellyr2009; Bao, Reference Bao2013). In this study, we focus on Dendrolimus punctatus (Lepidoptera: Lasiocampidae), which is a moth that feeds on pine trees, and is a common invertebrate species in the local community. Because the species has approximately 2–3 generations per year (Fei et al., Reference Fei, Wang, Kong, Zhang, Zhang and Song2014), approximately 170 generations had passed for the D. punctatus populations since potential isolation. Consequently, we suspect that the accumulation of genetic variation could be substantial and can allow for the testing of the following hypotheses: (1) habitat fragmentation will affect the genetic diversity and genetic differentiation among different populations of D. punctatus in TIL; (2) smaller island area and oversimplified island shape will decrease the genetic diversity of D. punctatus populations in TIL.
Materials and methods
Study area and population sampling
Our study was conducted on TIL (29°22″–29°50″N, 118°34″–119°15″E), where we selected 23 islands (fig. 1) that were completely isolated by water. These islands were selected because they (1) represented a range of areas and degree of isolation, (2) had as little human disturbance as possible and (3) contained populations of D. punctatus. Attributes of the selected islands, including island area (at 105 m a.s.l.), isolation (distance to nearest island) and island shape index (SI) measured by GIS, are listed in table 1. Island SI is a measure of island shape complexity, which was calculated as: SI = P/[2 × (π × A)0.5] (Laurance & Yensen, Reference Laurance and Yensen1991; Hoffmeister et al., Reference Hoffmeister, Lem, Biere, Holsinger and Filser2005; Ewers & Didham, Reference Ewers and Didham2007), where P is the island perimeter and A is the island area. The SI measures deviations from circularity, with a circle having an SI value of 1 and increasingly more complex shapes having greater SI values.

Fig. 1. Map showing geographical locations of the 23 islands sampled in TIL. Numbers refer to island IDs in table 1 and are used throughout the study.
Table 1. Parameters of the 23 islands sampled in this study.

From each island, the individuals collected included larvae and adults of D. punctatus, and any pupae collected were maintained to obtain adults. Sampling sites were randomly distributed on an island, and we avoided sampling in the same or nearby sites. The specimens were stored individually in absolute ethanol.
DNA extraction, amplification and sequencing
We dissected each individual to remove the epidermis and internal contents and used the muscular tissue for the experiment. We isolated genomic DNA from muscular tissue using a Multisource Genomic DNA Miniprep Kit (Axygen Scientific, Inc., New York. USA). We amplified fragments of the mitochondrial DNA cytochrome c oxidase subunit I gene (mtDNA COI) using primers (SMCF2: 5′-CACAAAAGATATTGGAACAT-3′ and SMCR1: 5′-GTGTTTAAATTTCGATCAGT–3′). The length of the region amplified by these primers was approximately 600 bp. The authors designed the above primers in-house, because we failed to achieve amplification when using the universal primers of Lepidoptera. Polymerase chain reactions (PCRs) consisted of an initial denaturation step of 94°C for 3 min, followed by 34 cycles of denaturation at 94°C for 45 s, annealing at 44.7°C for 50 s and extension at 72°C for 50 s, followed by a final extension at 72°C for 5 min. PCR was conducted in a solution with a final volume of 50 µl, which contained 5 µl of 10× Taq buffer, 2 U of Taq polymerase, 0.5 mM each dNTP, 25 mmol primers and 2.5 µl of DNA template. Amplified fragments were electrophoresed and purified with gel extraction and then sequenced by Genscript (Genscript, Nan Jing, China).
Each D. punctatus sample was sequenced bi-directionally and assembled using the software ContigExpress. We used BLAST to align the obtained sequences with homologous sequences from GenBank to ensure amplification of the target sequences. We translated subject sequences using invertebrate mitochondrial codons to ensure that amplified fragments represented authentic mtDNA rather than numts. Sequences were aligned using the Clustal X 1.83 program (Chenna et al., Reference Chenna, Sugawara, Koike, Lopez, Gibson, Higgins and Thompson2003) and manually adjusted.
Statistical analyses
We used DnaSP 5.0 (Rozas et al., Reference Rozas, Sánchez-Delbarrio, Messeguer and Rozas2003) to calculate three population indices of genetic diversity: number of haplotypes (h), nucleotide diversity (π) and haplotype diversity. We used an ordinary least square regression to test for possible biases in the number of haplotypes at each island due to uneven sample sizes. Because we found no significant association between sample size and haplotype diversity, we used uncorrected haplotype numbers in all subsequent statistical analyses. We also report the number of haplotypes adjusted for sample size (h/N) for comparison. We used Arlequin 3.5 (Excoffier & Lischer, Reference Excoffier and Lischer2010) to calculate pairwise F-statistic (Fst) values as the measure of genetic differentiation between two different populations, with the significance tested using 10,000 permutations. Analysis of molecular variance (AMOVA) was also performed using Arlequin 3.5 (Du et al., Reference Du, Tang, Wang, Shen and Chang2014).
To test island fragmentation for possible genetic effects, we used ordinary least square regression between the three island attributes, the logarithm of island area, isolation distance, and island SI, and the two indices of population genetic diversity, the number of haplotypes and haplotype diversity. We tested for a pattern of isolation by distance (IBD) across all islands by correlating a matrix of pairwise genetic distances (Fst) between all islands with geographic distances using a Mantel matrix correspondence test. We used spatial AMOVA implemented in the program SAMOVA v. 1.0 (Dupanloup et al., Reference Dupanloup, Schneider and Excoffier2002) to define partitions of local populations that were maximally differentiated from one another based on our sequence data. The method is based on a simulated annealing procedure that maximizes the proportion of genetic variance that can be explained by differences between groups of populations. Our analyses were based on 100 simulated annealing steps and prior definition of the number of groups, K, ranging from 2 to 5. Strictly following the analysis assumptions, groups of only one population sample should have no genetic structure (Dupanloup et al., Reference Dupanloup, Schneider and Excoffier2002). For each analysis with increasing K, we examined the proportion of genetic variance due to differences between groups, Fct, and searched the range of K for which Fct was the largest and statistically significant. We constructed phylogenetic trees with 1000 bootstrap replications using MEGA 6.0 (Tamura et al., Reference Tamura, Peterson, Peterson, Stecher, Nei and Kumar2011).
For direct observation of the genetic connection among main haplotypes, we created a median-joining network (fig. 2) for 37 main haplotypes (these 37 haplotypes were detected in at least two individuals, and the other 104 haplotypes were detected in just one individual) using software Network 4.6 (Bandelt et al., Reference Bandelt, Forster and Röhl1999).
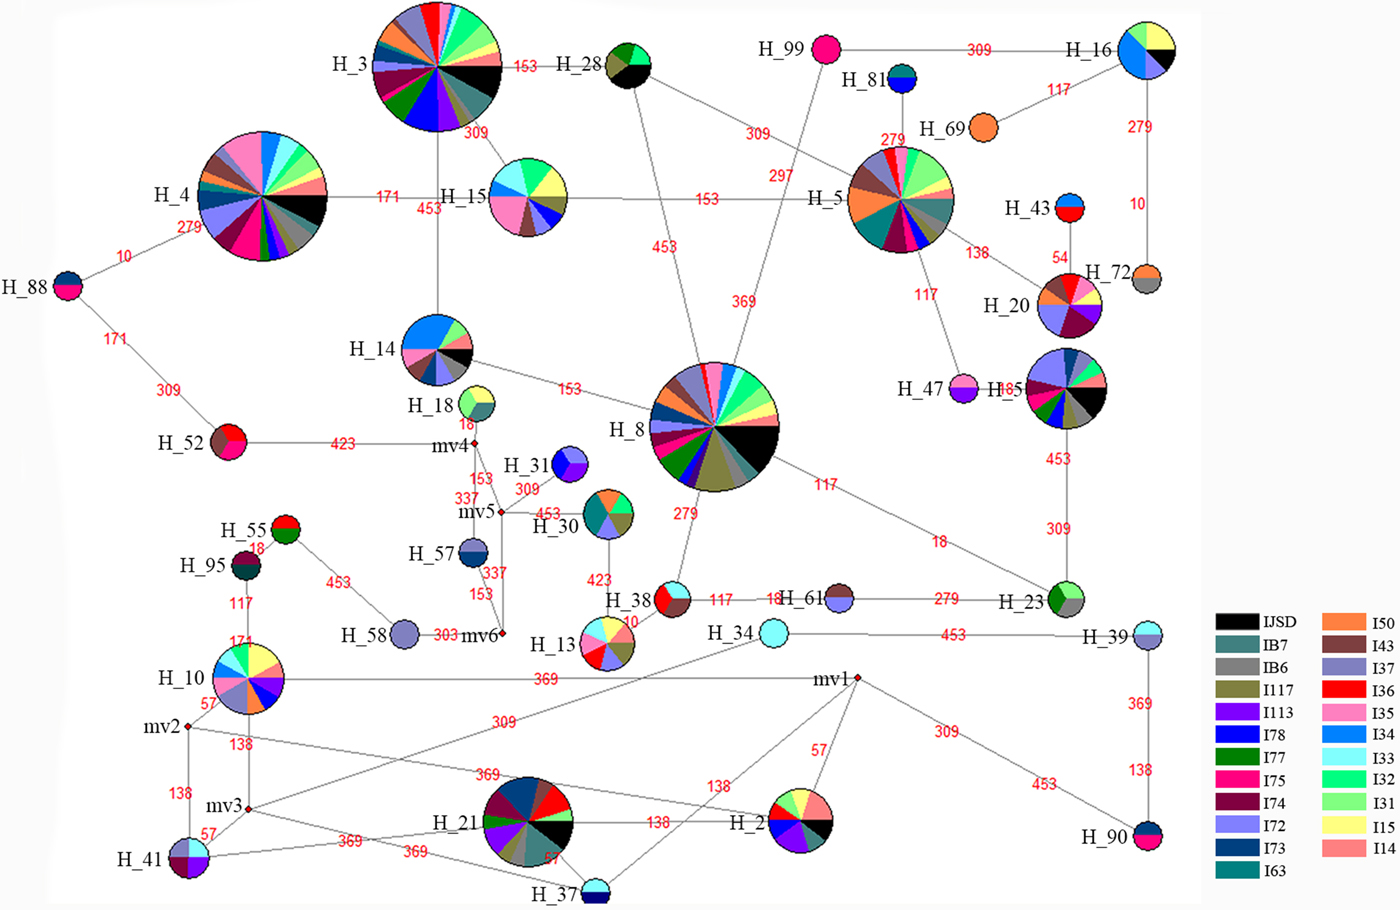
Fig. 2. Median-joining network of 37 main haplotypes based on analysis of Dendrolimus punctatus COI sequences. Each circle represents one haplotype and the circle size indicates haplotype frequency. Each circle is coloured based on the number of individuals from each island.
Results
Population genetic diversity
We obtained 502 sequences for a 500 bp fragment of COI. These sequences included 37 variable sites of which 13 were singleton variable sites and 24 parsimony informative sites. All variable sites were transitional, with no insertions or deletions.
One hundred and forty-one distinct haplotypes were identified, which occurred in 28.09% of the total samples. One hundred haplotypes were unique to single populations and others were shared by at least two populations. The number of haplotypes (h) per population (adjusted for sample size) varied from 0.48 on island 37 (I37) to 0.86 on island B6 (IB6). The absolute number of haplotypes per population varied from 11 on islands 34, 37, 75 and B7 to 19 on islands B6 and JSD (table 2). Haplotype 3 was observed in all 23 populations at a rate between 5% (I33, I34, I43, IB6) and 32% (I78), and haplotype 8 was observed in 22 populations, with I63 the exception. Haplotype diversity (Hd) varied from 0.85375 on I117 to 0.98268 on IB6, with the global Hd 0.935 (±0.006). Nucleotide diversity by site (π) varied from 0.00659 on I35 to 0.01353 on I113.
Table 2. Genetic index of the 23 populations of D endrolimus punctatus.

Pairwise Fst values (a measure of connectivity between pairs of sites) ranged from 0.00004 to 0.22997 (generally, Fst is a value ranged from 0 to 1; therefore, we used the absolute value of the value of the software calculation). The highest value was between I33 and I35; whereas the lowest value was between I50 and I73. Although most pairwise comparisons indicated relatively low differentiation among populations, 37 of the pairwise comparisons (6.99%) were significantly different from zero (bold in table 3). Most of the significant Fst comparisons occurred between I33 and other populations. Twelve of the significant comparisons occurred between I33 and other populations, whereas nine occurred between I63 and other populations and between I113 and other populations (table 3).
Table 3. Pairwise Fst estimates among all populations of Dendrolimus punctatus included in this study (lower matrix).

Significant pairwise comparisons (P < 0.05) are indicated in bold. Pairwise geographical distances among sampling sites are in the upper matrix (km). Locality names are the same as those in fig. 1.
The analysis of variance and the correlation analysis for the effect of island area, shape and isolation showed no significant differences for haplotype diversity (Hd), despite a negative trend for low Hd in the large and more complex fragments. The number of haplotypes (h) was significantly and positively correlated with the logarithm of island area and island SI. By contrast, the number of haplotypes (h) did not vary significantly with isolation. However, when the island JSD was not included in the analysis, no significant correlation occurred between island area and haplotypes or between island shape and haplotypes.
Spatial analyses
We found no evidence of IBD in the Mantel test that included all samples (fig. 3). The SAMOVA identified maximally differentiated groups in our sample. The interaction between Fct and Fst was expected and is one of the difficulties of using Fct to define the ‘real’ number of differentiated groups. The Fct estimated at high values of K remained significant but increased incrementally as differentiation within each group decreased (Dupanloup et al., Reference Dupanloup, Schneider and Excoffier2002). Therefore, we compared the inferred population structure in the range of K that showed the highest significant values for Fct (table 4). Our results showed a hierarchical grouping arrangement as K increased from 2 to 5 (table 4). Results of SAMOVA showed that, with the increase of K, the population samples that formed independent groups were the populations most distant from the central IJSD (largest sample island) and nearest to the mainland in a different direction. Additionally, AMOVA showed that a relatively high proportion (89.1%) of the total genetic variance was attributable to variation within populations (table 5).

Fig. 3. Scatter plot of pairwise genetic distance vs. geographical distance for all 23 islands included in this study.
Table 4. Results of fixation indices corresponding to the groups of populations inferred by SAMOVA for the 23 D endrolimus punctatus populations tested for variation in the mtDNA cytochrome c oxidase subunit I gene.

Table 5. Analysis of molecular variance (AMOVA) for the 23 populations of D endrolimus punctatus.

We constructed a minimum-evolution tree (Fig. 4) and a neighbour-joining tree (Fig. 5), with Dendrolimus kikuchii (Lepidoptera: Lasiocampidae) as the out-group, to explore the relationship between the distribution of haplotypes and geographic location. Haplotypes that were on adjacent islands, even the same island, were assigned to two groups, such as Hap14 (appeared on I43, I34 and I35) and Hap65 (appeared on I43), whereas those haplotypes that distributed most distant were similar in phylogenetic trees, such as Hap112 (appeared on I78) and Hap4 (appeared on IB6 and IB7). The median-joining network analysis (fig. 5) also indicated the similar result, Hap8 played a crucial role in connecting other haplotypes and each haplotype connected by the other haplotype, the results indicated genetic connection among main haplotypes, whereas no geographic distribution structure among different haplotypes.

Fig. 4. Molecular phylogenetic trees of Dendrolimus punctatus using Minimum-Evolution (ME) based on COI gene sequence data.

Fig. 5. Molecular phylogenetic trees of Dendrolimus punctatus using neighbour-joining (NJ) based on COI gene sequence data.
Discussion
We found a significant decrease in the number of haplotypes on small islands with less area (fig. 6), which indicated that small island area had a potential negative effect on genetic diversity of these island populations. Fewer haplotypes were maintained on the small islands likely because of genetic drift or random loss of haplotypes on small fragments with reduced effective population size and colonization rate. We also found a significant increase in the number of haplotypes on islands with a high SI, indicating that islands with a more complex shape supported higher genetic diversity. However, the significant correlations described above were no longer significant when island JSD was not included (fig. 7).
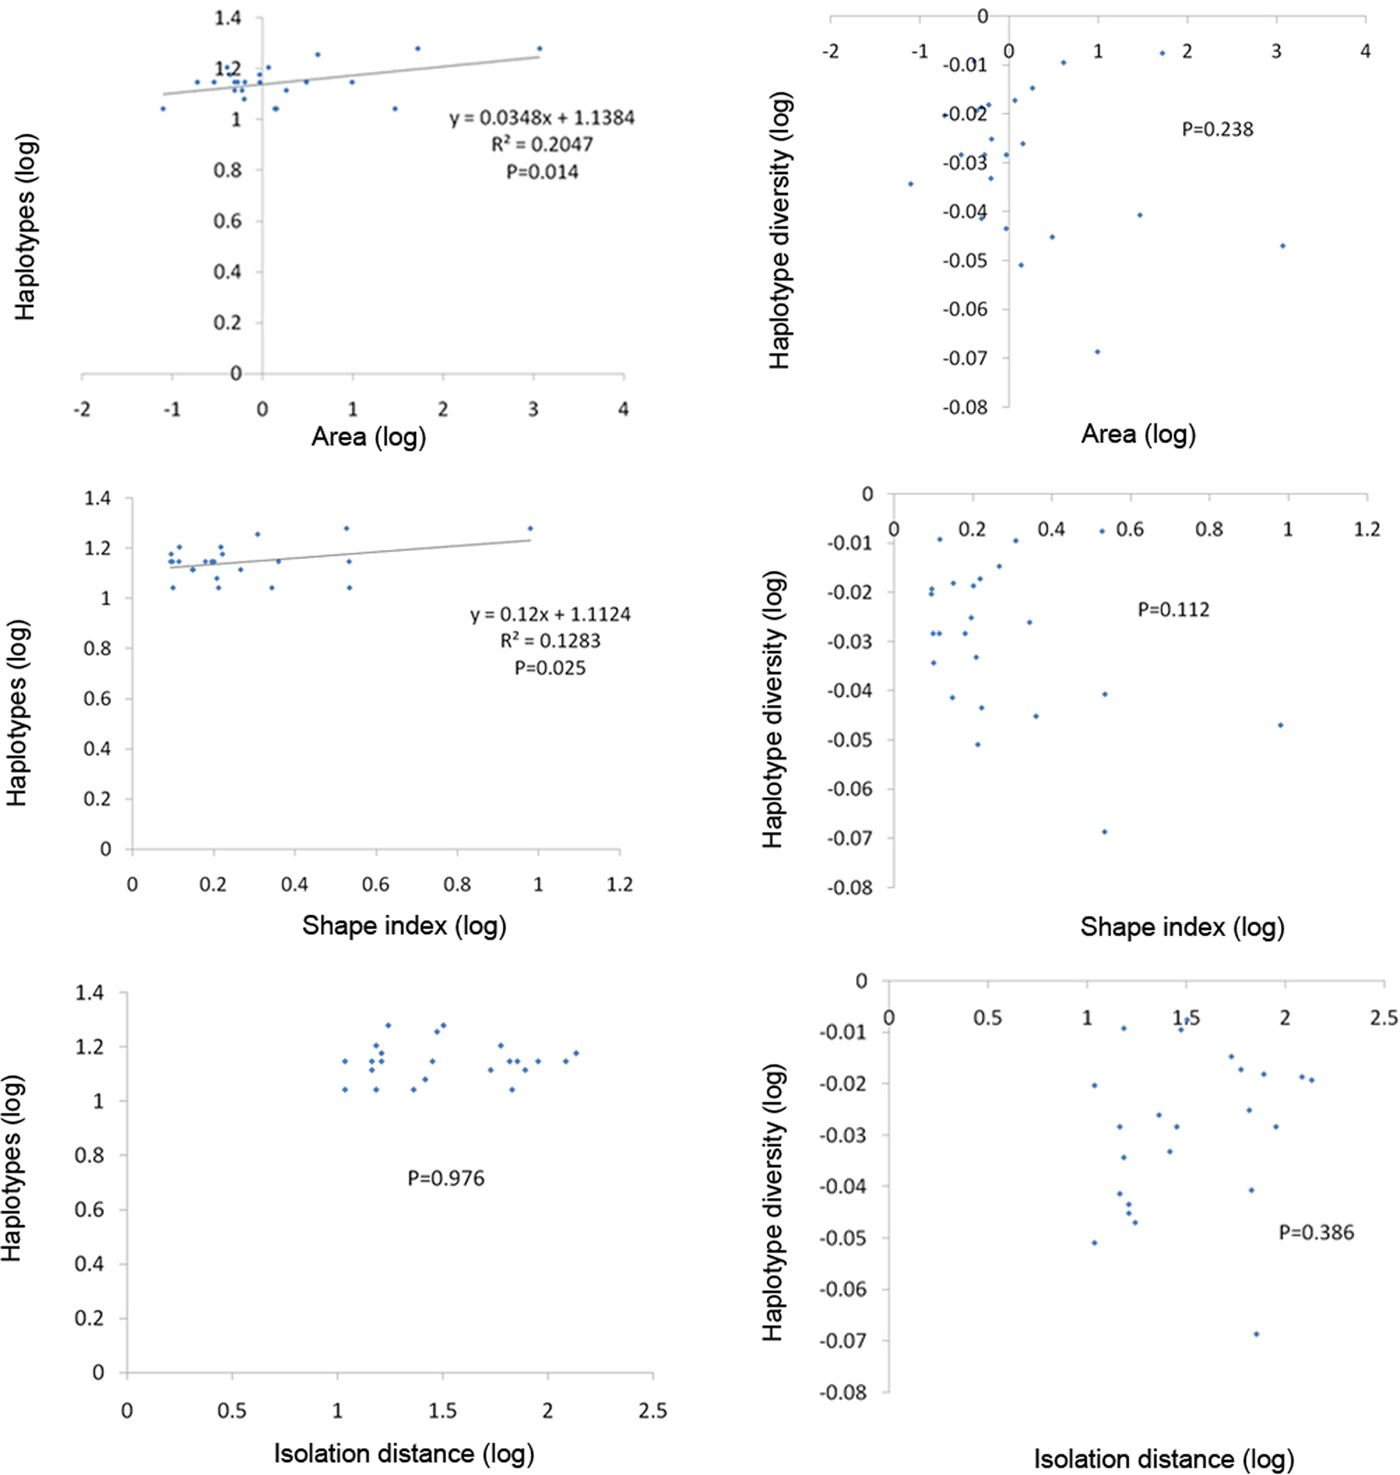
Fig. 6. Variation in the number of haplotypes and haplotype diversity estimated from mtDNA cytochrome c oxidase subunit I gene sequences of Dendrolimus punctatus in relation to the area, shape index, and isolation of the islands (with island JSD).
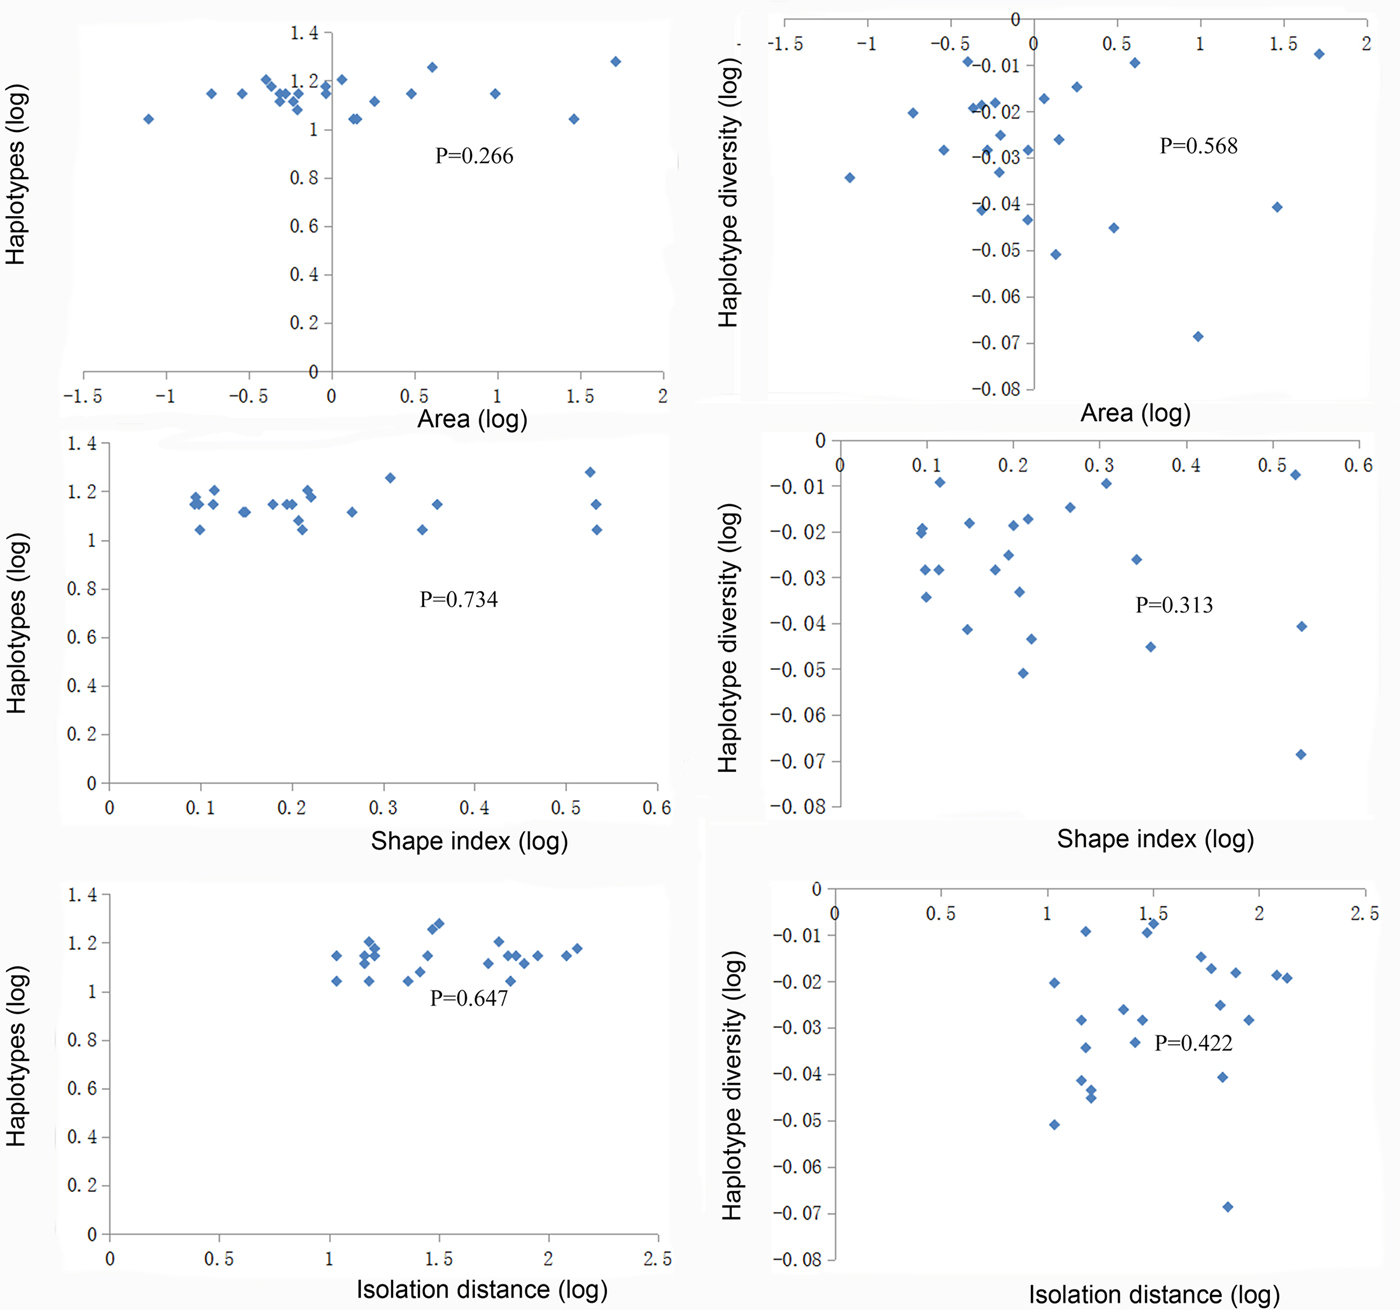
Fig. 7. Variation in the number of haplotypes and haplotype diversity estimated from mtDNA cytochrome c oxidase subunit I gene sequences of Dendrolimus punctatus in relation to the area, shape index, and isolation of the islands (without island JSD).
In addition to the effects of habitat area and shape, the genetic diversity of a species is also affected by species-typical characteristics, such as habitat specialization, vagility and ecological tolerance, which influence the susceptibility of individual species to habitat fragmentation (Sumner et al., Reference Sumner, Jessop, Paetkau and Moritz2004; Peakall & Lindenmayer, Reference Peakall and Lindenmayer2006; Louy et al., Reference Louy, Habel, Schmitt, Assmann, Meyer and Müller2007). Species with high dispersal ability and with a high number of habitat patches have a better chance of maintaining gene flow and panmixia; and low dispersal capacity and high number of accessible fragments result in a pattern of IBD. However, low dispersal capacity and low habitat availability result in a species becoming isolated, and with gene flow absent, drift is aggravated independently in each population (Louy et al., Reference Louy, Habel, Schmitt, Assmann, Meyer and Müller2007; Marianna et al., Reference Marianna, Jeanpaul, Joãos and Kellyr2009). The value of Fst in our study also confirmed a certain degree of gene flow between each island population (table 3). Additionally, we found no significant correlation between genetic distance and geographic distance (fig. 3), which is consistent with the high dispersal capacity of D. punctatus, allowing the moths to cross over the isolation of water among islands. This result suggested that the dispersal capacity of the species could weaken or counteract the isolation effect of fragmentation by removing the genetic barriers, which would then prevent regional-scale spatial genetic structure (Wang et al., Reference Wang, Compton, Shi and Chen2012).
Another factor affecting pine moth migration and spread is the distribution and density of host trees (primarily Pinus spp.). The primary vegetation on the islands of TIL is the natural secondary forest dominated by Pinus massoniana, which is mixed with many broad-leaved trees and shrub species (Wang et al., Reference Wang, Bao, Yu, Xu and Ping2010). Thus, D. punctatus populations on each island faced almost no selection pressure from the environment or comestibles. Therefore, the spread of D. punctatus was not influenced by environment or comestibles. Collectively, these factors (high dispersal capacity, high habitat availability, low selection pressure and sufficient generations of isolation) resulted in the completely random migration of D. punctatus from island to island, thus formed the present genetic structure and the undefined genetic diversity distribution pattern of D. punctatus on the islands of TIL.
Our results revealed that the geographical isolation and current distribution of fragments did not completely obstruct gene flow and did not lead to significant genetic differentiation among populations of D. punctatus on different islands. Nevertheless, reductions in genetic diversity and changes in haplotype diversity due to genetic drift can occur rapidly when migration is curtailed and population sizes are small (Lacy, Reference Lacy1987; Peakall & Lindenmayer, Reference Peakall and Lindenmayer2006). Our results emphasize that the primary effect of fragmentation on the genetic diversity of D. punctatus in TIL resulted from fragments small in area, which underscores that those species with relatively high dispersal capacities and high tolerance to disturbed environments can also suffer the negative genetic effects of habitat fragmentation (Peakall & Lindenmayer, Reference Peakall and Lindenmayer2006).
Acknowledgements
The National Natural Science Foundation of China (31361123001) and NSF DEB-1342754 funded this research.
Disclosure statement
The authors report no conflicts of interest. The authors alone are responsible for the content and writing of this article.


