


Introduction
More than 90% of the cotton (Gossypium hirsutum L.) grown in Australia is Bt cotton (Maas, Reference Maas2014; Cottee, Reference Cottee2017). The primary targets for this technology are the polyphagous insect pests, Helicoverpa armigera (Hübner) and Helicoverpa punctigera (Wallengren) (Lepidoptera : Noctuidae). The advent of Bt cotton (first grown in 1996) resulted in a large decrease in the use of conventional pesticide to control these pests (Fitt, Reference Fitt2000, Reference Fitt and Swanepoel2004; Fitt & Cotter, Reference Fitt, Cotter and Sharma2004; Wilson et al., Reference Wilson, Downes, Khan, Whitehouse, Baker, Grundy and Maas2013), and the abundance of H. armigera has been suppressed (Baker & Tann, Reference Baker and Tann2017a, Reference Baker and Tannb). However, the threat of Bt resistance developing in Helicoverpa is still a major concern (Fitt, Reference Fitt2000; Downes et al., Reference Downes, Mahon and Olsen2007, Reference Downes, Parker and Mahon2009, Reference Downes, Mahon, Rossiter, Kauter, Leven, Fitt and Baker2010a, Reference Downes, Parker and Mahonb, Reference Downes, Walsh and Tay2016).
A Bt Resistance Management Plan (RMP) has thus been developed (and is reviewed annually) by Monsanto Australia Ltd, in collaboration with the Australian cotton industry, which relies on various component strategies (e.g. mandatory refuge crops to provide large numbers of Bt susceptible moths to help dilute the development of resistance, pupae ‘busting’ via soil tillage to reduce carry-over of resistance between seasons, planting windows to restrict the number of generations of moths exposed to Bt toxins, and destruction of volunteer cotton plants in other crops) (Roush et al., Reference Roush, Fitt, Forrester, Daly, Zalucki, Drew and White1998; Baker et al., Reference Baker, Tann and Fitt2008, Reference Baker, Leven, May and Tann2016a, Reference Baker, Parry and Tannb; Downes et al., Reference Downes, Mahon, Rossiter, Kauter, Leven, Fitt and Baker2010a; Wilson et al., Reference Wilson, Downes, Khan, Whitehouse, Baker, Grundy and Maas2013; Baker & Tann, Reference Baker and Tann2014; Ceeney, Reference Ceeney, Maas and Redfern2016). The RMP is thus operationalized at the farm-scale level. In particular, there were originally (1996–2011) several refuge crop options available to Australian cotton farmers (pigeon pea (Cajanus cajan (L.)), conventional cotton, sorghum (Sorghum bicolor (L.)), and maize (Zea mays L.)), but in 2011 this range was reduced to just pigeon pea and cotton, because of (1) an increased recognition of a risk of Bt resistance in H. punctigera (originally thought much less likely than in H. armigera) and (2) acceptance that maize and sorghum were poor plant hosts for H. punctigera (Baker et al., Reference Baker, Tann and Fitt2008; Downes et al., Reference Downes, Mahon, Rossiter, Kauter, Leven, Fitt and Baker2010a, Reference Downes, Wilson, Knight, Kauter, Leven and Maasc; Baker & Tann, Reference Baker and Tann2014).
Helicoverpa moths can be highly mobile, H. punctigera more so than H. armigera, and the degree of activity varies according to the availability of local food sources and prevailing weather (Wardhaugh et al., Reference Wardhaugh, Room and Greenup1980; Morton et al., Reference Morton, Tuart and Wardhaugh1981; Farrow & Daly, Reference Farrow and Daly1987; Fitt, Reference Fitt1989; Fitt et al., Reference Fitt, Gregg, Zalucki and Twine1990, Reference Fitt, Dillon and Hamilton1995). Helicoverpa’s mobility has been recognized in part in the past by the adoption of area-wide management practices in which groups of farmers work in concert to increase the effectiveness of pest control (Murray et al., Reference Murray, Boddington, Lloyd, Rogers, Zalucki and Ward1998; Dillon & Hoque, Reference Dillon and Hoque2000; Ferguson & Miles, Reference Ferguson and Miles2002; Hoque et al., Reference Hoque, Farquharson and Dillon2002; Macpherson, Reference Macpherson2002; Downes et al., Reference Downes, Kriticos, Parry, Paull, Schellhorn and Zalucki2017). Significant effort has also been devoted recently to understanding landscape-scale (see Materials and Methods for comment on what is meant by this) processes that influence the population dynamics of Helicoverpa spp. and the evolution of resistance, in particular to Bt (Fitt et al., Reference Fitt, Dillon and Hamilton1995; Dillon et al., Reference Dillon, Fitt, Hamilton and Rochester1996, Reference Dillon, Fitt, Zalucki, Zalucki, Drew and White1998; Schellhorn & Paull, Reference Schellhorn and Paull2013; Baker et al., Reference Baker, Parry and Tann2016b; Downes et al., Reference Downes, Kriticos, Parry, Paull, Schellhorn and Zalucki2017; Ives et al., Reference Ives, Paull, Hulthen, Downes, Andow, Haygood, Zalucki and Schellhorn2017; Parry et al., Reference Parry, Paull, Zalucki, Ives, Hulthen and Schellhorn2017). But these insects are capable of movements much wider in scale than landscapes. For example, dense populations of H. punctigera can be generated in inland Australia, following heavy winter rains and local production of host plants, then in spring, when these plants senesce, migrate to the major irrigated agricultural regions of eastern Australia where cotton and other crops are grown throughout summer (Gregg et al., Reference Gregg, Fitt, Zalucki, Murray, McDonald, Corey, Dall and Milne1993, Reference Gregg, Fitt, Zalucki, Murray, Drake and Gatehouse1995, Reference Gregg, Del Socorro and Rochester2001; Maelzer et al., Reference Maelzer, Zalucki and Laughlin1996; Rochester et al., Reference Rochester, Dillon, Fitt and Zalucki1996; Oertel et al., Reference Oertel, Zalucki, Maelzer, Fitt and Sutherst1999; Zalucki & Furlong, Reference Zalucki and Furlong2005; Baker et al., Reference Baker, Tann and Fitt2011; Baker & Tann, Reference Baker and Tann2017a). H. armigera also seems likely to move at scales much greater than landscapes, given that little genetic structure has been found throughout broad areas of Australia, implying high gene flow between populations in geographically distinct regions (Daly & Gregg, Reference Daly and Gregg1985; Endersby et al., Reference Endersby, Hoffmann, McKechnie and Weeks2007; Weeks et al., Reference Weeks, Endersby, Lange, Lowe, Zalucki and Hoffmann2010; but also see Scott et al., Reference Scott, Wilkinson, Lawrence, Lange, Scott, Merritt, Lowe and Graham2005, Reference Scott, Lawrence, Lange, Graham, Hardwick, Rossiter, Dillon and Scott2006 and earlier papers cited therein). Both moth species feed on a large range of exotic weeds, native plants (especially H. punctigera) and agricultural crops (Fitt, Reference Fitt1989; Zalucki et al., Reference Zalucki, Daglish, Firempong and Twine1986, Reference Zalucki, Gregg, Fitt, Murray, Twine and Jones1994; Walter & Benfield, Reference Walter and Benfield1994; Fitt & Cotter, Reference Fitt, Cotter and Sharma2004; Rajapakse & Walter, Reference Rajapakse and Walter2007; Cunningham & Zalucki, Reference Cunningham and Zalucki2014; Gregg et al., Reference Gregg, Henderson, Del Socorro, Le Mottee and Birchall2016).
These movements and polyphagy beg answers to the following questions. How important are plants other than those in the cotton cropping system per se (i.e. cotton and pigeon pea) in providing significant, additional (‘unstructured’) refuges for the supply of Bt-susceptible moths, and over what spatial scales are these contributions made? Put differently, do the origins of moth populations reflect the cropping landscapes and, more broadly, the cropping regions they are found within? If they do not, then models of resistance evolution need to be cognizant of such discrepancies. We worked in three widely separated cotton-producing regions in southern Queensland (Qld) and northern New South Wales (NSW), amongst which cropping complexity varies substantially. We made no attempt to measure moth production per se, which would likely have varied greatly both within and between source habitats (e.g. unsprayed sorghum crops for H. armigera, but not H. punctigera) and sink habitats (e.g. Bt cotton crops for both moth species) (Baker et al., Reference Baker, Tann and Fitt2008). Such a survey could be fraught with misconceptions, without a huge sampling effort, given the spatial scale of the study and the complexities of the farms therein. Rather, we focussed simply on the host plant origins of the moth populations found moving about within the landscapes and production regions. We did, however, measure the abundance of Helicoverpa eggs, and their species identity, on nearby Bt cotton crops at the same time as we collected the moths, to indicate the relative pest pressure of the two Helicoverpa species in space and time.
C3 and C4 plants possess different photosynthetic pathways and thus differ in the relative abundance of naturally occurring, stable carbon isotopes (13C, 12C) they pass on to insect herbivores feeding on them (Smith & Epstein, Reference Smith and Epstein1971; O'Leary, Reference O'Leary1988; Ambika et al., Reference Ambika, Sheshshayee, Viraktamath and Udayakumar2005). Several authors (Gould et al., Reference Gould, Blair, Reid, Rennie, Lopez and Micinski2002; Head et al., Reference Head, Jackson, Adamczyk, Bradley, Van Duyn, Gore, Hardee, Leonard, Luttrell, Ruberson, Mullins, Orth, Sivasupramaniam and Voth2010; Brévault et al., Reference Brévault, Nibouche, Achaleke and Carrière2012; Baker & Tann, Reference Baker and Tann2013; Ye et al., Reference Ye, Fu, Ouyang, Xie and Ge2015; Tsafack et al., Reference Tsafack, Alignier, Head, Kim, Goulard, Menozzi and Ouin2016) have used these carbon isotope signatures (often referred to as delta C or δ13C) as natural markers to trace the plant host origins of captured lepidopteran moths i.e. where they fed as larvae. C3 plants include legumes such as pigeon pea, as well as cotton, sunflower (Helianthus annuus (L.)), chickpea (Cicer arietivum L.), wheat (Triticum aestivum L.) and soybean (Glycine max Merr.). They commonly have δ13C between −20 and −35‰. C4 plants are comprised predominantly of grasses, including sorghum and maize. Some Chenopodeaceae and many herbaceous weeds are also C4 (Sage & Monson, Reference Sage and Monson1998). C4 plants commonly have δ13C between −5 and −20‰. Some ecosystems can be dominated by either C3 or C4 plants e.g. the plants in the Australian mulga ecosystems, which are common to inland areas where large populations of H. punctigera have been known to develop (Zalucki et al., Reference Zalucki, Daglish, Firempong and Twine1986, Reference Zalucki, Gregg, Fitt, Murray, Twine and Jones1994; Gregg et al., Reference Gregg, Fitt, Zalucki, Murray, Drake and Gatehouse1995) are predominantly C3 (Pate et al., Reference Pate, Unkovich, Erskine and Stewart1998). The majority of the known host plants for H. punctigera, at least in inland Australia, are likely to be C3 (Zalucki et al., Reference Zalucki, Gregg, Fitt, Murray, Twine and Jones1994; Sage & Monson, Reference Sage and Monson1998; Gregg et al., Reference Gregg, Henderson, Del Socorro, Le Mottee and Birchall2016).
Mattson (Reference Mattson1980) and Ambika et al. (Reference Ambika, Sheshshayee, Viraktamath and Udayakumar2005) also suggested it might be possible to discriminate legumes and non-legumes using stable nitrogen isotope signatures (15N, 14N; hence delta N or δ15N), and Ye et al. (Reference Ye, Fu, Ouyang, Xie and Ge2015) indeed used δ15N to discriminate the origins of H. armigera moths from within a group of C3 host plants (cotton, soybean, and peanut) in China. However, Baker & Tann (Reference Baker and Tann2013) had only limited success with δ15N when trying to distinguish pigeon pea and cotton origins. They argued that, as well as pigeon pea often being a poor fixer of atmospheric N (Brockwell et al., Reference Brockwell, Andrews, Gault, Gemell, Griffith, Herridge, Holland, Karsono, Peoples, Roughley, Thompson, Thompson and Troedson1991), the common practice of nitrogen gassing of fields (as a fertilizer source) prior to sowing crops possibly masked differences that might otherwise have been demonstrated.
In this study, we used carbon, and to a lesser extent, nitrogen isotope signatures to characterize the plant host origins of the populations of the two Helicoverpa species in the three regions in Qld and NSW at different times during the cotton cropping season.
Materials and methods
Study areas
Two contrasting agricultural regions, the Maranoa and Darling Downs, both in southern Queensland, Australia and approximately 200 km apart (fig. 1), were used primarily in this study, over a 3-year period (2012–13 to 2014–15). During the last year of the study (and to a limited extent in 2013–14), moths were also collected near Narrabri in a third region, the Lower Namoi, in northern New South Wales (fig. 1). Within each of these three regions, three sub-regions (approximately 20–30 km in diameter) were selected for Helicoverpa collections (St George, Dirranbandi and Thallon for the Maranoa; Pampas, Nandi, and Cecil Plains for the D. Downs; Myall Vale, Merah North and Pilliga for the L. Namoi) (Figs S1 and S2). Within each sub-region, traps were set at three sites for Helicoverpa moths. In most cases in the Maranoa and D. Downs, these sites were reused each year throughout the study, but in Nandi, one site (Arrow Energy) had to be shifted to The Meadows (13 km distant) in the 3rd year of the study (see below for reasoning). There were thus nine sites used on each sampling occasion within each region. Two of the three sites in the Myall Vale sub-region (ACRI and Merinda) were part of a long-term pheromone trapping grid run in this area from 1992 to 2015 (Baker et al., Reference Baker, Tann and Fitt2011; Baker & Tann, Reference Baker and Tann2017a, Reference Baker and Tannb). GPS coordinates for all trapping sites are provided in Table S1.

Fig. 1. Locations of the Maranoa, Darling Downs and Lower Namoi regions within eastern Australia.
All three regions are characterized by hot, wet summers and mild, dry winters (Fig S3a, b). Most notably, summer was wetter than average in the D. Downs in 2012–13, but drier than average in the Maranoa. In 2013–14, summer was especially dry in the D. Downs, but early autumn was wetter there than average. Spring was drier than average in all three regions in 2014–15, whilst autumn was wetter than average in the L. Namoi.
Moth collections
We originally intended to only use light traps to catch moths. Light traps are preferable because they capture both male and female moths, unlike pheromone traps which catch only males (Baker et al., Reference Baker, Tann and Fitt2011). Light traps are, however, more cumbersome and require the sorting of desired species from bi-catch of other insects. Indeed, because of vast numbers of other insects fouling our light traps on our first sampling occasion, especially in the Maranoa, we decided to set pheromone traps as well, on all subsequent occasions, to provide insurance against such trap fouling.
One light trap (12 volt vertical ultraviolet light, placed upon a collecting bucket containing 70% ethanol, and fitted with photo sensitive switches) and two pheromone traps (Agrisense® dry-funnel canister trap containing Agrisense® pheromone lure and Killmaster Zero® killing strip; one trap for each species) were established at each site, adjacent to the nearest Bollgard II® cotton crop. Each trap was located approximately 100 m from its nearest neighbour. Traps were set for 2–3 nights on each sampling occasion. During 2012–13, 2013–14, and 2014–15, traps were set in the Maranoa and D. Downs on four, five and four occasions, respectively (Table S2). During 2014–15, traps were also set on four occasions near Narrabri. During 2013–14, a small number of moths were also selected for stable isotope analyses from amongst catches in all pheromone traps within the long-term trapping grid referred to above.
We were unable to collect moths in the D. Downs during mid-season (January) 2013. Fortunately, colleagues working on a separate project in the D. Downs during January 2013 did collect moths, with pheromone traps, within each of the same sub-regions that we used. We have incorporated data from stable isotope analyses of these extra moth collections into our data set, with the caveat that they were not from the same sites per se within the three sub-regions.
Egg collections
On most moth trapping occasions, Helicoverpa spp. egg densities were also measured within the nearby Bollgard II cotton crop. No egg checks were made in the Maranoa in February 2013 because local flooding prevented access to the cotton fields, nor in April 2014 (both Maranoa and D. Downs) and March 2015 (all three regions) because the cotton plants had either senesced, been defoliated or were harvested at these times and were thus deemed unattractive to moths. Eggs were counted in each Bt cotton crop within six 1-m lengths of crop row spaced at least 20 m apart, on 2 consecutive days. Each cotton plant within each row was visually checked throughout for eggs and average egg abundance m−2 was recorded for each field. Sub-samples of these eggs were then reared to moths in the laboratory to determine species prevalence (see Table S3 for extra details). [No Helicoverpa larvae were found on any sampling occasion, although the larvae of Spodoptera litura (F.) and Earias perhuegeli Holloway (Noctuidae) were occasionally seen.]
Reproductive maturity and mating status
In most cases, all female moths caught in light traps were dissected to determine their reproductive maturity/mating status (i.e. gravid or not/numbers of spermatophores). However, when very large numbers of moths were collected, only a maximum of 20 moths/species/trap/night for each site were dissected. This applied especially to H. punctigera catches.
Stable isotope analyses of moths
Sub-samples of the trapped moths were prepared for stable isotope analyses. Moths that were caught in light traps were selected first, then supplemented by moths caught in pheromone traps. Inevitably, some traps caught many moths, and others caught few. We chose all or very nearly all moths from traps with small catches and discarded more from traps with large catches. Overall, we analyzed 7609 H. armigera moths and 4546 H. punctigera moths, collected during 2012–2015, for their stable isotope signatures (Table S4).
A 1 mg sample of head capsule was dissected from each oven-dried moth selected for stable isotope analysis, placed in pressed tin cups (8 × 5 mm), and δ13C and δ15N were determined at the University of New England, New South Wales using initially a Carlo Erba NA 1500 Solid Sample Analyzer coupled to a TracerMaSS Stable Isotope Analyzer. This system was later upgraded to a Sercon 20–22 continuous flow isotope ratio mass spectrometer connected to an ANCA-GSL solid sample preparation unit. Wheat flour (42.1% carbon, δ13C = −22.9 and 1.7% nitrogen, 0.3680 atm%, δ15N = 4.63) was used as the standard and this was referenced to Iso-Analytical Ltd (UK)’s wheat flour standard IA-R001. The samples collected during 2012–13 were analyzed using the TracerMaSS equipment; later samples were analyzed using the Sercon system.
Land-use metrics for each site
Data for the hectares grazed by stock and sown to major crops in the Maranoa and the D. Downs throughout 2012–2015 were provided by Neil Clark Business Intelligence (Bendigo, Vic.). These data are based on a geographical format (Australian Standard Geographical Structure) wherein the base unit for reporting data is the Statistical Area 2 (SA2). Data for the D. Downs include inputs from the Wambo, Jondaryan, Pittsworth and Millmerran SA2s; data for the Maranoa include the Balonne SA2 only.
The agricultural land in the Maranoa is, as a whole, dominated by grazing on unimproved land (Fig. S4). The main crops are wheat, cotton, and chickpea (Fig. S5). Cropping is intensive within relatively small regions of the Maranoa where there is access to irrigation (Australian Bureau of Agricultural and Resource Economics and Sciences, 2015). Further afield, dryland wheat and, to a lesser extent, chickpea are interspersed amongst permanent grazing land, with crop stubbles also used for grazing. Cropping and grazing are more evenly represented in the D. Downs, with a greater variety of crop types used there compared with the Maranoa (Fig. S5), most notably sorghum. Grazing on unimproved land is more common towards the west of the D. Downs, with cropping most common towards the east, especially where there is irrigation (Australian Bureau of Agricultural and Resource Economics and Sciences, 2015).
The L. Namoi is different again from the D. Downs and the Maranoa. Wheat is the most common crop, but whilst sorghum is widely grown, more cotton and chick pea have been grown in the L. Namoi in recent years, including those encompassing the study reported here, than sorghum (Baker & Tann, Reference Baker and Tann2017b). The L. Namoi is thus intermediate between the D. Downs and the Maranoa in terms of cropping structure.
During each season that moths were trapped at the study sites, the crops sown in all fields within a 2 km radius of each pair of traps were recorded. These data were included in a geographical information system using ArcGIS (ESRI, 2015). Field maps were first georeferenced and the land use categories that were recorded within each 2 km radius were digitized. The Dissolve tool in ArcGIS was then used to generalize the land use categories to n = 11 (cotton, sorghum, pigeon pea, other legume and maize crops; cereal, sorghum, and other crop stubbles; grazing, fallow and other land-use), and the areas of each of these were then calculated for each trapping site. Figure S6 illustrates outputs from such analyses, in this case, from one site in the Maranoa and another from the D Downs.
The term landscape has been variably applied in the context of Helicoverpa spp. by previous authors (Dillon et al., Reference Dillon, Fitt, Zalucki, Zalucki, Drew and White1998; Tsafack et al., Reference Tsafack, Menozzi, Brevault, Soti, Deconchat and Ouin2013, Reference Tsafack, Alignier, Head, Kim, Goulard, Menozzi and Ouin2016; Schellhorn & Paull, Reference Schellhorn and Paull2013; Liu et al., Reference Liu, Yang, Yang, Wang, Yang, Lu and Gardiner2016a, Reference Liu, Yang, Yang and Lub) (e.g. study areas ranging from 500 m in radius to 10 km radius have been used). Such a range in size thus spans the areas within which we recorded land-use around each trap (2 km radii) and the sub-regions that we grouped traps within (approximately 20–30 km in diameter). We therefore only use the term landscape loosely here, recognizing this divergence in previous approaches. We focus on three principle scales: the immediate trap-site environs, sub-region, and region. We do note, however, that our three sub-regions in the D. Downs (Pampas, Nandi, and Cecil Plains) correspond with the landscapes used by Schellhorn & Paull (Reference Schellhorn and Paull2013); Ives et al. (Reference Ives, Paull, Hulthen, Downes, Andow, Haygood, Zalucki and Schellhorn2017) and Parry et al. (Reference Parry, Paull, Zalucki, Ives, Hulthen and Schellhorn2017). We also recorded land-use around our trap sites at the scale of 2 km radii to be in agreement with the scale of land-use that Schellhorn & Paull (Reference Schellhorn and Paull2013) used when relating such to Helicoverpa egg numbers at selected sites.
Data analyses
Statistical tests were applied using Statistix® 10 (Analytical Software, 2013). Analyses of variance were used to test for significant effects of moth species, region, sub-region, site, and year on the plant host origins of moths (i.e. proportions that were C3 and C4). Tukey's test was used to identify significant differences in plant host origins between individual regions and Pearson's r to demonstrate correlations between hectares of sorghum grown (and all C4 crops grown) and the observed proportions of trapped moths that were C4 in origin. Proportional data were transformed to arcsin prior to analysis.
Results
Abundance of eggs and species prevalence
The abundance of Helicoverpa eggs was reasonably similar across the three sub-regions within each of the separate regions during all three seasons (fig. 2a–c). During 2012–13, eggs were particularly common in the D. Downs in late January. In 2013–14, the abundance of eggs in the Maranoa was much higher in general than in the previous year but remained comparable between both years in the D. Downs. Egg numbers peaked in December–January in the Maranoa, and in January in the D. Downs. During 2014–15, the abundance of eggs peaked in February in the Maranoa but again peaked in January in the D. Downs. Egg densities were relatively low near Narrabri during 2014–15, with most found during January.
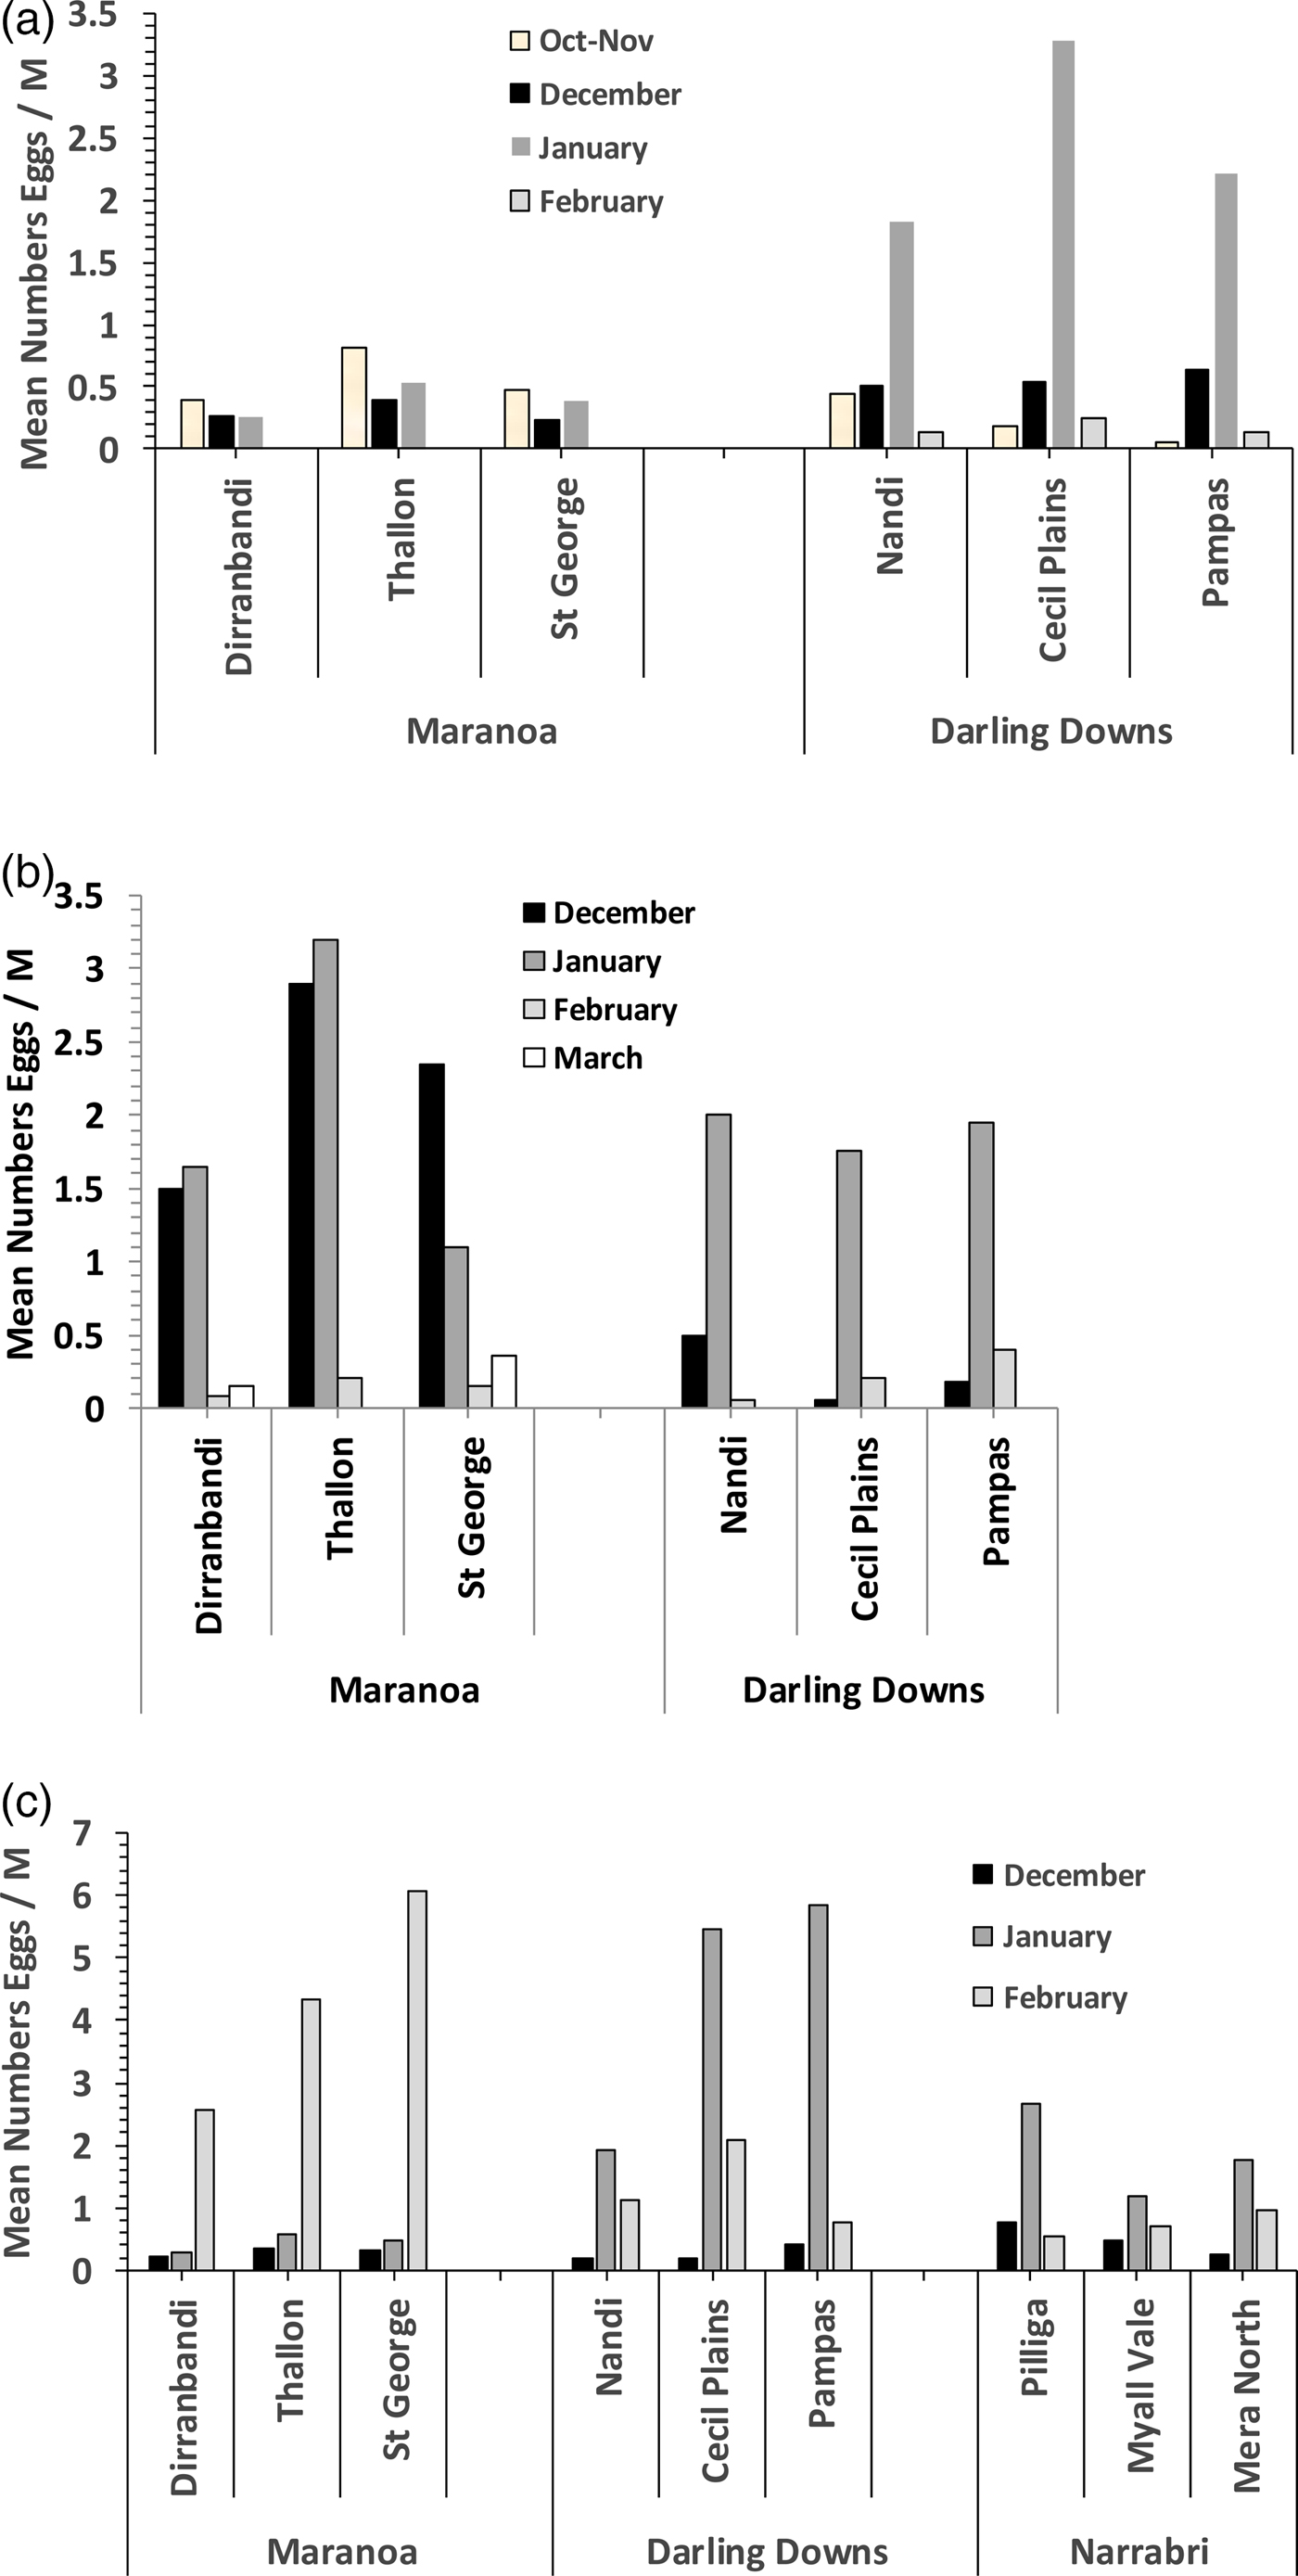
Fig. 2. Mean numbers of Helicoverpa eggs (per metre of crop row) recorded on Bollgard II cotton in the Maranoa and Darling Downs during (a) 2012–13 and (b) 2013–14, and (c) in the Maranoa, Darling Downs, and near Narrabri during 2014–15.
The vast majority (>90%) of eggs laid at the start of the season (December) and reared to moths in the laboratory were H. punctigera (all regions and years combined), whilst most (>70%) were H. armigera in late season (February) (Table S3). Such is to be expected given the different seasonal patterns in abundance of moths of these two species (Baker & Tann, Reference Baker and Tann2017a, Reference Baker and Tannb).
Reproductive maturity and mating status
Overall, 61.7% of female moths (both species pooled) were gravid during 2012–13 and there was a mean of 2.2 spermatophores present/female moth (i.e. female moths had mated on average approximately twice). During 2013–14, 79.6% of females were gravid and there was a mean of 2.1 spermatophores/female moth, whilst in 2014–15, 64.9% of females were gravid and there was a mean of 2.3 spermatophores/female moth. No consistent species, month of sampling or location (site, sub-region, region) differences were found, hence all data within individual seasons were combined here. Few of the female moths were unmated (overall, 8.5% of H. armigera and 9.1% of H. punctigera).
Stable isotope signatures of moths
The carbon isotope signatures for groups of moths caught concurrently in pheromone and light traps were very similar. Figure S7 illustrates examples of such for the H. armigera and H. punctigera moths caught in the Maranoa during February 2015 (all nine sites included). Therefore, moths from these two different types of traps were pooled in the analyses that follow (but keeping the two species separate). There were also no differences between the stable isotope signatures of male and female moths (see also Baker & Tann Reference Baker and Tann2013), nor the reproductive status of females, so these data were pooled as well. We accepted that a δ13C value of <−20‰ is indicative of a moth arising from a C3 host plant and a δ13C ≥ −20‰ is indicative of a moth resulting from a C4 host plant, as we have in the past (Baker & Tann, Reference Baker and Tann2013).
Early in each cropping season (November–December), most H. armigera moths, in both the Maranoa and the D. Downs, were of C3 host plant origin (figs 3–5). On the other hand, later in the cropping season (January–April), the proportions of H. armigera moths that were of C4 origin increased, and often predominated, but the shift to C4 was generally less marked in the Maranoa compared with the D. Downs. In contrast, most H. punctigera moths, in both the Maranoa and the D. Downs, were of C3 host plant origin throughout the study (figs 3–5), but occasionally (e.g. February 2013 in the D. Downs) there were similar proportions of C3 and C4 moths. The more limited data available for the L. Namoi suggested similar patterns to those recorded for the Maranoa and D. Downs.

Fig. 3. Percentages of (a) H. armigera and (b) H. punctigera moths trapped in the Maranoa (Mar) and Darling Downs (DD) during the 2012–13 season that were of either C3 or C4 plant host origins. Numbers in parentheses are numbers of C3 : C4 moths (where too few moths were available for stable isotope analyses to justify percentage calculations).

Fig. 4. Percentages of (a) H. armigera and (b) H. punctigera moths trapped in the Maranoa (Mar), Darling Downs (DD), and near Narrabri (Narr) during the 2013–14 season that were of either C3 or C4 plant host origins. Numbers in parentheses are numbers of C3 : C4 moths (where too few moths were available for stable isotope analyses to justify percentage calculations).

Fig. 5. Percentages of (a) H. armigera and (b) H. punctigera moths trapped in the Maranoa (Mar), Darling Downs (DD) and near Narrabri (Narr) during the 2014–15 season that were of either C3 or C4 plant host origins. Numbers in parentheses are numbers of C3 : C4 moths (where too few moths were available for stable isotope analyses to justify percentage calculations).
No patterns in prevailing weather were observed which consistently corresponded with the occasional large differences in C3 : C4 proportions of moths recorded between the separate regions (figs 3–5, Fig. S3a, b).
The numbers of H. punctigera moths trapped and analyzed for stable isotope signatures were occasionally too few at individual sites in the Maranoa and D. Downs (the latter especially), within individual seasons, to calculate meaningful proportions of C3 : C4 individuals at site level, and thereby test for significant variability between species, sites, sub-regions, regions, and years within a single analysis. Data were therefore bulked, for initial analyses, at sub-region level (figs 6 and 7). At that level, there was a marked inter-specific difference in the proportion of moths that were of C3 plant host origin; proportionally more H. punctigera were C3 than was the case for H. armigera (Table 1). There were also significant effects of region and year on % C3. Much higher % C3 was found in the Maranoa than the D. Downs, and % C3 was lower in 2012–13, in particular in H. armigera. There was, however, no effect of sub-region on % C3, in either the Maranoa or the D. Downs. Alternatively, if the data were kept at site level, but bulked across the years (to provide larger numbers of moths at site level), there was no significant effect of site, nor sub-region, on % C3 within either species in both regions, but the strong inter-specific and regional differences were retained (data not shown here).

Fig. 6. Percentage of moths trapped in the three sub-regions of the Darling Downs each season that were C3. Overall totals of 3570 H. armigera and 1102 H. punctigera were analyzed for δ13C. Numbers per season in the sub-regions varied from 15 (H. punctigera, Pampas, 2014–15) to 658 (H. armigera, Cecil Plains, 2012–13).

Fig. 7. Percentage of moths trapped in the three sub-regions of the Maranoa each season that were C3. Overall totals of 2821 H. armigera and 2866 H. punctigera were analyzed for δ13C. Numbers per season in the sub-regions varied from 91 (H. punctigera, Dirranbandi, 2012–13) to 694 (H. punctigera, St George, 2013–14).
Table 1. Analysis of Variance outcomes from testing for significant variability between proportions of moths (both H. armigera and H. punctigera) with C3 plant host origins collected in the Maranoa and Darling Downs throughout 2012–15. Proportions transformed to arcsin prior to analysis

Numbers in bold highlight significance. Only significant interactions between factors are shown.
In addition, during 2014–15 when all three regions (Maranoa, D. Downs, and L. Namoi) could be compared (but with data again pooled at the sub-region level because of small catches at some individual sites, in particular of H. punctigera), there was a significant difference in the proportions of moths that had C3 origins between the regions, as well as a significant difference between species (Table 2) (figs 6–8). Tukey's test (at P < 0.05) suggested there was no difference in C3 proportion between the Maranoa and the L. Namoi, but both these regions had higher C3 proportions than that were found in the D. Downs. H. punctigera had higher C3 than H. armigera. There was no effect of sub-region.

Fig. 8. Percentage of moths trapped in the three sub-regions near Narrabri in the 2014–15 season that were C3. Overall totals of 1095 H. armigera and 505 H. punctigera were analyzed for δ13C. Numbers in the sub-regions varied from 121 (H. punctigera, Myall Vale) to 419 (H. armigera, Myall Vale).
Table 2. Analysis of Variance outcomes from testing for significant variability between proportions of moths (both H. armigera and H. punctigera) with C3 plant host origins collected in the Maranoa, Darling Downs, and Lower Namoi during 2014–15. Proportions transformed to arcsin prior to analysis.

Numbers in bold highlight significance.
Catches of H. armigera were, however, large enough to meaningfully analyze fully down to site level across the whole study. In the case of the Maranoa and D. Downs, across all 3 years, there were significant differences in % C3 of moths at regional and year level, but not at sub-region or site level (Table 3). % C3 was higher in the Maranoa compared with the D. Downs, in particular in 2013–14 (compare figs 6 and 7). In the case of 2014–15 only, for all three regions, the only significant difference detected in % C3 was between regions (Table 4). Tukey's test (at P < 0.05) found % C3 was lower in the D. Downs than in both the Maranoa and L. Namoi.
Table 3. Analysis of Variance outcomes from testing for significant variability between proportions of H. armigera moths (only) with C3 plant host origins collected in the Maranoa and Darling Downs during 2012–15. Proportions transformed to arcsin prior to analysis.

Numbers in bold highlight significance. Only significant interactions between factors are shown.
.
Table 4. Analysis of Variance outcomes from testing for significant variability between proportions of H. armigera moths (only) with C3 plant host origins collected in the Maranoa, Darling Downs, and Lower Namoi during 2014–15. Proportions transformed to arcsin prior to analysis.

Numbers in bold highlight significance.
Whilst δ13C signatures enabled the separation of C3 and C4 plant host origins, δ15N signatures did not readily assist this separation further, at least not at the level of within individual monthly collections of moths from unknown origins (fig. 9 provides a bi-plot of δ13C × δ15N for H. armigera moths trapped in January 2013 in the Maranoa as an example). However, Baker & Tann (Reference Baker and Tann2013) recorded the δ13C and δ15N values for individual H. armigera, collected (as pupae) from beneath particular crops (cotton, pigeon pea, sorghum, and maize) from a range of sites in different years, then reared to moths without further feeding. These data represent isotope measures of moths from known host plant origins. They are also plotted (as means) in fig. 9. Most notably, the mean data for H. armigera that fed on sorghum match very well with the C4 moths of unknown origin collected in the Maranoa (the same was the case for H. armigera moths from the D. Downs, data not shown here). Unfortunately, equivalent data for H. punctigera raised from known plant host sources are not available.

Fig. 9. Bi-plots of the δ13C and δ15N values (‰) for all individual H. armigera moths caught in the Maranoa during January 2013 (![]() ). Mean δ13C and δ15N values for H. armigera moths reared from pupae collected beneath cotton (blue X), pigeon pea (black), maize (orange), and sorghum (red) crops (thus of known plant host origin) are also marked.
). Mean δ13C and δ15N values for H. armigera moths reared from pupae collected beneath cotton (blue X), pigeon pea (black), maize (orange), and sorghum (red) crops (thus of known plant host origin) are also marked.
Bi-plots were also derived from the overall stable isotope data for both species of moths collected throughout all three regions during 2012–15 (figs 10 and 11). Data points (means of individuals trapped on separate visits) were plotted where N varied from 6 to 797. These bi-plots illustrate that whilst there appeared to be no consistent shifts in δ13C signatures during the summer active season for both Helicoverpa spp., there was a shift in δ15N signatures, in particular in C3 moths ; δ15N values of C3 moths were generally low at the start of the season (December) but increased by late season (March–April).

Fig. 10. Bi-plots of the mean δ13C and δ15N values (‰) for all H. armigera moths caught in the Darling Downs, Maranoa, and Lower Namoi throughout 2012–15, according to month of collection in the separate seasons.
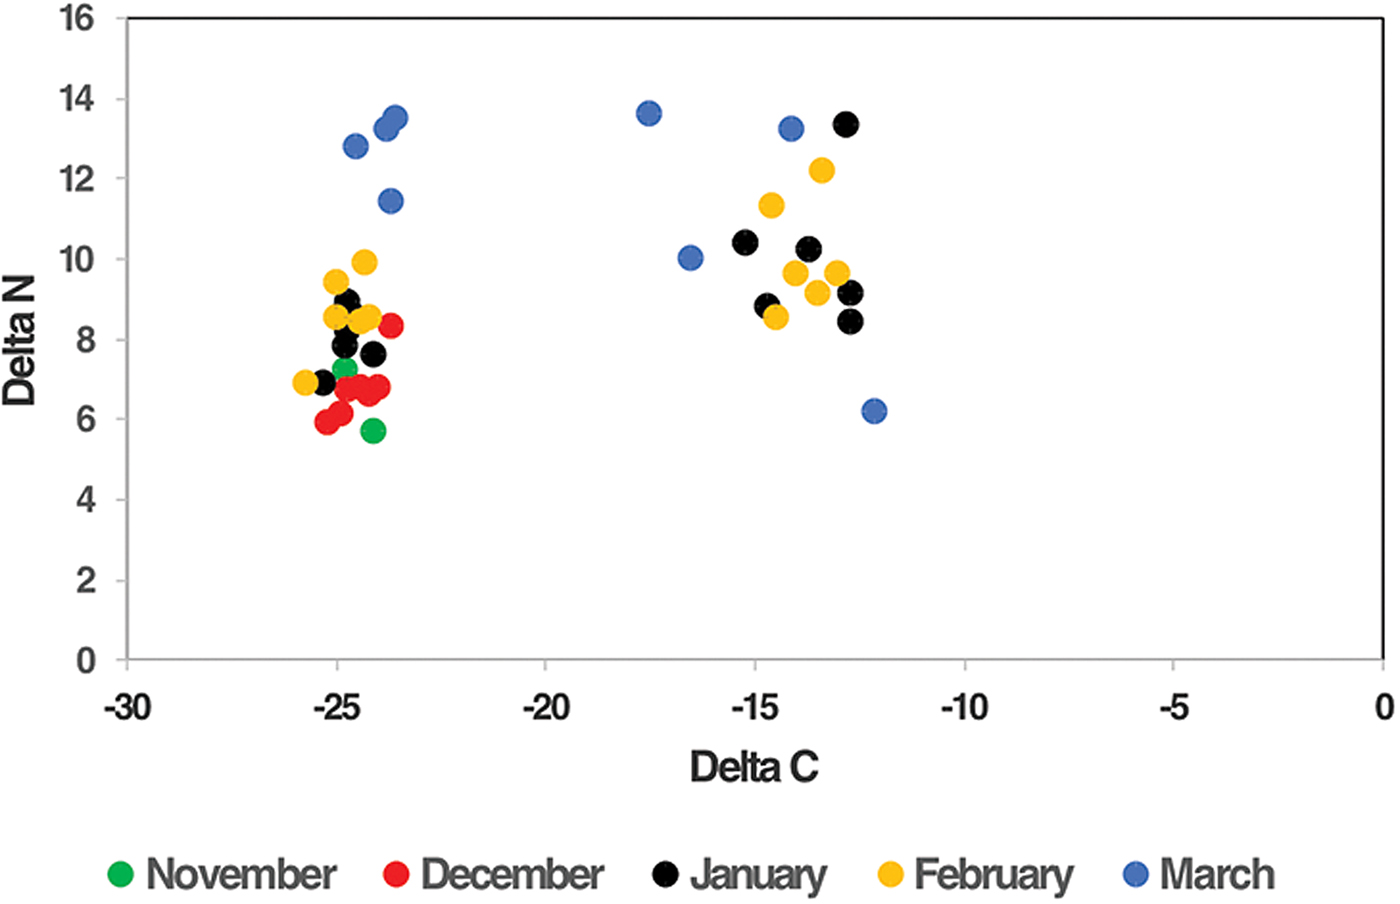
Fig. 11. Bi-plots of the mean δ13C and δ15N values (‰) for all H. punctigera moths caught in the Darling Downs, Maranoa, and Lower Namoi throughout 2012–15, according to month of collection in the separate seasons.
Land-use metrics associated with traps
The most common crop within the 2 km radii of the traps in all three regions was cotton (Table 5), but note the deliberate placement of the traps adjacent to cotton crops would have inflated the apparent dominance of this crop. Sorghum was common in the vicinity of the traps in the D. Downs during the 2012–13 season, but less so in the following two seasons. Sorghum was rarely sown in the Maranoa and was also scarce in the L. Namoi, at least in the vicinity of our traps. Land use in the L. Namoi during 2014–15, more closely resembled that in the Maranoa than the D. Downs.
Table 5. Mean proportions (%) of various (summer) land-uses in the Darling Downs and Maranoa during 2012–15 and in the Lower Namoi during 2014–15 (N = 9 sites for each region, each year).

Data recorded for land-uses within 2 km radii of moth traps. *Proportion of C4 crops amongst all crops growing at time of moth collections.
It was only appropriate to relate the proportions of moths with C3 and C4 signatures to the concurrent areas of nearby (2 km radii) crops within the D. Downs (because C4 crops were too rare in the Maranoa and L. Namoi), and then only for H. armigera at site level (given the low numbers of H. punctigera caught at some sites). No significant correlations (Pearson's r) were observed between the areas of sorghum grown (the most common C4 crop) and the proportions of the H. armigera moths that were C4 (using nine sites, three separate seasons, n = 27; r = 0.266, P > 0.05). In addition, at sub-region level within the D. Downs, no significant correlations were found between the areas of sorghum grown and the C4 proportions of H. armigera moths (using three sub-regions, three separate seasons, n = 9; r = 0.382, P > 0.05). No significant correlations were obtained when the overall areas of C4 crops were used instead of just sorghum (data not shown).
Discussion
Overall (all 3 years, all sites), 51% of the H. armigera moths trapped alongside cotton crops in the Maranoa had δ13C signatures indicative of C4 host plant origins. This contrasts with 68% in the D. Downs. Whilst a higher % C4 was to be expected in the D. Downs, given the greater abundance of C4 host plants there (especially sorghum), the fact that approximately half of the H. armigera in the Maranoa were C4 (and up to 80% in some months – e.g. February 2014) was surprising. C4 crop host plants, at least those known to be highly attractive to H. armigera, are rare in the Maranoa. Where did these moths come from? H. armigera utilizes a broad range of both native and exotic plant hosts besides crops in Australia (especially amongst the Asteraceae, Fabaceae, and Malvaceae), but the relative importance of such plants in the population dynamics of the insect is very poorly understood. Perhaps, local C4 native plants and exotic weeds produced the C4 H. armigera moths we collected in the Maranoa. But it is also possible that the source of the C4 moths is further away, such as sorghum crops in other production regions. The δ13C/δ15N signatures of the C4 H. armigera trapped in the Maranoa matched well with those recorded for moths known to have come from sorghum crops (Baker & Tann, Reference Baker and Tann2013), sorghum has been shown capable of producing massive numbers of H. armigera (Fitt, Reference Fitt1989; Baker et al., Reference Baker, Tann and Fitt2008), and H. armigera is capable of wide scale dispersal (see references in the Introduction).
In addition, we were unable to show, in the D. Downs at least, an association between the proportion of H. armigera moths that were of C4 origin and the prevalence of host C4 crops locally (within a 2 km radius of individual traps), and also when the data were grouped at sub-region level. These data thus fail to support the notion that moth populations reflect host cropping structure at the landscape scale.
Many native and exotic plants are also known to be hosts for the larvae of H. punctigera. However, few of these are thought to be C4 plants (see Introduction), yet up to 50% of the H. punctigera catch in the D. Downs were C4. It is, therefore, puzzling where the C4 H. punctigera moths caught in this study, in all three regions, originated from. Helicoverpa punctigera rarely oviposits on sorghum and maize (3% of Helicoverpa eggs laid on sorghum crops in eastern Australia during 2012–15 and reared to moths were H. punctigera, and likewise 0.5% of eggs laid on maize were H. punctigera; S. Downes, CSIRO, unpublished data). In addition, H. punctigera moths were rarely reared from pupae collected beneath these two crops in the field (Baker et al., Reference Baker, Tann and Fitt2008), and when we have attempted to rear H. punctigera in the laboratory on artificial diet which included maize or sorghum flour, the resultant moths have had deformed wings (C. Tann & G. Baker, unpublished data). It, therefore, seems unlikely that sorghum and maize crops provided the C4 source of the large numbers of H. punctigera moths we captured in the present study. As with H. armigera, further studies are needed to clarify the host plants that are most influential in driving the dynamics of H. punctigera. But this is unlikely to be a straightforward exercise; the interactions between the abundance and movement of this pest, its plant hosts, and prevailing weather are likely to be complex (Gregg et al., Reference Gregg, Henderson, Del Socorro, Le Mottee and Birchall2016).
The stable isotope signatures of C3 H. armigera and H. punctigera moths shifted during the summer cropping seasons (higher δ15N values were recorded as the seasons progressed), probably reflecting changes in the various host plant contributions to the moth populations. Chickpeas are known to produce large numbers of moths in spring (Fitt & Cotter, Reference Fitt, Cotter and Sharma2004; Baker & Tann, Reference Baker and Tann2017a, Reference Baker and Tannb). However, wheat is also a host of H. armigera (Wardhaugh et al., Reference Wardhaugh, Room and Greenup1980; Wilson, Reference Wilson1983; Lu & Baker, Reference Lu and Baker2013). Although large numbers of feeding larvae are rarely seen on wheat, much wheat is grown in the Maranoa and D. Downs. Thus recruitment from this crop could still be substantial. However, wheat flowers in early spring and is most attractive to H. armigera then. Perhaps some of our very earliest catches of H. armigera during the summer cropping season could have originated in wheat crops, but we doubt many did. Of course, some of the many other C3 plant hosts of H. armigera, about which we know so little, could also have been responsible for the high proportion of C3 moths in the early season.
Whilst the stable isotope signatures we observed later in the season approached those of moths known to have come from pigeon pea and cotton crops, the former of which should be generating the bulk of refuge crop derived moths at that time (Baker & Tann, Reference Baker and Tann2014), matches between such signatures were still not persuasive. These results suggest that pigeon pea and cotton crops may have been contributing little to the overall populations of Helicoverpa moths within the landscapes studied in recent years. This is perhaps not surprising for cotton, given the dominance (>90%) of Bt cotton varieties amongst those grown and the limited use of conventional cotton as a refuge crop, but the poor evidence of pigeon pea crops contributing significantly to moth populations in summer is of concern, given this crop is the primary Bt refuge being used in cotton landscapes. However, we used only small numbers and few collections of H. armigera moths as a basis for our measures of known host origin data, and other explanations of the data may be possible. For example, the stable isotope signatures of host plants such as pigeon pea, and hence moths feeding on them, may vary in space and time more than we have allowed for (e.g. reflecting variation in N status of soils they are grown in).
Baker & Tann (Reference Baker and Tann2013) reported that 53% of the H. armigera moths they caught in cotton fields in northern New South Wales and southern Queensland over an 8-year period (2002–09) were C4, thus highlighting how influential unstructured refuges can be in producing (presumably) Bt-susceptible moths within cotton production landscapes. Our latest study now reiterates that earlier finding, with overall (across the three regions studied) 58% of the H. armigera moths being C4. However, unstructured refuges have thus far featured little in the modelling of Bt resistance development and its management in Australia. This has arisen, at least in part, because such refuges are difficult for the cotton industry to rely on from 1 year to the next and the possibility existed that the timing of Helicoverpa moth production from them may not be in concert with that from cotton crops (Downes et al., Reference Downes, Parker and Mahon2010b, Reference Downes, Kriticos, Parry, Paull, Schellhorn and Zalucki2017; Ceeney et al., Reference Ceeney, Schellhorn and Ives2015; Ives et al., Reference Ives, Paull, Hulthen, Downes, Andow, Haygood, Zalucki and Schellhorn2017). Now that their numerical contribution to populations within landscapes is better appreciated, perhaps it is time to redress this issue more, at least for the regions studied here.
Baker et al. (Reference Baker, Tann and Fitt2011) noted that female H. armigera and H. punctigera moths, when collected in light traps in the Namoi Valley, contained average numbers of 0.7 and 1.0 spermatophores respectively, with 56% of female H. armigera and 35% of female H. punctigera unmated. Maturity (% gravid females) varied throughout the season (October–April), peaking at 50–60% during January. Higher levels of maturity (60–80%) were recorded in this study, and spermatophore counts were also higher (a little more than 2 per moth on average), with similar proportions of female H. armigera and H. punctigera moths unmated (both approximately 9%). Reasons for the shift in mating status between these two studies are not understood. In further contrast, Coombs et al. (Reference Coombs, Del Socorro, Fitt and Gregg1993) reported that the vast majority of female H. armigera and H. punctigera moths caught in tower-mounted light traps on mountain-tops in northern New South Wales were reproductively immature and unmated. They argued that these were long-distance migrants undertaking pre-reproductive dispersal (see also Riley et al., Reference Riley, Reynolds, Smith, Edwards, Zhang, Cheng, Wang, Cheng and Zhai1995 and Zhao et al., Reference Zhao, Fu, Ali, Wilson and Wu2016 for similar comments for other moth species). That, in turn, suggests that most of our moths (2012–15) were probably not very recently arrived migrants. That is not to say, however, that they were not migrants per se.
Being a perennial plant, cotton has an indeterminate growth habit, which means it is capable of developing flowers and fruit over an extended period, particularly under irrigation (CottonInfo Team, 2016). However, January is usually regarded as peak flowering time in southern Qld and northern NSW. Helicoverpa moths generally prefer to oviposit on plants that are flowering and fruiting (Zalucki et al., Reference Zalucki, Daglish, Firempong and Twine1986; Fitt, Reference Fitt1989; Fitt & Cotter, Reference Fitt, Cotter and Sharma2004; Luong et al., Reference Luong, Downes, Cribb, Perkins and Zalucki2016). The peaks in egg lays (and the slight variations therein) we observed within and between the three regions studied presumably reflected the prevalence of cotton flowering and fruiting then, as well as the prevailing weather influencing moth flight. However, the general consistency of patterns in egg abundance across sub-regions within each of the Maranoa, D. Downs and L. Namoi was in concert with our separate observations of similarities in the plant host origins of moths (albeit measured at a coarse C3/C4 level) across the same scales. In both cases, differences only became obvious at the regional scale.
In conclusion, it is clear that unstructured refuges can contribute substantially to the populations of Helicoverpa moths found within cotton production regions. But, the host plant origins of these moth populations do not necessarily reflect the composition of the host crop communities they are found within. Further research is needed to clarify which plants amongst the unstructured refuges are most important as hosts of Helicoverpa, and the scales of moth movement from such origins, to better inform Bt resistance management.
Supplementary material
The supplementary material for this article can be found at https://doi.org/10.1017/S0007485318000214
Acknowledgements
This research was funded by the Cotton Research and Development Corporation. The authors especially thank Jo Richards for excellent technical assistance and Sharon Downes for comments on a draft manuscript. Cate Paull kindly provided moth specimens from the Darling Downs in January 2013 and Sharon Downes provided access to unpublished data of laboratory rearing results of field-collected Helicoverpa eggs. The authors also thank many cotton growers who provided access to their properties and industry agronomists and consultants for much information that guided our activities.


