


Introduction
The Asian long-horned beetle (ALB), Anoplophora glabripennis (Motschulsky) (Coleoptera: Cerambycidae: Lamiinae), is a wood-borer that is native to parts of Asia (Cavey et al., Reference Cavey, Hoebeke, Passoa and Lingafelter1998; Carter et al., Reference Carter, Smith, Turgeon and Harrison2009b). In China, ALB is a destructive pest of manmade forests and windrows, which consist of one to several tree species and shelter urban, rural, and agricultural areas from sandstorms, while also providing local resources for timber and paper products (Uchida et al., Reference Uchida, Xu and Rozelle2005). ALB attacks and kills healthy poplar trees, as well as ash, birch, elm, maple, golden rain, hackberry, horse chestnut, London plane tree, and willow. Currently, there are no effective control methods for treating infested trees. Removing trees and destroying them by chipping and burning remains the only practical means of eliminating ALB.
ALB is widely distributed in China, and Anoplophora nobilis (Ganglbauer) displays the same morphology, although there is variation in the color of the elytral spots (Luo et al., Reference Luo, Huang, Zhao and Li2000). Micro-morphology and molecular markers (RAPD: random amplified polymorphic DNA) have suggested that ALB and A. nobilis are different subgroups within the same species (Lingafelter & Hoebeke, Reference Lingafelter and Hoebeke2002; An et al., Reference An, Wang, Yang, Lin, Chen, Huang and Victor2004; Tang et al., Reference Tang, Zheng and Li2004). Moreover, mitochondrial DNA (mtDNA) cytochrome oxidase I (COI) sequences are conserved in the ALB complex (An et al., Reference An, Wang, Yang, Lin, Chen, Huang and Victor2004). To date there has been no research on this species’ evolutionary history. Therefore, elucidating the population genetic structure of ALB will help clarify mechanisms of differentiation within this species complex.
Simple sequence repeats (SSRs) or microsatellites, are co-dominant markers that, are abundant in many genomes. Furthermore, they are reproducible, highly polymorphic, and show Mendelian inheritance. The genomic profusion of SSR makes them a powerful tool for a number of diverse applications in population genetics and molecular ecology (Jordan et al., Reference Jordan, Singh, Choudhury, Singh, Kumar, Srinivasan, Tyagi, Singh and Singh2013).
Conventional techniques for isolating SSR loci for a new species have been very labor-intensive, time consuming, and expensive. Hence, only 15 ALB SSRs have been published and all have di-nucleotide motifs (Carter et al., Reference Carter, Casa, Zeid, Mitchell and Kresovich2009a). Progress in population genetics has been hampered owing to the lack of effective molecular markers. Most researches focused on regional invasion (Carter et al., Reference Carter, Smith, Turgeon and Harrison2009b, Reference Carter, Smith and Harrison2010). The RAPD method and mtDNA have been used to study patterns of relatedness among beetles in China with limited populations and primers (An et al., Reference An, Wang, Yang, Lin, Chen, Huang and Victor2004; Tang et al., Reference Tang, Zheng and Li2004).
Conventional techniques for isolating SSR loci are labor-intensive, time consuming and expensive. However, data originating from whole-genome sequencing, combined with powerful bioinformatics tools, allow the mega-identification of new SSR loci (Gupta et al., Reference Gupta, Rustgi, Sharma, Singh, Kumar and Balyan2003; Victoria et al., Reference Victoria, Maia and Oliveira2011).
In this study, we identify additional polymorphic SSR markers from whole genome shotgun sequences in ALB and also evaluated their effectiveness for the analysis of genetic diversity between ALB and A. nobilis. Our objective is to develop more SSR loci to investigate genetic relationships and microevolution in the ALB complex.
Materials and methods
Materials and DNA extraction
A set of 88 ALB individuals collected from various places in China from July to August in 2013–2014 was used to screen for polymorphic SSR markers (table 1). All samples were collected and preserved in 100% ethyl alcohol, which was replaced every other day to ensure complete dehydration and DNA preservation, before being frozen in a −80 °C ultra-low-temperature freezer. Total genomic DNA was extracted from thoracic muscle tissue using the EZgene™ 80 Insect gDNA Miniprep Kit (BIOMIGA, San Diego, CA, USA).
Table 1. Sample information of A. glabripennis and A. nobilis.
SSR mining and analysis
Combined with biological data generated from whole-genome sequence initiatives, bioinformatics tools can be used to efficiently identify SSR loci. We chose SSRLocator because it provides an interface for Windows users, the primers can be designed for each locus that is found, and one can perform polymerase chain reaction (PCR) simulations, amplifying fragments with different primer pairs from a given set of FASTA files. SSRLocator is publicly available at http://www.ufpel.edu.br.
Whole-genome shotgun sequencing data for ALB were downloaded from GenBank (SRS463194), and SSR density and abundance were investigated using the SSRLocator software. The analysis was performed following the search parameters for repetitive elements in class I (≥20 base pairs [bp]), which have been described as more efficient molecular markers (Temnykh et al., Reference Temnykh, DeClerck, Lukashova, Lipovich, Cartinhour and McCouch2001). Unit size/minimum number of repeats were defined as 2/10, 3/7, 4/5, 5/4, and 6/4, and the maximum length of interruption between adjacent SSR was set to 5 bp.
The expected PCR product size of the markers was set to 100–300 bp, GC content of 30–70% and the primer size was set to 18–24 bp with optimal 20 bp. The annealing temperature was set to 57–64 °C with optimal 60 °C, and the difference in annealing temperature in one pairwise primer was <4 °C. The M13 tail (sequence: TGTAAAACGACGGCCAGT) was added to the 5′ end of each forward primer (Schuelke, Reference Schuelke2000) and labeled with the following three dyes: ROX (red), FAM (blue), and HEX (green).
PCR amplification and gel electrophoresis for screening the designed SSRs
In all, 48 pairs of SSR primers chosen randomly from our database were developed by SSRLocator. We used a three-step procedure to screen the primers: first, the primers were screened in eight individuals, then in 48 individuals belonging to a single geographic population, and finally in other 32 individuals from three geographic populations.
Eight samples from three geographic populations (two from the YC population, three from HB, and three from BD) were used for the initial test of primer polymorphism. PCR amplification was performed using 15 µl reaction mixtures containing 0.4 µl genomic DNA, 7.5 µl Taq master mixture, 0.1 µM forward primers, 0.1 µM reverse primers, and 6.5 µl ddH2O. The PCR protocol used was as follows: initial denaturation for 5 min at 95 °C, ten cycles of denaturation for 30 s at 95 °C, annealing for 30 s at 61–56 °C (touchdown PCR, 0.5 °C/cycle), and extension for 1 min at 72 °C; this was followed by 30 cycles of denaturation for 30 s at 95 °C, annealing for 30 s at 56 °C, and extension for 1 min at 72 °C, with a final extension for 10 min at 72 °C and a 10 °C holding temperature. SSR fragments were separated using 6% polyacrylamide gel electrophoresis and visualized by ethidium bromide staining. Primer pairs that amplified PCR products in fewer than six individuals, or produced smears or multiple bands, were discarded.
Next, 48 individuals from Jiuquan, Gansu, were selected. Fluorescently labeled (FAM, HEX, and ROX) M13 was added to the 5′ end of candidate forward primers following the methods of molecular cloning (Green & Sambrook, Reference Green and Sambrook2012). The PCR reaction cocktail contained three primers (0.04 µM forward primer, 0.16 µM reverse primer, and 0.32 µM labeled M13 primer) and sterile water added to a total volume of 10 µl. The PCR protocol was piloted at 95 °C for 5 min, followed by 30 cycles of 95 °C for 30 s, at the optimal annealing temperature (56 °C) for 30 s, and 72 °C for 60 s; this was followed by ten cycles of 95 °C for 30 s, 53 °C for 30 s, and 72 °C for 60 s, with a final extension of 72 °C for 20 min. Amplified PCR fragments were analyzed using the ABI 3730xl DNA Analyzer (Applied Biosystems) with the GeneScan 500 LIZ size standard (Applied Biosystems). Microsatellite genotypes were obtained using the software GeneMarker version 2.2.0.
Finally, 32 samples from three populations (LD, HEB, and BJ) were selected to investigate the genetic characteristics and consistent applicability between different sites of each primer. PCR reaction cocktails and protocols were as described in step 2.
Evaluation of SSR primers
Data analyses were performed in Popgene version 32 (Yeh et al., Reference Yeh, Yang, Mao, Ye and Boyle1999), including the estimation of the number of alleles per locus (N a), effective number of alleles (N e), probability of deviation from Hardy–Weinberg equilibrium (HWE) with Bonferroni test, and Shannon's Information Index (SI). Diversity statistics such as allele frequencies, observed heterozygosity (H o), expected heterozygosity (H e), and polymorphic information content (PIC) were calculated using the Microsatellite Tools (Park, Reference Park2001). Genepop version 4.0.11 (Raymond & Rousset, Reference Raymond and Rousset1995) was used to estimate fix fixation (F ST) and linkage disequilibrium among loci within each population. The LOSITAN program (Antao et al., Reference Antao, Lopes, Lopes, Beja-Pereira and Luikart2008) was used to detect putative loci under balancing, neutral, or positive selection.
Results
SSR identification and analysis
A total number of 91,083 reads accounting for 602 mega base pairs (Mbp) of raw data were obtained from the GenBank database. Read length varied from 53 to 415,372 bp, with a median length of 6614 bp. A total of 10,650 SSR (including 9895 perfect microsatellites, 92.91% of the total) were detected in the DNA sequences. Using the settings provided above for unit size/minimum number of repeats, 10,650 perfect SSR were identified from 91,083 reads, suggesting that every sequence possesses an average of 0.12 SSR. SSR density was determined to be one SSR per 56.57 kilo base pairs (kbp), and SSR abundance was determined to be 0.02/kb.
A total of 140 types of repeat motifs were found within the ALB genome. The SSR included 1349 (11.43%) di-nucleotide motifs, 3038 (25.73%) tri-nucleotide motifs, 4598 (38.95%) tetra-nucleotide motifs, 1834 (15.54%) penta-nucleotide motifs, and 986 (8.35%) hexa-nucleotide motifs (fig. 1). Twelve types of dinucleotide repeat motifs were found in the available transcript. We identified 30 trinucleotide motif types, among which the AAT/ATT, TAA/TTA, and ATA/TAT motifs were the most abundant, accounting for 23.07, 19.82, and 17.64% of occurrences, respectively. The CAC and CGC/GCG motifs were the least abundant (0.20%). The number of repeat units in di-, tri-, tetra-, penta-, and hexa-nucleotides ranged from 4 to 45, but the majority of SSR (67.15%) had four to nine repeat units (fig. 1).
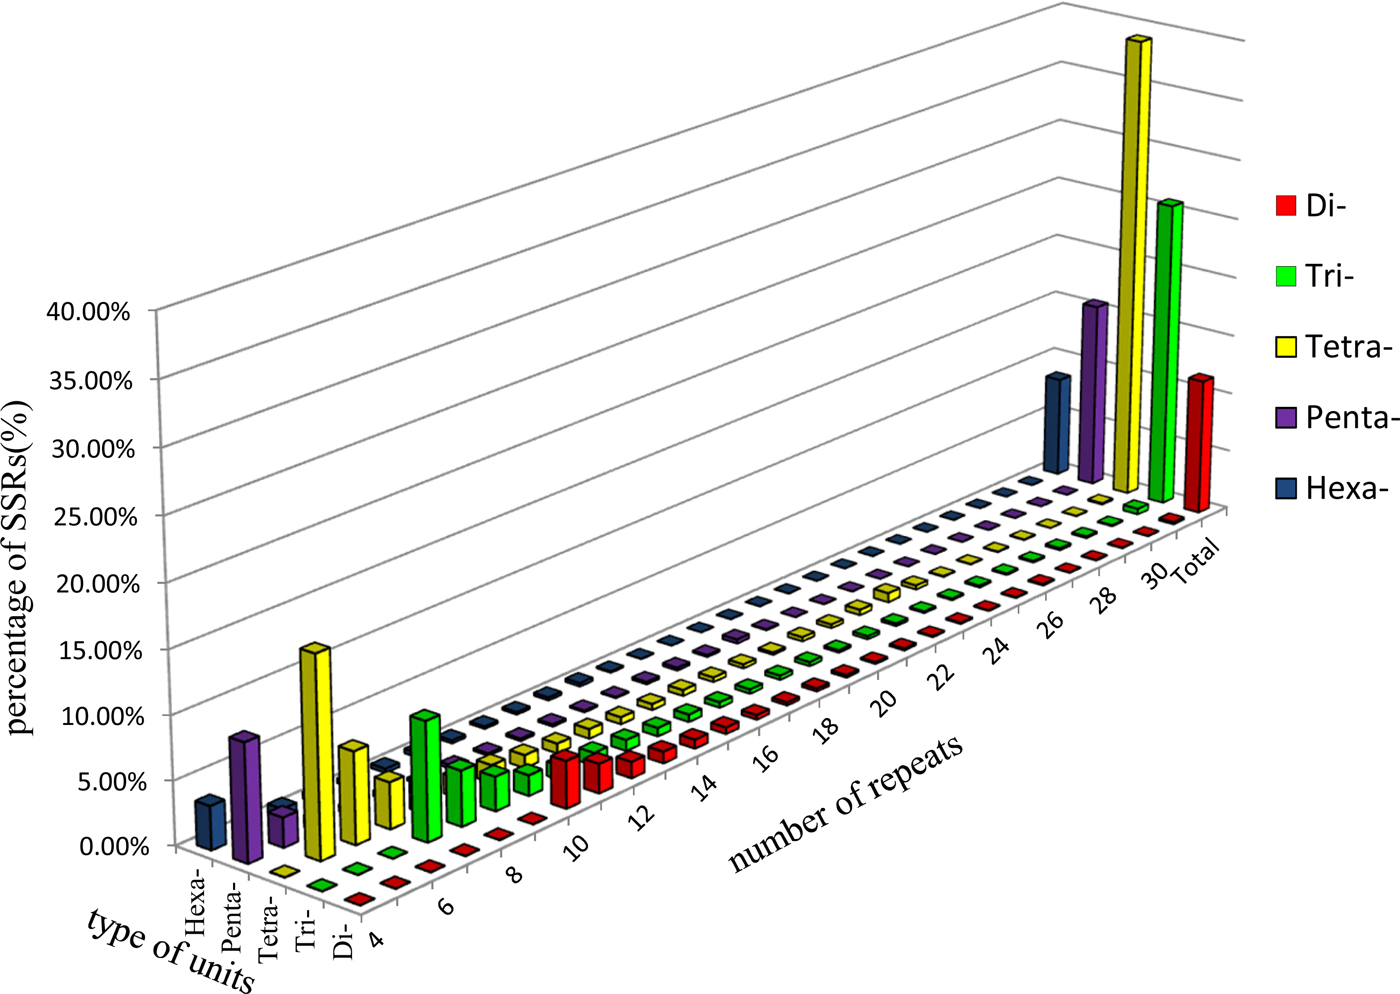
Fig. 1. Percentages of various unit types with different numbers of repeats in A. glabripennis. The di-, tri-, tetra-, penta-, and hexa- denote the corresponding nucleotide unit types of microsatellites.
The range of sequence lengths for ALB genomic-SSR was 20–180 bp, with an average length of 31.69 bp. Sequence length varied significantly among the various types of SSR. As sequence length increased, SSR abundance decreased; in other words, the greater the SSR sequence length, the lower the frequency of SSR.
SSR evaluation
In total, we designed 2621 SSR primers from the whole-genome of ALB. We selected 48 pairs (containing eight di-, 16 tri-, 8 tetra-, and 16-hexamer SSR randomly to test polymorphism.
Most genomic SSR selected were composed of tri-nucleotide or hexa-nucleotide repeats (table 2). According to the results of POPGENE for the 21 SSR (AGS02, AGS16, and AGS28 were discarded because their peaks were not stable by GENEMAPPER4.0), the observed number of alleles per locus (N a) ranged from 3 to 16 with a mean of 6.81 and the effective number of alleles per locus (N e) varied from 1.22 to 9.14 with a mean of 3.42. The PIC ranged from 0.17 to 0.88 with a mean of 0.61.
Table 2. Forward (F) and reverse (R) primer sequence, core motif, expected size, size range, optimized annealing temperature (T m), and sample size of 24 A. glabripennis microsatellite loci.
Genetic diversity was measured based on the PIC and the polymorphism rate (P). The polymorphism of a locus can be considered high, medium, or low if PIC > 0.5, 0.5 > PIC > 0.25, or PIC < 0.25, respectively (Xie et al., Reference Xie, Zhang, Cai, Liu and Peng2010). Our results indicated low polymorphism in AGS10 (0.17) and medium polymorphism in AGS05 (0.35), AGS08 (0.46), and AGS27 (0.40). The polymorphisms at the remaining loci were high. The average PIC value among all loci was 0.61, indicating the suitability of the markers for gene mapping, linkage analysis and genetic diversity studies.
The SI ranged from 0.43 to 2.44 with an average of 1.37. As an indicator of genetic diversity, the He ranged from 0.18 to 0.90 with an average of 0.67, while the H o ranged from 0.15 to 0.96 with an average of 0.53. Of 21 locus population combinations, six deviated significantly from HWE with sequential Bonferroni correction (table 3). Analyses carried out using GENEPOP software rejected the null hypothesis of HWE. According to LOSITAN results, three loci (AGS24, AGS26, and AGS45) were grouped into the candidate category for balancing selection, and the remainder fell into the neutral category (fig. 2).
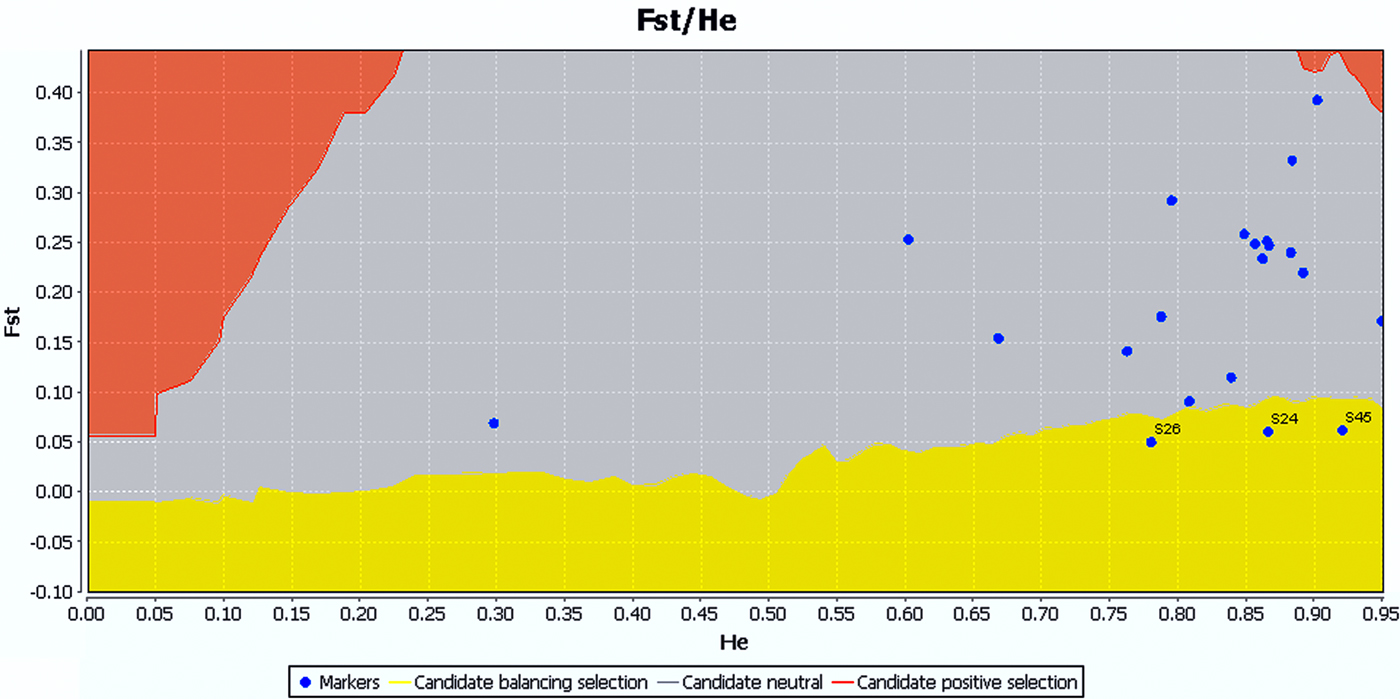
Fig. 2. LOSITAN results for 21 loci across samples of A. glabripennis. The results were the same under the infinite alleles model (IAM) of mutation and stepwise mutation model (SMM). Loci located in the red region are candidates for positive selection, yellow for balancing selection, and gray for neutral.
Table 3. Characteristics of 21 microsatellite loci isolated from A. glabripennis.
Observed number of alleles (N a), effective number of alleles (N e), Shannon's Information index (SI), polymorphic information content (PIC), expected (H e) and observed (H o) heterozygosity, and genetic deviation index of Hardy–Weinberg (d), fixation index (F is). ** and * indicate significant (p < 0.01, 0.05) departure from likelihood ratio test for HWE; Null, null allele frequency.
Nei's genetic distances calculated among four populations are ranged between 0.0747 and 0.2589 (table 4). The genetic distance between HEB and BJ (0.0747) is the smallest followed by that between JQ and LD (0.1650). HEB and LD is the largest (0.2589) followed by that between BJ and LD (0.2181). It indicates that the ALB populations in different areas share the more common genotype and these SSR markers could distinguish geographic populations. ALB populations (HEB and BJ) and A. nobilis populations (JQ and LD) are obviously separated, for example the genetic distance between LD and HEB (0.2589) is larger than that between LD and JQ (0.1650). The genetic distance between LD and JQ (0.1650) is substantially larger than that between HEB and BJ (0.0747). This suggests that there is less gene flow between LD and JQ, so that they are more differentiated. These facts indicate that these markers could be used in follow-up studies about the microevolution in ALB complex (table 5).
Table 4. Geographical distance (above the diagonal) and Nei's genetic distances (below the diagonal) in four populations of Anoplophora complex in China.
Table 5. Null allele frequencies in four populations of Anoplophora complex in China.
Discussion
Increase SSR markers
It has been difficult to develop SSR markers for Lepidoptera and Coleoptera using traditional methods (Meglecz et al., Reference Meglecz, Petenian, Danchin, D'Acier, Rasplus and Faure2004; Arthofer et al., Reference Arthofer, Schlick-Steiner, Steiner, Avtzis, Crozier and Stauffer2007; Stoeckle & Kuehn, Reference Stoeckle and Kuehn2011; Jingtao et al., Reference Jingtao, Xianming and Cheng2012). Using whole-genome sequencing data and the methods described above, we were able to efficiently evaluate ALB SSR loci. Polymorphic SSR markers play an important role in research on genetic diversity, population genetics, genetic linkage mapping, comparative genomics and trait-association analysis.
The repeat number of different motifs in SSR sequences varied from 4 to 45 and was unevenly distributed. In the arthropod genome, most SSR loci (30–67%) are dinucleotide repeats; conversely, in the present study trinucleotide repeats accounted for 38.95% of SSR, while the (AC/TG) motif was the most common dinucleotide repeat (No. = 269, 19.94%). These results are inconsistent with Tóth's survey of arthropod species (Toth & Gaspari, Reference Toth and Gaspari2002), which could be the result of setting harsh search parameters for SSR loci (Unit size/minimum number: 2/10, 3/7, 4/5, 5/4, 6/4). In general, A and T were predominant in di-, tri-, tetra-, penta-, and hexa-nucleotide repeat units, whereas C and G repeats were very rare. This is consistent with the results of previous studies (Zhu et al., Reference Zhu, Wu and Yang2013).
Development of microsatellite markers
Extrapolating from these results, we should expect approximately half (1310) of the 2621 total pairs to be polymorphic. Within successful primer pairs, 21 (43.75%) of the 48 randomly selected amplicons were polymorphic. Compared with conventional methods for developing SSR markers, we developed a rapid and efficient method (Powell et al., Reference Powell, Koput and Smith-Doerr1996; Kalia et al., Reference Kalia, Rai, Kalia, Singh and Dhawan2011). The failure of primer pairs to produce amplicons may be attributable to the primers being chimeric or located across splice sites, or to low-quality sequences. In all, 19 pairs of primers amplified fragments of 100–300 bp in length. The deviation of one primer pair (AGS38) from the expected size may have been due to the presence of introns, large insertions, mutation in flanking sequences, or even assembly errors (Saha et al., Reference Saha, Mian, Eujayl, Zwonitzer, Wang and May2004; Varshney et al., Reference Varshney, Graner and Sorrells2005).
Our results suggest that the whole-genome sequences were of high quality and the SSR identified in our dataset are suitable for use in future studies. Among the SSRs in our dataset, the mean number of alleles per locus was 6.81. The PIC values ranged from 0.17 to 0.88 (mean: 0.61), indicating that the level of polymorphism of SSRs was relatively high (PIC > 0.5). Among the 48 loci, 21 (43.75%) were polymorphic. Heterozygote deficiency existed in this population, with a mean heterozygote deficiency index of −0.26. Our results can be used for further population genetics studies of ALB, and may also aid in the development of SSR markers for other Coleoptera. Compared with conventional approaches, our method of developing SSR reported led to more highly polymorphic markers. The cause of these significant linkage disequilibrium needs more further research. According to genetic distances, these SSR markers are applicable to not only for ALB, but also for A. nobilis.
In summary, this study provides valuable insights into the properties and patterns of SSR markers. The markers identified are an important asset for in ALB population genetic studies and microevolution with A. nobilis.
Acknowledgements
This work was financially supported by The National Natural Science Foundation of China (Grant no. 31300546) and Graduate Training and Development Program of Beijing Municipal Commission of Education (BLCXY201503). We would like to thank Lijun Cao for their contributing to this study.


