Introduction
A key component that determines the dynamics of host–parasitoid interaction is the variability of parasitism risk among hosts (Chesson & Murdoch, Reference Chesson and Murdoch1986; Ives, Reference Ives1992; Taylor, Reference Taylor1993). Aggregation of parasitism risk induces pseudointerference that is a form of negative density-dependence among parasitoids (Free et al., Reference Free, Beddington and Lawton1977). In pseudointerference, the number of hosts parasitized by a parasitoid is not influenced by the presence of other parasitoids (e.g., parasitoids do not actively interfere with each other as in mutual interference). Nevertheless, negative density-dependence can emerge because, especially for solitary parasitoids, an effort that resulted in superparasitism is discounted or wasted (but see van Alphen & Visser, Reference van Alphen and Visser1990), which can increase with parasitoid density. Even though pseudointerference can operate by chance when all hosts experience the same degree of parasitism risk, the strength of pseudointerference is enhanced when there is heterogeneity in host accessibility (e.g., easily accessible hosts experience high parasitism risk).
A number of factors can induce heterogeneity in parasitism risk among hosts. Among the often considered is patchily distributed hosts and parasitoids. Under this scenario, hosts in patches with high parasitoid densities would experience a greater risk of parasitism than hosts in patches with low parasitoid densities (e.g., for parasitoids, hosts in the same patch are easily accessible). While the patchy environment scenario is extensively considered both theoretically and empirically (e.g., May, Reference May1978; Pacala et al., Reference Pacala, Hassell and May1990; Pacala & Hassell, Reference Pacala and Hassell1991), relatively little is known about variability in parasitism among hosts within a patch although within-patch characteristics (e.g., edge vs. interior of a patch) can also induce heterogeneity in parasitism risk (Cronin, Reference Cronin2003). The lack of understanding of within-patch variability is a problem because both within-patch variability and among-patch variability influence the total variability realized in a community, and two types of variability (within vs. among patches) influence host-parasitoid dynamics differently (Gross & Ives, Reference Gross and Ives1999).
A standard assumption is that all hosts within a patch experience the same parasitism risk, which leads to a Poisson-distributed parasitism (Rogers, Reference Rogers1972; Hassell & May, Reference Hassell and May1973). Experimental studies use the expected number of parasitized hosts derived from the Poisson model and characterize functional responses based on dichotomous data (a host is either parasitized or not) (e.g., Zamani et al., Reference Zamani, Talebi, Fathipour and Baniameri2006; Xu et al., Reference Xu, Yang, Duan and Wan2016). Because the focus of those studies is on the expectation, variability in parasitism (e.g., superparasitism) is usually not incorporated in determining functional responses. On the contrary, studies on superparasitism generally focus on factors that influence the average rate of superparasitism (e.g., Díaz-Fleischer et al., Reference Díaz-Fleischer, Galvez and Montoya2015; Chen et al., Reference Chen, Wong and Stansly2016) and cues used by parasitoids for host selection (e.g., Hubbard et al., Reference Hubbard, Marris, Reynolds and Rowe1987; Outreman et al., Reference Outreman, Ralec, Plantegenest, Chaubet and Pierre2001). Consequently, little is understood about the validity of the Poisson model in describing the within-patch variability of parasitism that the results of many theoretical and empirical studies depend upon.
This study examined the distribution of parasitism among hosts by using the commonly assumed Poisson model as the reference. Although the model is typically used to make dichotomous predictions, it makes explicit predictions about superparasitism that can be quantitatively tested (further described below). The host and parasitoid species considered are the oriental fruit fly, Bactrocera dorsalis (Diptera: Tephritidae), and Dirhinus giffardii (Hymenoptera: Chalcididae), respectively. D. giffardii is a pupal parasitoid of B. dorsalis which pupates in the soil. D. giffardii burrows into the ground to parasitize pupae. Because of these characteristics, the effect of pupation depth on the distribution of parasitism as well as a factor that influences pupation depth were examined.
Materials and methods
Insects
The oriental fruit fly B. dorsalis and the parasitoid D. giffardii used in the study were obtained from populations maintained in the laboratory for general purposes (e.g., not only for the current study). Insects were initially obtained from the Agricultural Research and Extension Station in Miaoli, Taiwan, to start up the laboratory colonies as follows. B. dorsalis adults are housed in 60 cm3 cages containing water, sugar, and a mixture of sucrose, yeast powder and peptone (6:1:1 ratio by weight, respectively). Eggs are harvested in adult cages and are transferred to cups containing an artificial diet that is a mixture of wheat bran, sugar, yeast, citric acid, and water with a ratio of 25:10:5:1:50 by weight. Hatched larvae grow and eventually leave the diet cups to pupate. Pupae are transferred back to the adult cages. D. giffardii is housed in 30 cm3 cages containing water and sugar. B. dorsalis pupae are regularly provided to cages containing D. giffardii.
Pupation depth
The pupation depth of B. dorsalis larvae was examined. Adult females lay eggs in fruits. After developing inside fruits, larvae leave the fruits for pupation which takes place under the ground. To reduce variation in the condition for larval development, a small plastic cup (3.4 cm diameter bottom and 4 cm diameter opening; 2.1 cm height) partially filled with 11 g of the artificial diet was used as the environment for larval growth. Three levels of egg density were established: one egg, ten eggs, and 100 eggs (per cup). Eggs that were laid within 4 hours were placed on the surface of diet. Ten replications were conducted for one egg and ten eggs groups. Eleven replications were conducted for 100-egg group.
A larger cup (8.5 cm diameter bottom; 10.8 cm diameter top; 11.3 cm height) filled to 8.5 cm with peat moss (Cultural®; Euflor, Munich, Germany) was used as the environment for pupation. Peat moss was first shifted with 1.5-mm nylon mesh and then dried in an oven (50°C for 7 days). When used in a trial, a mixture of 90 g of dried peat moss and 90 ml of water was placed in a cup. Peat moss prepared with this method was used throughout this way. A small cup containing diet and eggs (described above) was placed on the surface of peat moss inside a larger cup, and the opening of the larger cup was closed with a mesh lid. When larvae were ready to pupate, most larvae climbed out the small cup and pupated in the peat moss. Larvae can easily climb the wall of a cup, but some larvae pupated within the artificial diet for an unknown reason (described in Results below). The pupation depth of each pupa was recorded 12–15 days after the introduction of eggs. Pupae were excavated using a spoon spatula, removing a small amount of peat moss at a time. Because measuring pupation depth with an accuracy of mm was logistically difficult, pupation depth was categorized into five levels: 0–1 cm, 1–2 cm, 2–3 cm, 3–4 cm, and 4–5 cm. Although the maximum possible depth (i.e., the total depth of peat moss) was 8.5 cm, no individuals pupated below 5 cm from the surface, indicating that the depth limitation due to the cup size did not limit pupation depth.
Parasitism distribution
Only 2-day-old pupae were used in this experiment because the parasitism rate differs by hostage due to the host selection behavior of the parasitoid (Wang & Messing, Reference Wang and Messing2004; Naveed et al., Reference Naveed, Suhail, Ahmad, Rauf and Akbar2014). A plastic cup (5.9 cm diameter bottom and 6.75 cm diameter opening; 4.7 cm height) was filled with peat moss (total depth of 4 cm). The density and depth of pupae were manipulated by placing pupae and covering them with peat moss. Three levels of depth (0 cm, 1 cm, and 2 cm), and three levels of density (10, 20, and 30 pupae) were examined. For example, ten pupae with 0 cm depth indicate that ten pupae were placed on the surface of peat moss. All possible combinations were examined, with three to four replications for each combination totaling 100 replications. A cup containing pupae was placed in the center of a 30-cm3 cage with nylon mesh netting (MegaView Science Co., Taichung, Taiwan), and 7-day-old female parasitoids were released. Three levels of parasitoid density (one, three, and five parasitoids per cage) were established to examine the effect of parasitoid density. Parasitoids and pupae were kept in the cage for 3 days. Water and sugar were provided to the parasitoids in separate cups (3.5 cm diameter bottom and 3.9 cm diameter opening; 2.2 cm height) in the cage. After trials, pupae were dissected and the number of parasitism events was recorded by counting the number of parasitoid eggs and larvae found within.
In addition, whether the presence of pupae at 0 cm influences parasitism of pupae at 1 cm depth was examined. The number of pupae at 1 cm was fixed at 30 pupae, and the number of pupae at 0 cm was varied as 0 (four replications), 15 (five replications), and 30 pupae (five replications). All other experimental details were identical to the experiment previously described.
Analysis
The effect of the density of conspecific on pupation depth was analyzed with a generalized linear mixed model (GLMM). A Poisson distribution was used to describe the discrete levels of pupation depth. A random intercept was used to describe the variation among trials. The effect of the fruit fly larval density, modeled as a fixed effect, was examined using a likelihood ratio test. Some individuals pupated within a diet cup, and those pupae were not included in the pupation depth analysis. The probability that a larva pupates in diet described by a binomial GLMM indicated that it was not influenced by conspecific density (likelihood ratio test, P = 0.54).
The Poisson-based parasitism model was used as the null model. In an experimental trial, when the number of host pupae is N and the number of parasitism events is Z, the average number of parasitism per host is Z/N. Here, the number of parasitism events is the total number of eggs laid and is not the number of pupae parasitized. For example, when there are three hosts (N = 3) and each host is parasitized two times (e.g., two eggs are found in each host), the number of parasitism events, Z, is 6. Under the Poisson model, the probability that a host is not parasitized is eZ /N. Generally, Z is modeled as gP where g is the functional response of the parasitoid, and P is the parasitoid density. When the parasitoid has a type I functional response (g = aN), the model becomes the one used in the Nicholson–Bailey model (Nicholson & Bailey, Reference Nicholson and Bailey1935). More generally, when Y is the random number that describes the number of parasitism for a pupa, the probability distribution is the standard Poisson distribution,
 $$P\lpar {Y = y} \rpar = {e}^\lambda \displaystyle{{\lambda ^y} \over {y!}}$$
where λ = Z/N is the expected value for Y. As described above, this result leads to P(Y = 0) = e Z/N, but it also makes predictions for the probability of any arbitrary levels of parasitism such as P(Y = 1) and P(Y = 2). In particular, the probability of superparasitism P(Y ≥ 2) = 1 − P(Y = 0) − P(Y = 1) can also be obtained from equation (1).
To compare observed patterns of parasitism against the expectation from the model, three categories of parasitism were examined for each pupa: (1) no parasitism, (1) single parasitism (i.e., exactly one egg was laid), (2) superparasitism (i.e., two or more eggs were laid). When X i is the random variable that describes the number of no parasitism (i = 0), single parasitism (i = 1), and superparasitism (i = s) in an experimental trial, data should follow,
 $$X_i\; \sim \; {\rm Binomial}\,(N,p_i)$$
where p 0 = P(Y = 0), p 1 = P(Y = 1), and p s = 1 − p 0 − p 1 from equation (1). This model has no free parameters to be estimated. To test the validity of the model, an alternative model,
 $$X_i\; \sim \; {\rm Binomial}\,(N,qp_i)$$
where q is a parameter to be estimated, was examined. When q = 1, it follows the original model. Therefore, examining for the condition q = 1 tests whether the observed data follows the model prediction. In particular, when q > 1, it indicates observed parasitism is greater than expected. When q < 1, observed parasitism is less than expected. The null hypotheses q = 1 was examined with likelihood ratio tests.
As it will be shown below, many trials resulted at 0 parasitism when pupae were at 2 cm depth. When there is no parasitism, expected and observed proportion of parasitism perfectly match. Therefore, this part of the analysis only used trials that resulted in at least one pupa was parasitized. Because there were few trials that had any parasitism, data from 2 cm depth were not included.
The effect of pupae at 0 cm on parasitism of pupae at 1 cm was examined by a binomial generalized linear model with a logit link function. The number of pupae at 0 cm was used as the explanatory variable, and its significance was examined with a likelihood ratio test.
Results
The average pupation depth increased with the density of conspecifics (fig. 1; likelihood ratio test, P = 0.0425). When there was only one larva, most individuals pupated near the surface (within 1 cm depth) whereas most individuals pupated deeper than 1 cm when density was either ten or 100 larvae.

Fig. 1. Pupation depth of Bactrocera dorsalis. Depth categories (horizontal axis): 0 (0–1 cm), 1 (1–2 cm), 2 (2–3) cm, 4 (4–5 cm). Proportions were computed by combining all data excluding larvae that did not pupate in peat moss. Error bars show the standard errors of multinomial proportions.
The number of parasitized pupae increased with the number of pupae and the number of wasps (fig. 2). When the depth of pupae was 2 cm, parasitism rate was low, and many trials resulted in no parasitism (of total 33 trials, no pupa was parasitized in 28 trials).

Fig. 2. Number of parasitized pupae from various treatment combinations. Pupae parasitized once and more than once are not distinguished in this figure. P indicates the number of parasitoids.
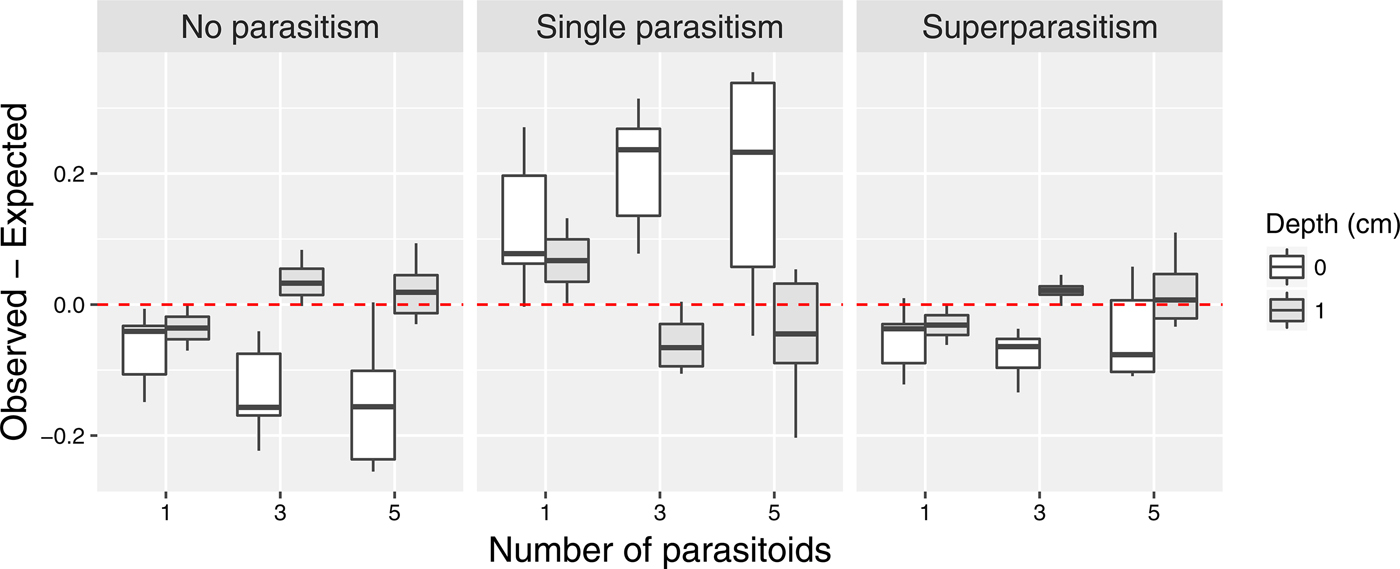
The distribution of parasitism differed by depth (fig. 3). When pupae were at 0 cm depth, more than expected proportion of pupae were parasitized exactly once (q = 1.62, likelihood ratio test, P ≈ 0), whereas less than expected proportion of pupae experienced no parasitism (q = 0.79, likelihood ratio test, P = 2.53 × 10⁻⁸) and superparasitism (q = 0.7, likelihood ratio test, P = 1.14 × 10⁻⁵). However, it is important to note that because of the probability constraint (i.e., p 0 + p 1 + p s = 1), it is impossible to observe greater than expected parasitism for all types simultaneously, and thus these results should not be independently interpreted. When pupal depth was 1 cm, observed parasitism was not significantly different from the Poisson expectation for all three cases (likelihood ratio test, P > 0.05 for all).

Fig. 3. Difference between the observed and expected probability of parasitism. The expected values were based on the Poisson model. When the difference is positive, it indicates that the observed value is greater than the expected value.
Parasitism rate of pupae at 1 cm depth was influenced by the presence of pupae at 0 cm (fig. 4). Regardless of analyzing data for the total parasitism (e.g., parasitized at least once) or superparasitism (parasitized at least twice), the presence of pupae at 0 cm decreased the parasitism rate (likelihood ratio test, P = 4.68 × 10⁻¹³ [total parasitism] and P = 1.03 × 10⁻⁷ [superparasitism]). The proportion of pupae parasitized for pupae located at 0 cm was 0.65 and was not influenced by the number of pupae (likelihood ratio test, P = 0.84).

Fig. 4. Relationship between the number of parasitized pupae that are located at 1 cm depth and the number of pupae located at 0 cm. Pupae that are parasitized two or more times indicate superparasitism.
Discussion
Both the rate and distribution of parasitism varied by the depth of pupae. Parasitism rate was higher for pupae on or near the surface. The distribution of parasitism on pupae at 0 cm (on the surface) was different from the random (Poisson) expectation. In particular, the more than expected proportion of pupae on the surface were singly parasitized. On the contrary, observed and expected parasitism did not significantly differ for pupae at 1 cm depth. Lastly, pupae experienced weakened parasitism risk when there were other pupae directly above them. These results indicate that within-patch heterogeneity in parasitism risk is strongly influenced by factors that influence pupation depth.
The deviation from the random foraging model for pupae at 0 cm depth is likely due to selective foraging behavior of the parasitoid. D. giffardii evaluated host status and avoided superparasitism, which inflated the occurrence of single parasitism. On the contrary, parasitism on hosts at 1 cm depth followed the random foraging expectation, suggesting that host selection ability was impaired at 1 cm depth. Cues that are used by D. giffardii to distinguish unparasitized and parasitized hosts are not described, but perception of any cues that are known to be used by parasitoids for host selection (e.g., chemical, mechanical, and visual) (Vinson, Reference Vinson1976) can be influenced by the properties of soil (e.g., Eilers et al., Reference Eilers, Veit, Rillig, Hansson, Hilker and Reinecke2016).
Although the effect of soil properties on the ability of parasitoids to distinguish hosts remain to be tested, soil properties are known to be the primary factors that influence pupation depth of tephritid flies (Hennessey, Reference Hennessey1994; Jackson et al., Reference Jackson, Long and Klungness1998; Hou et al., Reference Hou, Xie and Zhang2006; Renkema et al., Reference Renkema, Cutler, Lynch, MacKenzie and Walde2011). In addition, this study revealed that conspecific density influences pupation depth. Both the mean and variance of pupation depth increased with conspecific density (fig. 1). Because deeply located hosts experience less parasitism risk than those at shallow depths (fig. 2), variation in pupation depth directly relates to variation in parasitism risk. Furthermore, this variation in parasitism risk is further strengthened because deeply located hosts enjoy reduced parasitism risk when there are other pupae at shallower depths (fig. 4).
The density-dependent pupation depth pattern may be explained by the density-dependent parasitism discussed above. Because pupae at deeper levels enjoy protection from pupae located shallower than them, it is advantageous for larvae to burrow deeper when they detect other conspecifics (larvae or pupae). In other words, a game theoretical interaction may be taking place (i.e., pupation depth depends on pupation depth of others). To test this hypothesis, an experiment may be conducted to examine whether the presence/absence of preexisting pupae (e.g., at 1 cm) influence the pupation depth of larvae introduced later. In addition, D. giffardii appears to detect pupae chemically as parasitism rate can be higher for a location with high pupal density (Okuyama, Reference Okuyama2016). Thus, individuals in a high-density aggregation also have the incentive to go deeper to deal with an increased parasitism rate.
This study showed that within-patch heterogeneity in parasitism risk is determined by a complex array of factors. Density-dependent pupation depth and depth-dependent parasitism can induce important heterogeneity in parasitism risk. Furthermore, the mechanism that produces density-dependence may arise from game theoretical interactions although further studies are needed to reveal the ultimate mechanism. However, in sum, the simple assumption that all hosts in the same patch experience the same parasitism risk would be invalid. Given the importance of heterogeneity in parasitism risk among hosts, future studies that describe parasitism patterns (e.g., functional response studies) should go beyond describing average parasitism rates and also document the distribution of parasitism to understand the nature of within-patch heterogeneity in parasitism risk.
Acknowledgements
Two anonymous reviewers provided valuable comments that improved the manuscript. Chih-Chung Lee collected data. This study was supported by the Ministry of Science and Technology with Grant 105-2311-B-002-019-MY3.