Introduction
A modified atmosphere (MA) with low oxygen (hypoxia) and high carbon dioxide (hypercapnia) at biologically achievable levels have been demonstrated to be cost-effective and environmental friendly in the control of stored product insects and to maintain grain quality. MA could be achieved biologically in a barn bio-system or storage container by purging with CO2 or N2 and then sealing it hermetically, resulting in the suppression of insect feeding, growth, development, population expansion, and reproduction (Cheng et al., Reference Cheng, Lei, Ahn, Wang, Lei and Zhu-Salzman2013; García-Lara et al., Reference García-Lara, Ortiz-Islas and Villers2013; Iturralde-García et al., Reference Iturralde-García, Borboa-Flores, Cinco-Moroyoqui, Riudavets, Del Toro-Sánchez, Rueda-Puente, Martínez-Cruz and Wong-Corral2016; Yan et al., Reference Yan, Williams, Baributsa and Murdock2016). Generally, an MA with hypoxia (<5% oxygen) and hypercapnia (7.5–19.2% carbon dioxide) have been successful for the control of some storage pests (Conyers & Bell, Reference Conyers and Bell2007; Azab et al., Reference Azab, Darwish, Mohamed and Sanad2013; Wong-Corral et al., Reference Wong-Corral, Castañé and Riudavets2013). However, many insect species from Coleoptera show high tolerance under similar situations, and they could even recover from hours to days of treatments. The physiological responses of the insects to MAs have been studied for years. As early as 1986, people had found that adults of Cryptolestes ferrugineus, Sitophilus granaries, Tribolium castaneum, and Oryzaephilus surinamensis could live under MA with low oxygen (1–1.6%) and increased carbon dioxide (10–30%) for nearly 7 days (Krishnamurthy et al., Reference Krishnamurthy, Spratt and Bell1986). In 1990, the hypoxia- and hypercapnia-selected T. castaneum was found to be capable of developing slowly under MAs (Donahaye, Reference Donahaye1990). Recently, 4th wild-type Callosobruchus maculatus instar larvae could recover to normal development from more than 20 days of exposure to hypoxia and hypercapnia (Cheng et al., Reference Cheng, Lei, Ahn, Liu and Zhu-Salzman2012). Although some remarkable observations have been made in recent years, the mechanism of insect tolerance to hypoxia and hypercapnia is not fully understood. For instance, a number of insects moderate ventilator responses (e.g., changes in spiracles opening, convective gas, and tracheoles fluid levels) for adequate oxygen to maintain aerobic metabolism under hypoxia in the short term (seconds–hours), leading to appropriate levels of internal Pco2 and pH. The concentration of carbon dioxide strongly affects the function of insect ventilation, and a fall in tracheal Pco2 reduces the ventilation rate (Emekci et al., Reference Emekci, Navarro, Donahaye, Rindner and Azrieli2002; Schmitz & Harrison, Reference Schmitz and Harrison2004; Matthews & White, Reference Matthews and White2011). An O2-sensing system, including soluble guanylyl cyclases (e.g., Gyc-89 Da, Gyc-89 Db, and Gyc-88E) acting as molecular O2 sensors, are critical for mediating behavioral responses to hypoxia (Vermehren-Schmaedick et al., Reference Vermehren-Schmaedick, Ainsley, Johnson, Davies and Morton2010). In the long-term (hours–days), insects change morphological responses, including changes in tracheoles, respiratory and open tracheal system (Wingrove & O'farrell, Reference Wingrove and O'farrell1999; Jha et al., Reference Jha, Zhou, Brown, Kreitman, Haddad and White2015). In these processes, the energy demand and metabolism rate in high hypoxia/hypercapnia-tolerant species (e.g., Drosophia and C. maculatus) was suppressed, shifting from aerobic to anaerobic metabolism, along with the changes in signal transduction (e.g., Notch, Toll/Imd, and Wnt pathways), cellular structure, and muscular contraction at the transcript level (Zhou et al., Reference Zhou, Horne, Damcevski, Haritos, Green and Singh2008b; Chi et al., Reference Chi, Ahn, Yun, Lee, Liu and Zhu-Salzman2011; Gersten et al., Reference Gersten, Zhou, Azad, Haddad and Subramaniam2014). Hypoxia-inducible factors (HIFs) are considered the key gene regulators. Under hypoxic conditions, HIFs would stimulate the expression of downstream genes related to immunity, apoptosis, development, stress responses and aging (Majmundar et al., Reference Majmundar, Wong and Simon2010).
Most of the previous researches have focused on the tolerance mechanism of insect under hypoxia, but fewer studies have investigated the response of insect under hypoxia/hypercapnia, let alone hypoxia/hypercapnia tolerant mechanism. C. maculatus larvae mortality was significantly increased when hypercapnia was added in hypoxia situation, but the larvae survived under hypoxia/hypercapnia grew faster than those under hypoxia only. As previously reported, hypercapnia decreased Drosophila resistance to bacterial infection by suppressing induction of specific antimicrobial peptides, but it does not induce a response characteristic of hypoxia, oxidative stress or heat shock, nor does it decrease a flies lifespan or cell viability (Helenius et al., Reference Helenius, Krupinski, Turnbull, Gruenbaum, Silverman, Johnson, Sporn, Sznajder and Beitel2009; Selfridge et al., Reference Selfridge, Cavadas, Scholz, Campbell, Welch, Lecuona, Colgan, Barrett, Sporn and Sznajder2016). The majority of metabolic genes in adult files under 13% CO2 for 24 h were up-regulated, while over half of fertility- and immune-related genes were down-regulated (Selfridge et al., Reference Selfridge, Cavadas, Scholz, Campbell, Welch, Lecuona, Colgan, Barrett, Sporn and Sznajder2016), which was contrary to the response of hypoxia-selected Drosophila (3rd larvae and adults) or C. maculatus larvae under 3% O2 + 17% CO2 for 24 h. Most of the commonly up-regulated genes were involved in immunity, and the down-regulated genes were involved in metabolism (Zhou et al., Reference Zhou, Xue, Lai, Schork, White and Haddad2008a; Chi et al., Reference Chi, Ahn, Yun, Lee, Liu and Zhu-Salzman2011). The transcript profile of Litopenaeus vannamei was altered under hypercapnia and hypoxic conditions, which showed the energetic cost for stabilizing translational machinery, mobilizing energy stores, and down-regulating ubiquitin/proteasomal degradation (Selfridge et al., Reference Selfridge, Cavadas, Scholz, Campbell, Welch, Lecuona, Colgan, Barrett, Sporn and Sznajder2016).
Adzuki bean weevil, Callosobruchus chinensis (Coleoptera: Bruchidae), one of the most important destructive Bruchids, causes severe damage to stored legume grains and mainly inhabits tropical and subtropical regions of the world (Tuda et al., Reference Tuda, Chou, Niyomdham, Buranapanichpan and Tateishi2005; Duan et al., Reference Duan, Li, Sun, Wang and Zhu2014; Kedia et al., Reference Kedia, Prakash, Mishra, Singh and Dubey2015; Duan et al., Reference Duan, Li, Zhu, Li, Sun and Wang2016). Previous studies have paid more attention to this pest control strategies of MA, but little is known about this mechanism of action (Mohapatra et al., Reference Mohapatra, Kar and Giri2015). According to our previous research, bean weevil shows high adaptability to hypoxia even hypoxia/hypercapnia (Cui et al., Reference Cui, Wang, Qiu, Liu and Geng2017). To further reveal bean weevil hypoxia and hypoxia/hypercapnia tolerance mechanism, we used NextSeq500 RNA-Seq to investigate the differences in gene expression profiles among 4th adzuki bean weevil larvae under hypoxia, hypoxia/hypercapnia and normoxia. Here, we supposed that hypercapnia not only enhanced effects of hypoxia on gene expression in bean weevil but also produced different results.
Materials and methods
Insect rearing and MA treatment
Adzuki bean weevils were maintained on Ormosia seeds at a density of two or three insects per seed in glass bottles in a normoxic climate box at 28 ± 1°C and 65% relative humidity under a 16 h:8 h light:dark photoperiod regime. We determined the developmental stages as previously described, using head capsule size as a standard (Cheng et al., Reference Cheng, Lei, Ahn, Liu and Zhu-Salzman2012). The developmental substages of egg, 1st, 2nd, 3rd, and 4th instar, pupae, and adult from egg lying was 4, 8, 12, 16, 21, 23 and 23.5 d, respectively. When the larvae reached the middle of the fourth instar stage (16 days old), 20 larvae with 10 infected seeds (two larvae per seed) were transferred to specifically designed flat-bottomed flasks, with an inlet rubber hose connected to a mixed air cylinder (2% O2 + 98% N2 [hypoxia, HA] or 2% O2 + 18% CO2 + 80% N2 [hypercapnia/hypoxia, HHA] and an outlet rubber hose connected to a bubbler with silicone oil), and the mixed gas needed to be pre-humidified to nearly 68% r.h. by passing through a bubbling container containing a saturated solution of potassium iodide. The mixed gas was delivered into the flasks from the inlet rubber hose controlled by a gas reducing valve and flowmeter until the air concentration of the flasks became stable, which was verified using a head space analyzer (58,143,389; Danensor-checkpoint; Hergesteilon); then, the pressure was regulated to 1 atm and the gas flow rate to 10 ml min−1. The pre-mixed gas was purchased in the form of pressurized cylinders from Shanghai He sheng Specialty Gases, and the concentration was verified (Donahaye & Navarro, Reference Donahaye and Navarro2000; Riudavets et al., Reference Riudavets, Castañé, Alomar, Pons and Gabarra2009; Cheng et al., Reference Cheng, Lei, Fox, Johnston and Zhu-Salzman2015). Control larvae were transferred to another flat-bottomed flask, then it was sealed with gauze to allow atmospheric air to diffuse, maintaining the concentrations of 20% O2 + 0% CO2 + 80% N2, 68% r.h in the phytotron. Each treatment group consisted of three replicates. Larvae were removed from the seeds 24 h later. Collected samples were immediately frozen in liquid nitrogen and stored at −80°C for later RNA extraction.
RNA extraction and cDNA library construction and sequencing
Nine samples from the HHA and HA treatments and the control were included. Each sample contained a pool of 20 4th instar larvae, homogenized together in a liquid nitrogen for total RNA extraction, and RNAiso Plus Total RNA extraction reagent (Takara Bio, Shiga, Japan) was used following the manufacturer's instructions. Residual genomic DNA was removed with an RNA clean RNA kit (Bioteck, Beijing, China) according to the manufacturer's instructions and then dissolved in RNase-free water. The integrity of the total RNA was measured using an Agilent 2100 Bioanalyzer system using the RNA 6000 Nano kit according to the manufacturer's protocols (Agilent Technologies, Palo Alto, CA, USA). The high-quality RNA (RIN values >9.0) was used to construct the cDNA library, which was sequenced using an Illumina instrument following the NextSeq500 RNA-Seq experimental procedure with a TruSeq RNA Sample Prep Kit (Illumina, San Diego, CA, USA).
Poly (A) mRNA was isolated from the total RNA and further purified by combining with oligo-dT magnetic beads. The mRNA was mixed with a fragmentation buffer to obtain 200–300 bp fragments, which were used as templates to synthesize first-strand cDNA with random primers, and double-strand cDNA was transformed from the first-strand cDNA using RNase H and DNA polymerase I. The double-strand cDNA fragments (200–300 bp) were purified using the QIA quick polymerase chain reaction (PCR) Extraction Kit (Qiagen, Valencia, CA, USA), end-repaired with 3′−5′ exonuclease and polymerase, and ligated with sequencing adapters through the A and T complementary base pairing. AMPure XP beads (Beckman Coulter, Shanghai, China) were used to remove unsuitable fragments, and the sequencing library was constructed by PCR amplification. To prevent an overestimation of the mRNA copy number, the cycle number of cDNA libraries was strictly controlled. The multiplexed cDNA libraries were checked using PicoGreen (Quantifluor™-ST fluorometer E6090; Promega, Madison, WI, USA) and fluorospectrophotometry (P7589 Quant-iT PicoGreen dsDNA Assay Kit; Invitrogen, Carlsbad, CA, USA) and quantified with the Agilent2100 Bioanalyzer and Agilent High Sensitivity DNA Kit (5067–4626). The synthesized cDNA libraries were normalized to 10 nM, diluted, quantified to 4–5 pM, and sequenced using the Illumina NextSeq™ 500 platform.
De novo transcriptome assembly and bioinformatics analysis
Raw reads from nine samples were collected and filtered by removing unsuitable reads as follows: adapter sequences with at least 10 bp overlap were removed using Cutadapt (ver. 1.2.1) (Martin, Reference Martin2011), and reads with low average quality (Q ≤20) or a final length <50 were trimmed off. The high-quality sequences were assembled into contigs and transcripts using Trinity (R20140717, kmer 25 bp) with the default parameters (kmer = 25 and minimum contig length = 48), and the longest transcript in each cluster was selected as unigenes for subsequent analyses (Altschul et al., Reference Altschul, Gish, Miller, Myers and Lipman1990; Haas et al., Reference Haas, Papanicolaou, Yassour, Grabherr, Blood, Bowden, Couger, Eccles, Li and Lieber2013). Unigenes were submitted to a TBLASTX search in the non-redundant (NR) protein database to identify homology. Annotations with E-values <10−5 were retained and the top-hit species were indicated. In addition to NR, the Evolutionary Genealogy of Genes, Non-supervised Orthologous Groups (eggNOG), and Gene Ontology (GO) databases were also used to identify homology, annotate the unigene distribution, and analyze biological behaviors, respectively (Ashburner et al., Reference Ashburner, Ball, Blake, Botstein, Butler, Cherry, Davis, Dolinski, Dwight and Eppig2000; Powell et al., Reference Powell, Forslund, Szklarczyk, Trachana, Roth, Huerta-Cepas, Gabaldón, Rattei, Creevey and Kuhn2014). The Kyoto Encyclopedia of Genes and Genomes (KEGG) database was also used for annotation and to certify the functions of the unigenes in metabolic pathways (Kanehisa et al., Reference Kanehisa, Goto, Kawashima, Okuno and Hattori2004). All sequences were mapped to unigenes using Bowtie (ver. 2.2.4, default parameters) (Langdon, Reference Langdon2015). The reads per kilobase per million mapped reads (RPKM) were normalized and identified using the DESeq 1.18 package in the R software, using an adjusted P-value of 0.05 as the threshold (Anders & Huber, Reference Anders and Huber2010). Genes with a relative RPKM ratio >2 or <0.5 and P < 0.05 were considered to be differentially expressed genes (DEGs). The Vann program was used to analyze the relationships of the genes in the different treatments to detect overlapping DEGs. The DEGs were also presented visually in Volcano Plot using the GGplot2 package in the R software. The enrichment analysis used to identify the functions of the DEGs was performed using GOSlim and the KEGG pathway database.
Identification of DEGs by q-PCR
Quantitative real-time PCR was performed using the total RNA extracted as described previously to confirm the expression of the putative DEGs from the transcriptome. cDNA was reverse-transcribed with 1 µg total RNA using a PrimeScript™ RT reagent Kit with gDNA Eraser (Takara Bio). Selected genes were amplified using a SYBR Premix Ex Taq™ II Kit (Takara Bio), the DyNNmo Flash SYBR Green qPCR Kit (Thermo Scientific, Rockford, IL, USA), and the CFX connect Real-Time System (Bio-Rad, Hercules, CA, USA) machine. β-actin was chosen as the reference to normalize the mRNA level between treatment and control samples. Three biological replicates were performed for each treatment, with three technical repeats for each biological replicate. A melting curve analysis was performed, and the specificity of the amplification and fold-change value of selected genes was calculated using the 2−ΔΔCt method. When the control ΔCt is greater than the treatment ΔCt, the 2−ΔΔCt value is <1. The negative inverse 2−ΔΔCt is the fold-change reduction in expression; otherwise, the 2−ΔΔCt value is >1, and the original 2−ΔΔCt value is used as the fold change increase from the treatment (Schmittgen & Livak, Reference Schmittgen and Livak2008).
Results
Transcriptome sequencing and assembly
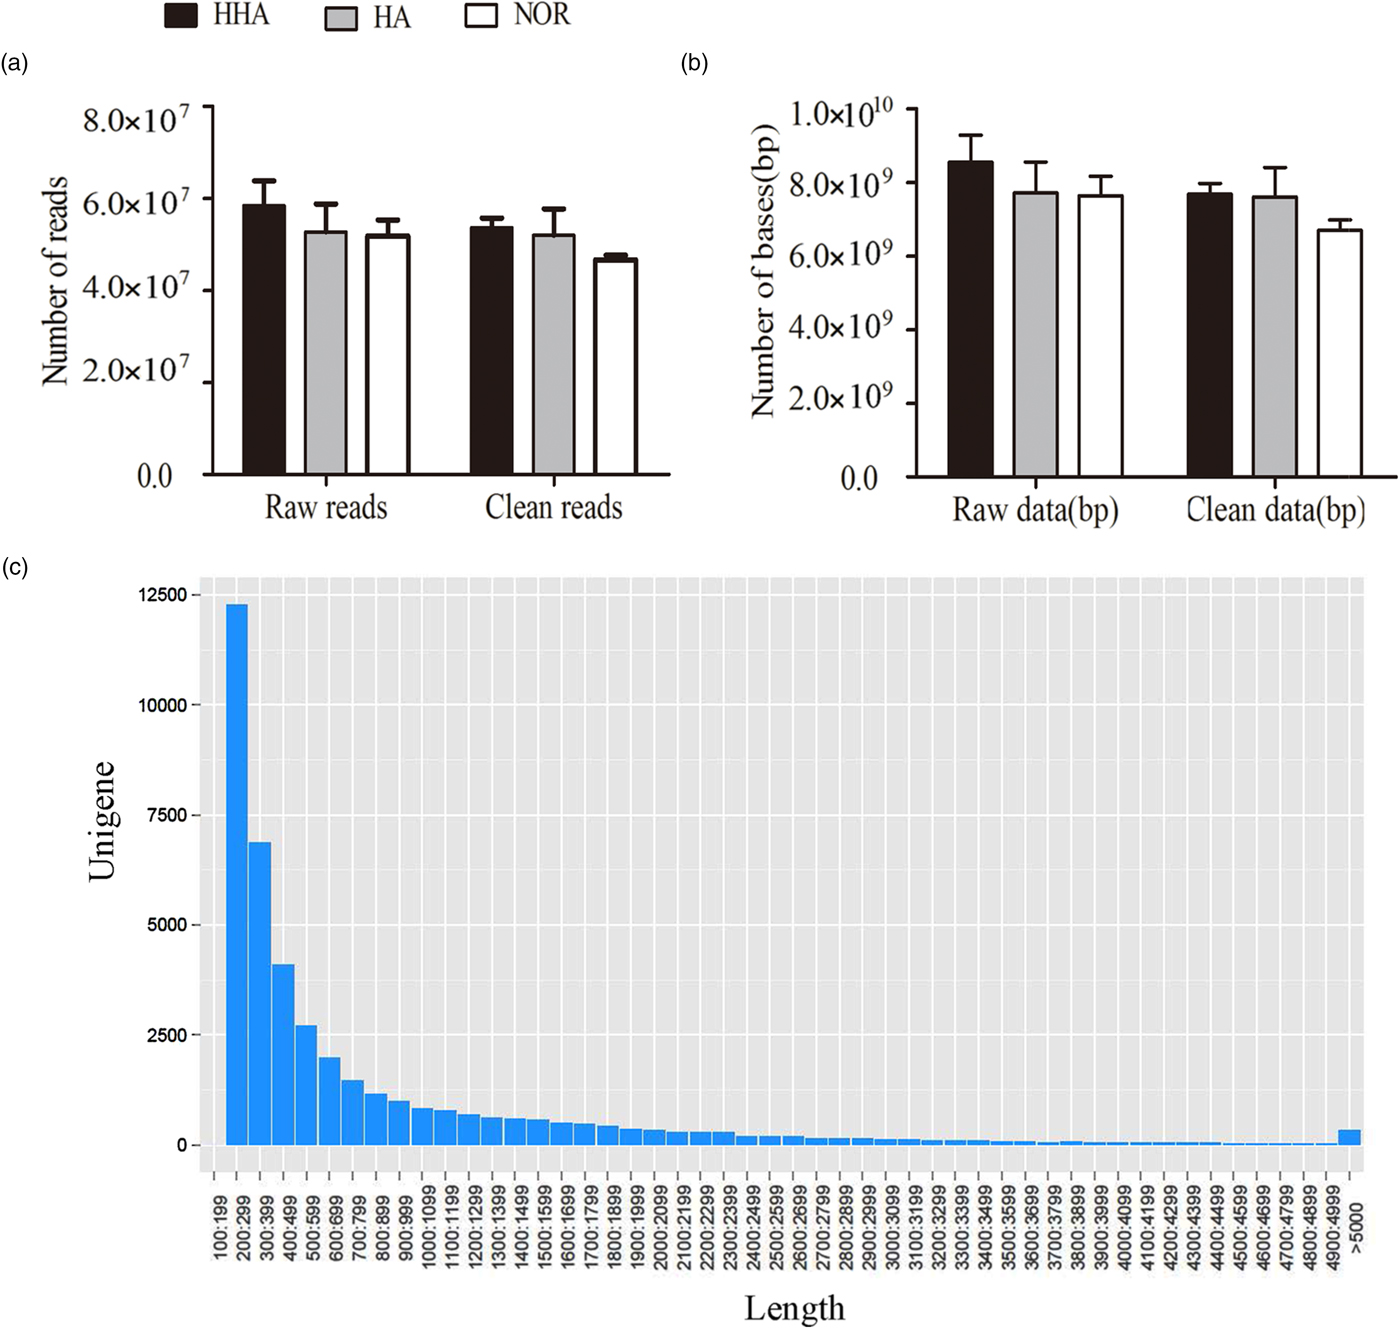
A mean total of 5.83 × 10⁷, 5.27 × 10⁷, and 5.18 × 10⁷ raw reads were obtained from the libraries of samples under HA, HHA, and NOR, respectively. The mean read length was 150 bp. After filtering the low-quality sequences (Q20), nearly 5.37 × 10⁷, 5.20 × 10⁷, and 4.66 × 10⁷ reads were useful under HHA, HA and NOR, respectively (fig. 1a), while 94.13% of reads (5.07 × 10⁷) and 92.84% of bases (7.3 × 10⁹) remained for the de novo assembly, and the information of databases is presented in fig. 1b.

Fig. 1. Summary of sequence data. (a) Reads, (b) bases (c) the length of the transcript.
A total of 8,874,226 contigs with an average length of 209 bp were obtained, and among them, 197,813 contigs were longer than 209 bp, 710,845 bp were longer than 111 bp, the percent of GC was 44.94%. A total of 223,694 transcripts with an average length of 506 bp were obtained, and among them, 41,247 transcripts were longer than 594 bp, 17,1930 transcripts were longer than 238 bp, and the percent of GC was 43.55%. A total of 41,110 unigenes with an average length of 816 bp were obtained, and among them, 6427 unigenes were longer than 1438 bp, 27,713 unigenes were longer than 312 bp, and the percent of GC was 46.28% (table 1). The number of unigenes decreases as its length increases (fig. 1c).
Table 1. Summary of the assembly from sequencing for adzuki bean weevil.

Unigene functional annotation
After being assembled, all unigenes were submitted to the NR, GO, Kegg Orthology (KO), eggNOG, and Swiss-Prot databases for functional annotation using BLSTTX. Among the annotated unigenes, 93.44% were similar to genes in eggNOG, which explores the ancestry of a protein in 26 categories; 65.89% of unigenes were annotated with GO, which is a standard database for classifying gene function; 13.72% of unigenes were annotated with KO; and 80.94% of unigenes were functionally annotated by Swiss-Prot. A total of 65.89% of unigenes were annotated into GO categories, whereas only 13% were annotated into KO categories (table 2).
Table 2. The summary of unigene function annotation with different databases.

Gene expression profiling in HHA and HA
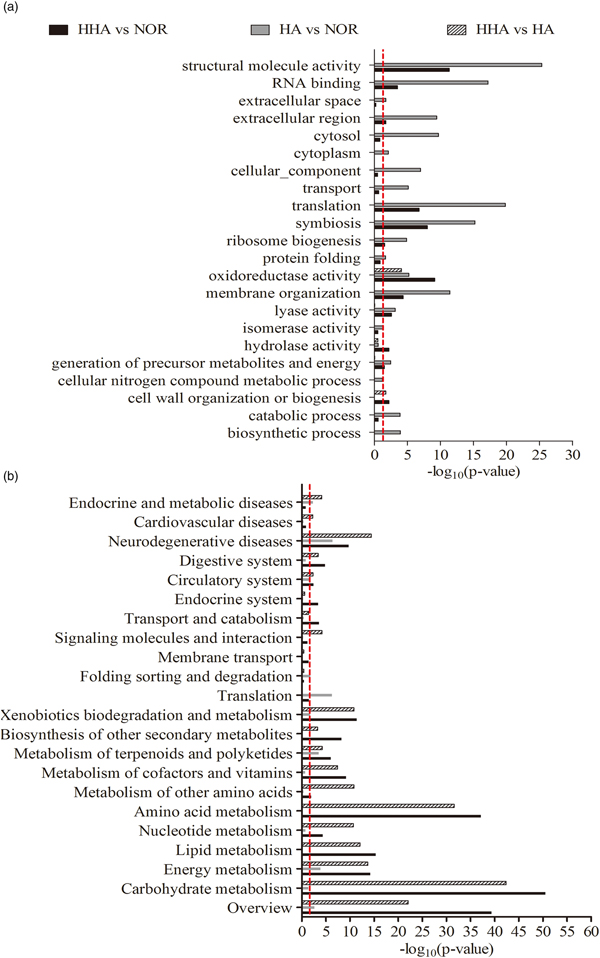
Compared with NOR, a total of 631 DEGs (345 up-regulated, 286 down-regulated) were found in HHA, and 253 DGEs (74 up-regulated, 179 down-regulated) were found in HA. 1135 DEGs (940 up-regulated, 195 down-regulated) were obtained from the comparison of HHA and HA, and the details are listed completely in table S1. Based on GO enrichment, more than ten biological processes were found to be significantly affected by both HHA and HA: molecular function (i.e., structural molecular activity and RNA binding), cellular components (i.e., translation and symbiosis) and organization processes (i.e., membrane organization and lyase activity) were the most significantly enriched categories (fig. 2b and table S2).
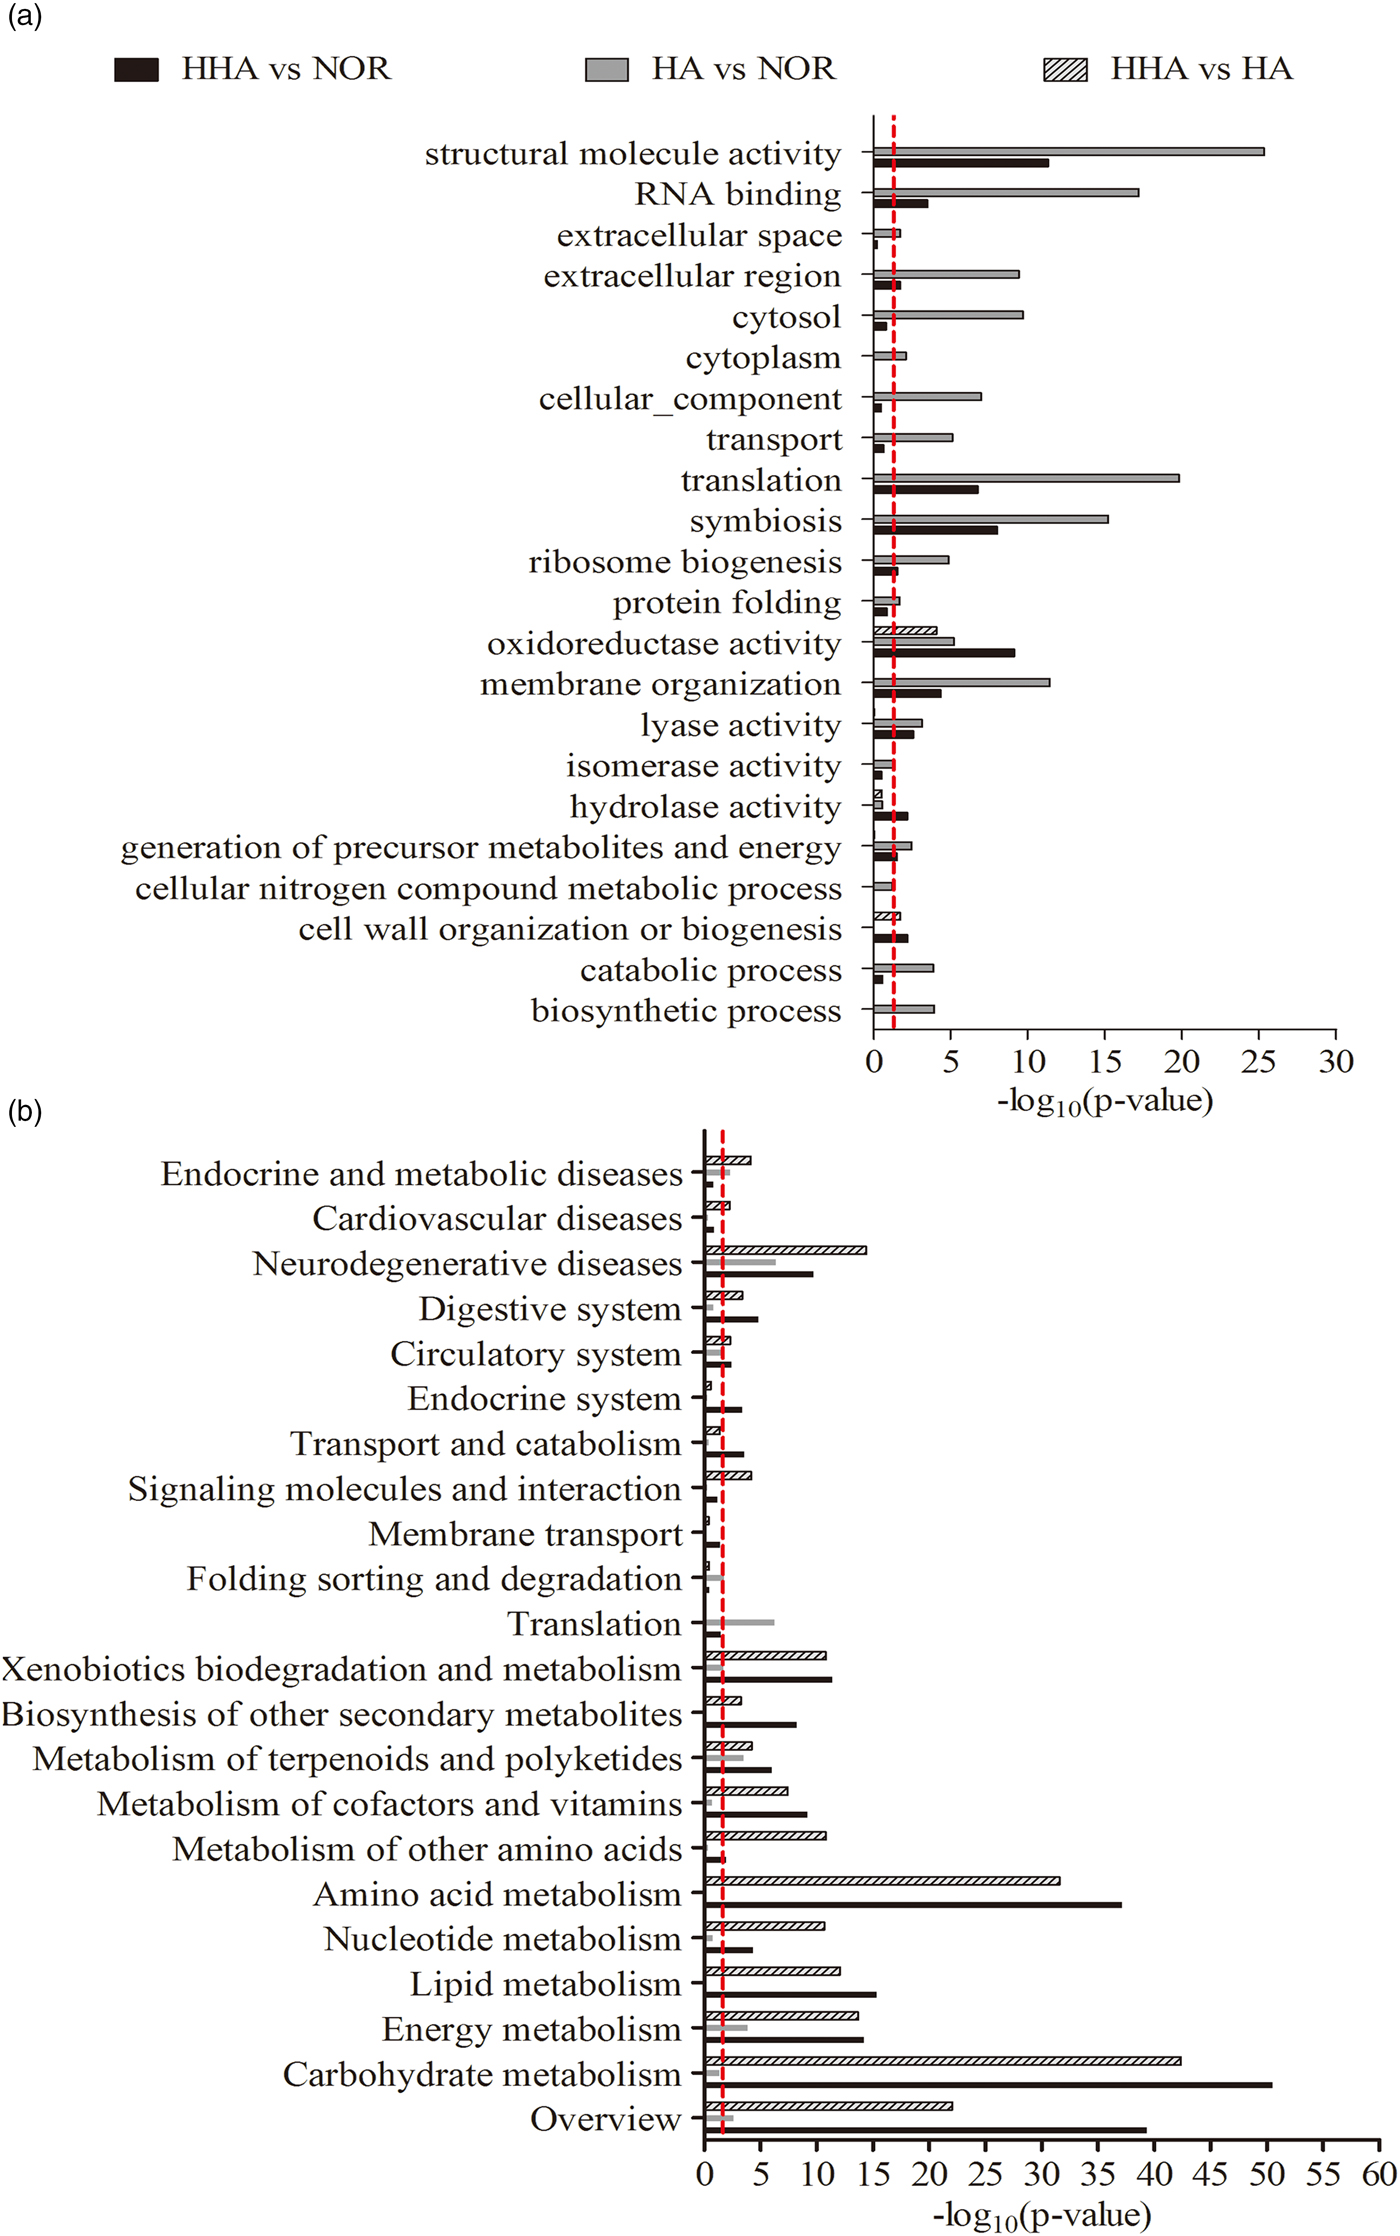
Fig. 2. Summary of significantly enriched categories based on GOSlims (a) and KOSlims (b). GO and KO categories are shown on the y-axis, the distribution of DEGs is presented as log10(P-value) calculated with the principle of hypergeometrics on the x-axis, P < 0.05.
Based on KO enrichment, most of the metabolic pathways were significantly affected under HHA and HA (P < 0.05), and the pathways of carbohydrate metabolism, energy, lipid metabolism were the top three significantly enriched categories by DEGs, followed by the pathways of energy metabolism, xenobiotics biodegradation, and metabolism. The processes of amino acid metabolism, transport and catabolism, and endocrine and digestive systems were significantly enriched in HHA, the process of folding, sorting, and degradation were enriched in HA. Due to the synthetic effect of hypoxia and hypercapnia, the metabolic process was also the most affected category, followed by the biological cellular process and molecular function of binding categories (fig. 2b and table S3). Some of the important processes underlying hypoxia and hypercapnia response in bean weevil were presented below.
Important pathways related to hypoxia and hypercapnia resistant to bean weevil
Carbohydrate metabolism was the most highly significant enriched pathway in both treatments. Sixty-nine DEGs was found for carbohydrate metabolism in HHA (P < 0.05), six DEGs were found in HA (P < 0.05) and 78 DEGs were obtained from the comparison of HHA to HA (fig. 2b and table S3). These DEGs related were widely distributed in branched metabolic pathways, especially the pathways of glycolysis/gluconeogenesis, the citrate cycle (TCA cycle), pentose phosphate, pentose, and glucuronate interconversions and pyruvate metabolism(table S4). Most of DEGs related to these pathways were up-regulated in HHA, except for MINPP1 and LDH, respectively encoding multiple inositol-polyphosphate phosphatases and L-lactate dehydrogenase (fig. 3a).
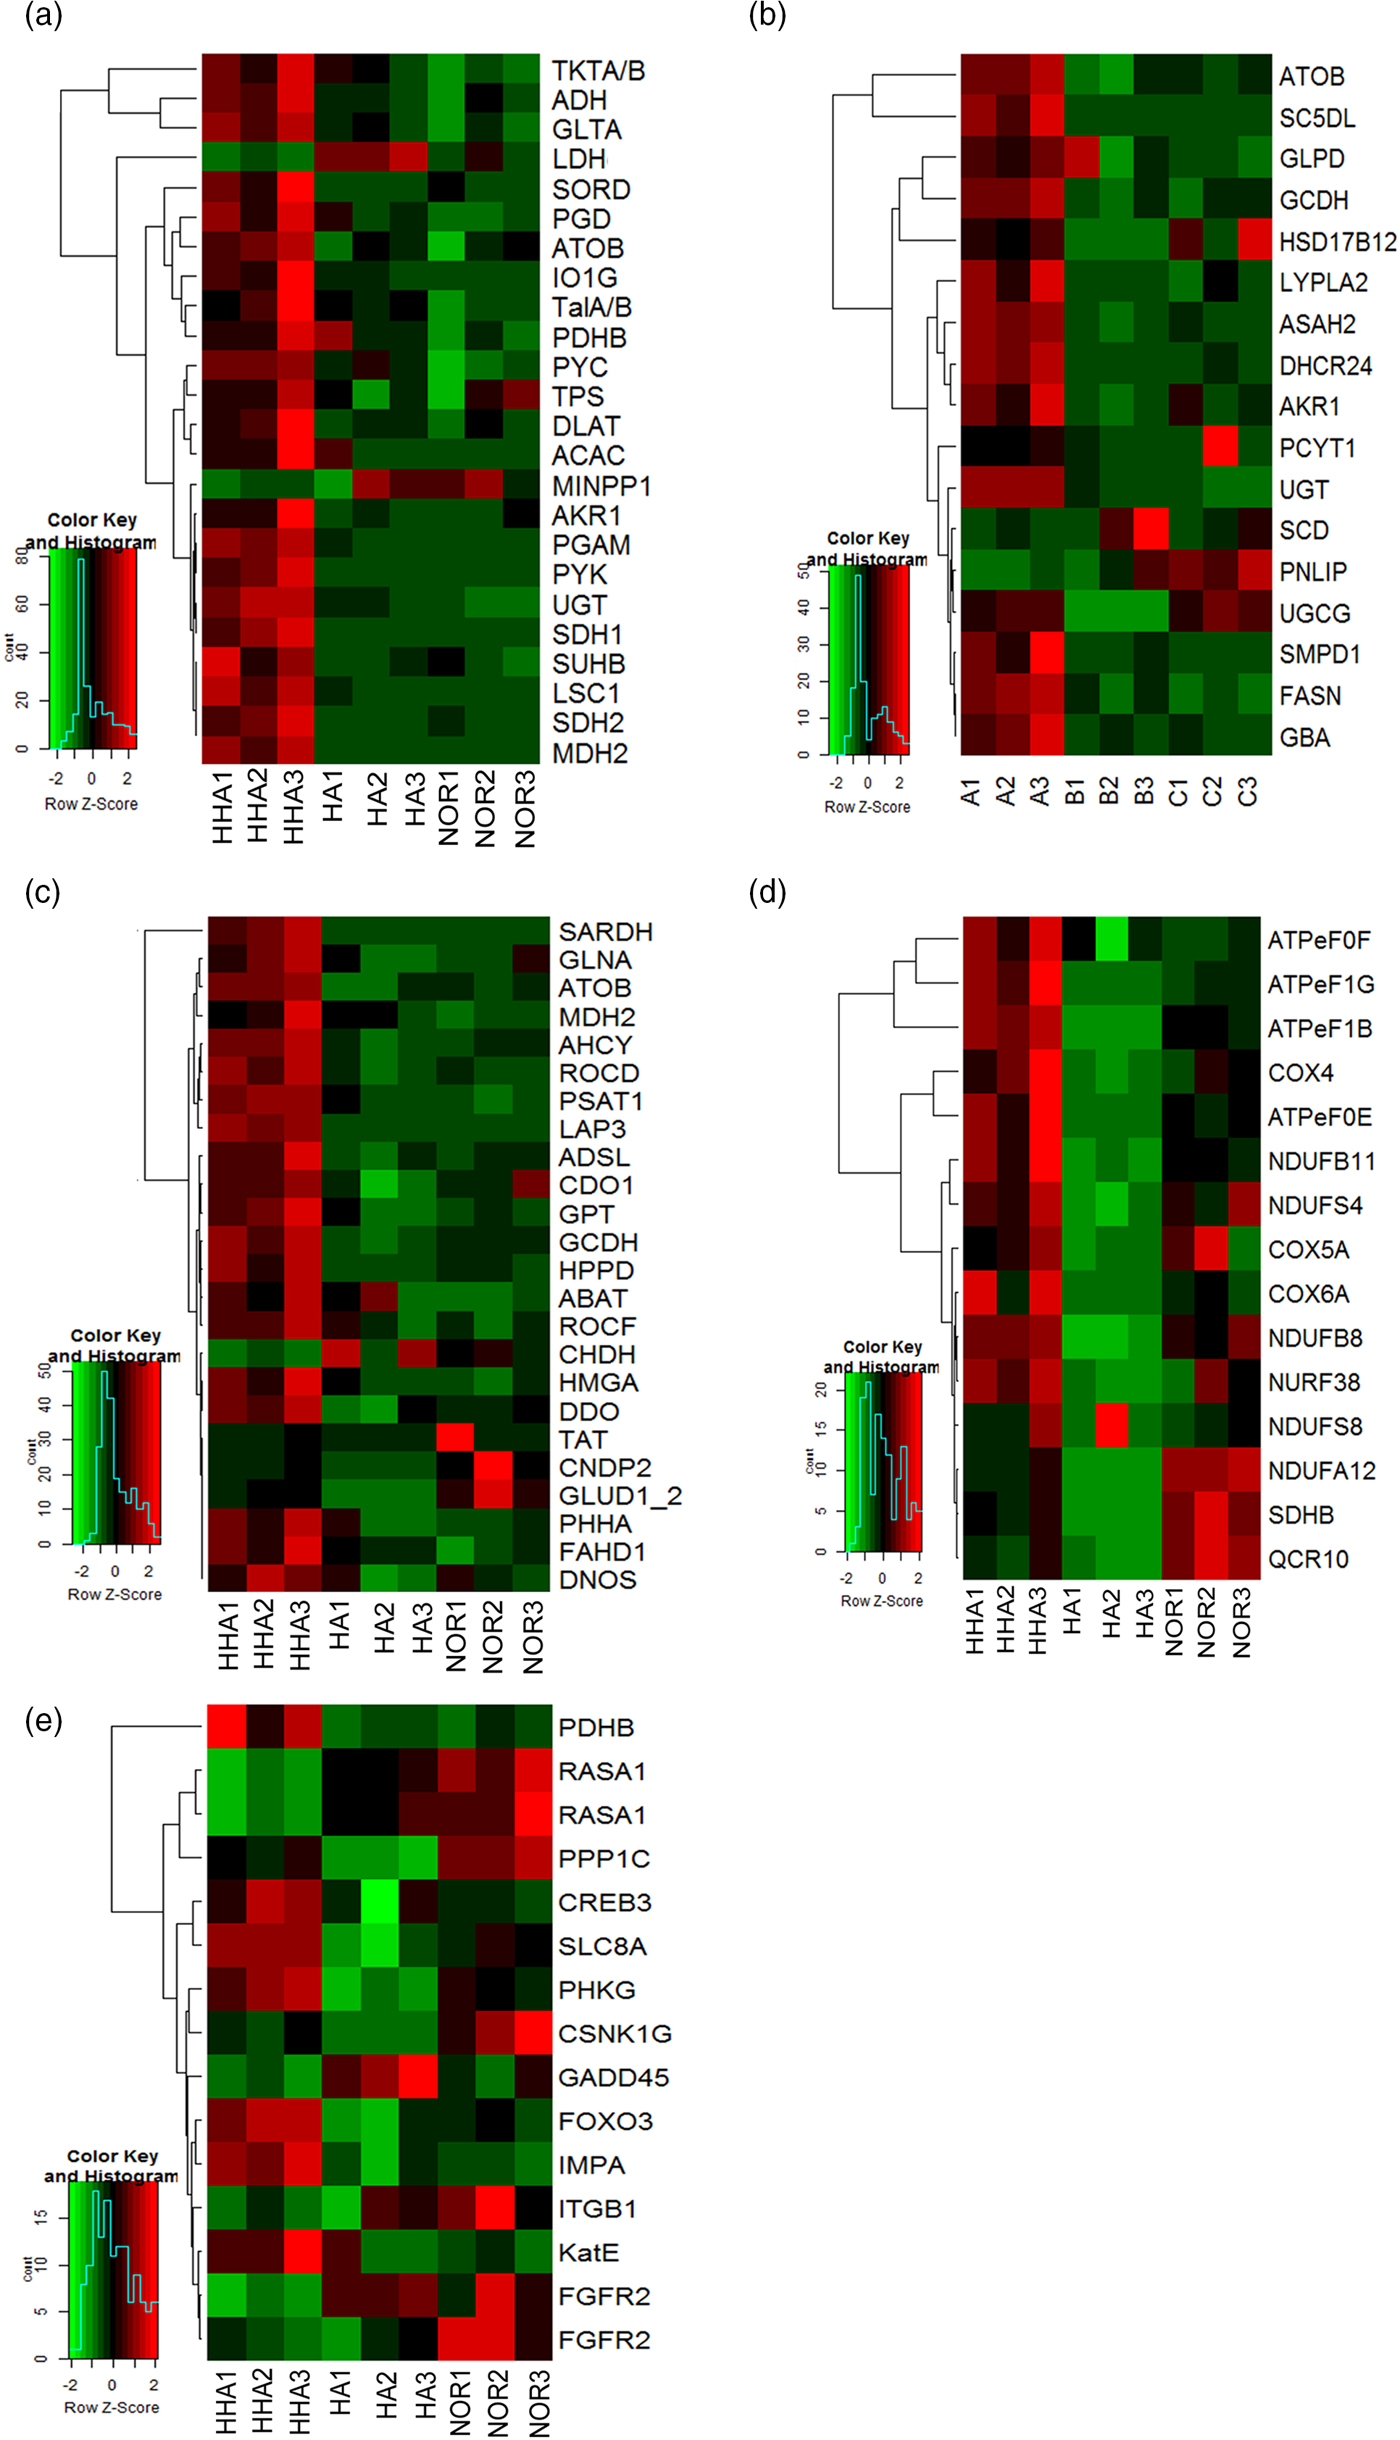
Fig. 3. The alteration in expression of DEGs related to Carbohydrate metabolism (a), Amino acid metabolism (b), Lipid metabolism (c), oxidative phosphorylation (d) and signal transduction (e).
Lipid metabolism was the most significantly enriched pathway in HHA (28 DEGs, P < 4.36E-16) but not in HA (0 DEGs) (fig. 2b and table S3), and most of the pathways in HHA were up-regulated, except for PNLIP encoding pancreatic triacylglycerol lipase (fig. 3b). These genes were widely distributed in branched metabolic pathways, especially fatty acid degradation, glycerolipid, glycerophospholipid, and sphingolipid metabolism (table S4).
Amino acid metabolism was the third mostly enriched category in HHA (51 DEGs, P < 0.05), while it was not significantly enriched in HA (1 DEG, P > 0.05), relative to NOR (fig. 2b and table S3). These DEGs were widely present in almost every amino acid metabolism branches, such as the pathway of alanine, aspartate and glutamate metabolism, arginine and proline metabolism, tyrosine metabolism, and valine, leucine and isoleucine degradation (table S4), most of DEGs related were up-regulated, except for CHDH encoding glutaryl-CoA dehydrogenase (fig. 3c) .
Energy metabolism was significantly enriched by DEGs both in HHA and HA relative to NOR. Twenty-six DEGs were found in HHA (P < 0.05), while only eight DEGs were in HA (P < 0.05) (fig. 2b and table S3). Among them, 12 and 4 DEGs were assigned to oxidative phosphorylation (OXPHOS) in HHA and HA, respectively. Almost all of the related genes were up-regulated. Comparing HHA with HA, energy metabolism was also remarkably enriched, and most of the related genes were up-regulated (fig. 3d and table S4).
The GO enrichment analysis also showed that most DEGs are related to the processes of the immune system and the response to stress was suppressed in HHA or HA, except PGRP2, SODM1, and PRGP, respectively encoding peptidoglycan-recognition, superoxide dismutase [Mn]1 and peptidoglycan-recognition protein were up-regulated (table S4). The alteration in expression of DEGs related to signal transduction was presented in fig. 3e. In HA, the increase of 3 genes encoding those key enzymes such as small subunit ribosomal protein S6e(R-S6e), GAPDH,HSP90A, and R-S6e, besides these 3 genes, another 6 genes encoding PDHB, GAPDH, PEPCK, and cyclic AMP-responsive element-binding protein 3(CREB3) were detected in HHA, most of which were up-regulated, except GAPDH.
q-PCR validation
Twenty-three genes were selected randomly to confirm the accuracy of the RNA-Seq analysis by q-PCR. The results showed an agreement between the q-PCR and RNA-Seq results in paired comparisons of HA and NOR, HHA and NOR, and HHA and HA (fig. 4). For example, the expression of SARDH, which encodes sarcosine dehydrogenase and is a key regulatory enzyme in the glycine, serine, and threonine metabolic pathway, was up-regulated 5-fold (q-PCR) or 4.55-fold (RNA-Seq) after 24 h of exposure to HHA, and 1.65-fold (q-PCR) or 1.92-fold (RNA-Seq) after 24 h of exposure to HA compared with those of the NOR treatment. The q-PCR primers used are presented in table S6.
Fig. 4. The correlation between the transcript level and q-PCR certification of genes obtained from pairwise comparisons of (a) HA and NOR, (b) HHA and NOR, (c) HHA and HA.
Discussion
A modified atmosphere (MA) with hypoxia and hypercapnia is known to be a useful method for stored-product insect control, which has a great effect on the development of Callosobruchus species. The transcriptome profiles of C. maculatus in response to hypoxia/hypercapnia had been reported before (3% O2 + 17% CO2 for 4 h, 24 h) (Chi et al., Reference Chi, Ahn, Yun, Lee, Liu and Zhu-Salzman2011). Our RNA-Seq results provide more depth and coverage of the gene expression of C. chinensis in different air situations (2%O2, 2%O2 + 18%CO2) for 24 h. the current study represents our first attempt to investigate the molecular response of C. chinensis to hypoxia and hypercapnia. We found that genes related to primary metabolism and energy metabolism in bean weevil were highly significantly changed due to hypoxia and hypercapnia, and the presence of hypercapnia enhanced hypoxia effects on gene expression (Zhou et al., Reference Zhou, Xue, Lai, Schork, White and Haddad2008a; Chi et al., Reference Chi, Ahn, Yun, Lee, Liu and Zhu-Salzman2011).
Most of DEGs related to carbohydrate metabolism (e.g., glycolysis, TCA cycle, pyruvate metabolism, and pentose phosphate) were down-regulated in hypoxia, while most of DEGs were up-regulated in the presence of hypercapnia (fig. 5a). For example, the decrease of GAPDH, ALDO respectively, encoding glyceraldehyde 3-phosphate dehydrogenase and fructose-bisphosphate aldolase, class I in glycolysis in HA, might suggest anaerobic metabolism suppressed. The increase of DEGs (e.g., DLAT, PDHB, PDHA, PC, MDH2, SDHB, and CS) involved in TCA cycle and glycolysis (e.g., LDH and PK) in HHA, might lead to the increase of energy supply but the disturbance of internal acid-base balance (Nicolas & Sillans, Reference Nicolas and Sillans1989; Harrison, Reference Harrison2001; Förster & Hetz, Reference Förster and Hetz2010). Furthermore, the increase of DEGs involved in pyruvate metabolism and pentose phosphate pathway in HHA might be useful for energy supply (Feala et al., Reference Feala, Coquin, Zhou, Haddad, Paternostro and McCulloch2009; Ahn et al., Reference Ahn, Zhou, Dowd, Chapkin and Zhu-Salzman2013). It might be the reason for larvae growing faster but the higher death rate in HHA than those in HA (Zhou et al., Reference Zhou, Xue, Lai, Schork, White and Haddad2008a; Ragland et al., Reference Ragland, Denlinger and Hahn2010; Chi et al., Reference Chi, Ahn, Yun, Lee, Liu and Zhu-Salzman2011; Cheng et al., Reference Cheng, Lei, Ahn, Liu and Zhu-Salzman2012).

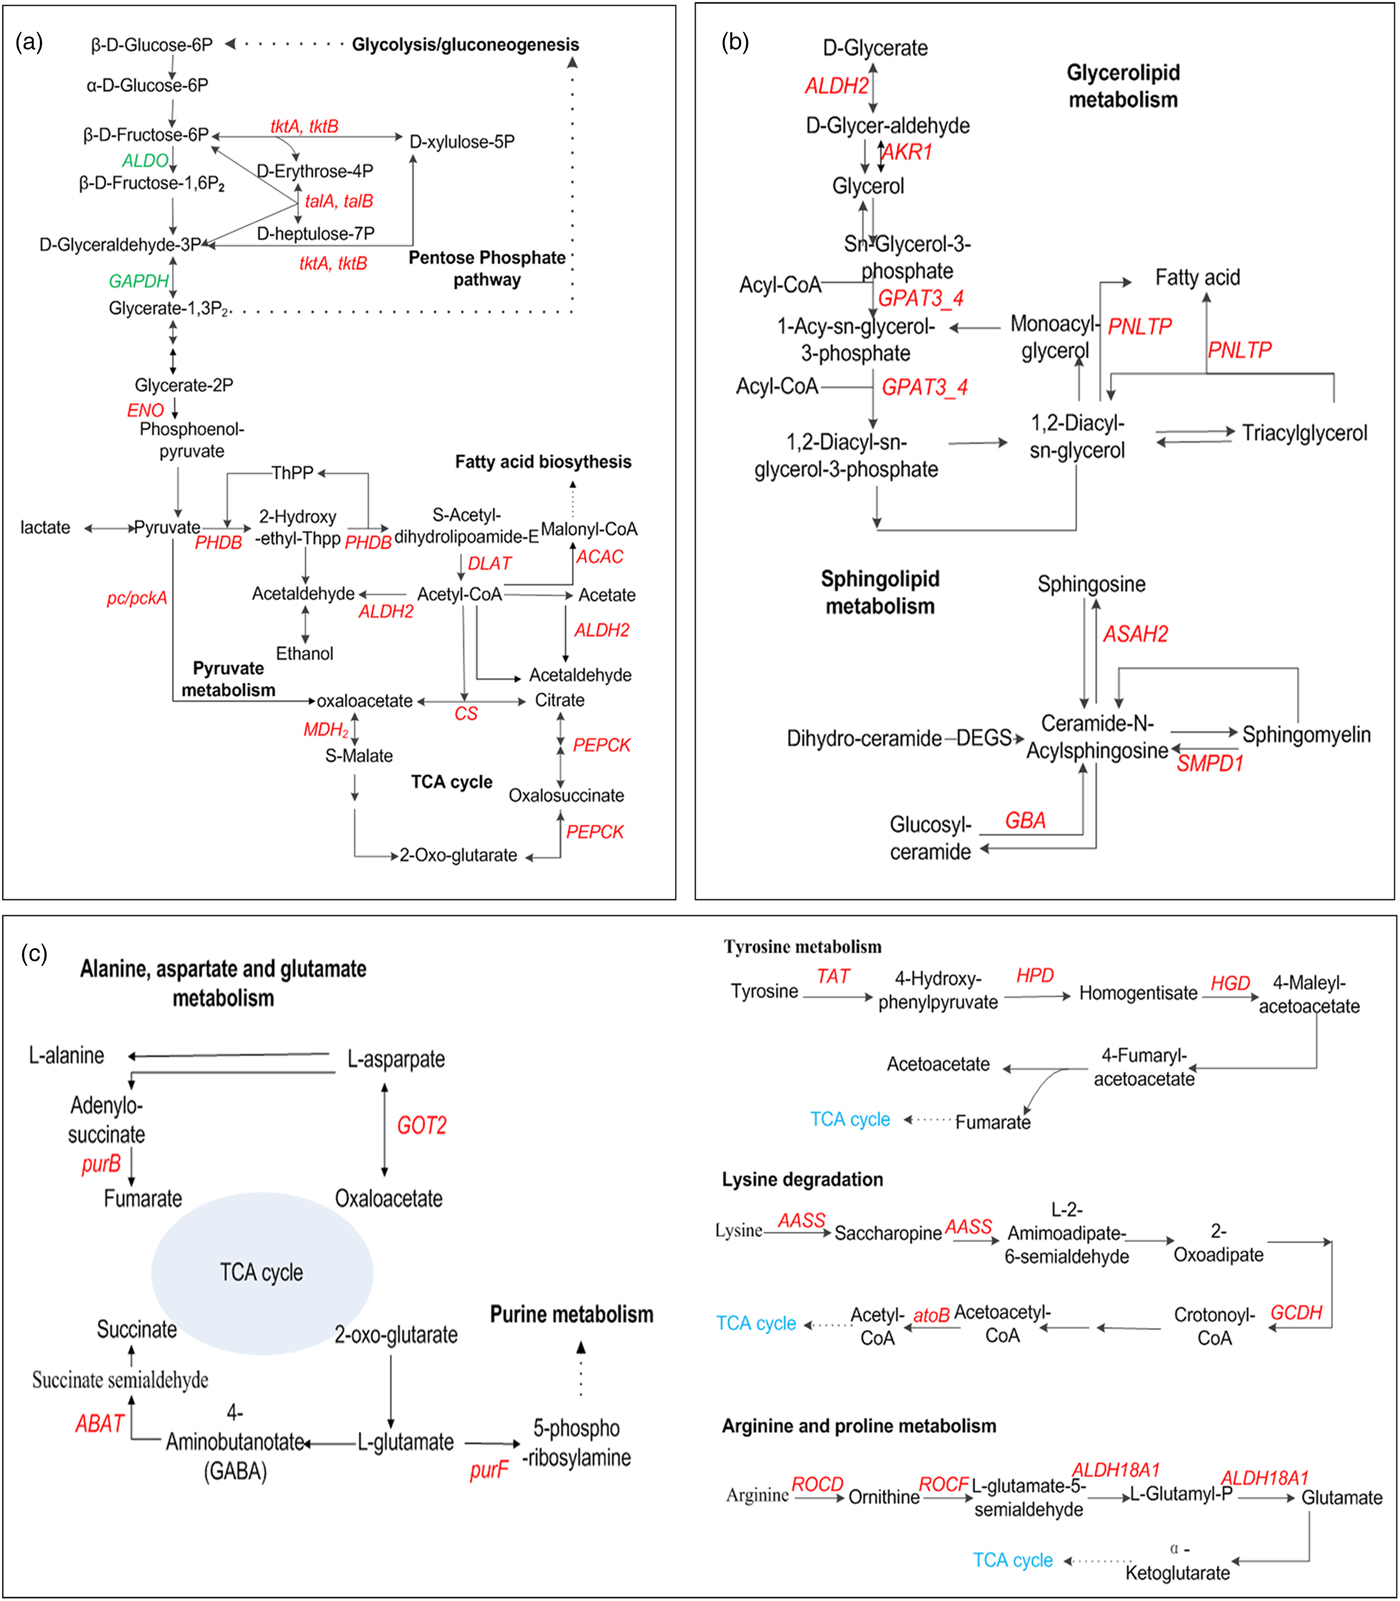
Fig. 5. Schematic diagram of key genes related to the pathway of carbohydrate metabolism (a), lipid metabolism (b) and amino acid metabolism (c). Red indicates up-regulated genes, and green indicates down-regulated genes in HHA, related to NOR. GAPDH: Glyceraldehyde 3-phosphate dehydrogenase; tktA, tktB: transketolase; talA, talB: transaldolase, ALDO: fructose-bisphosphate aldolase, class I; MDH2: malate dehydrogenase; CS: citrate synthase; ACAC: acetyl-CoA carboxylase; ENO: enolase; PHDB: pyruvate dehydrogenase E1 component subunit β; DLAT: pyruvate dehydrogenase E2 component; ALDH2: aldehyde dehydrogenase (NAD+); PEPCK: phosphoenolpyruvate carboxykinase; MDH: malate dehydrogenase; pc/pckA: pyruvate carboxylase; ALDH2: aldehyde dehydrogenase (NAD+); PNLTP: pancreatic triacylglycerol lipase; ASAH2: neutral ceramidase; AKR1: aldehyde reductase; DHCR24: delta 24-sterol reductase; GPAT3_4: glycerol-3-phosphate O-acyltransferase 3/4; SMPD1: sphingomyelin phosphodiesterase; GBA: glucosylceramidase; ROCD: ornithine--oxo-acid transaminase; TAT: tyrosine aminotransferase; AASS: alpha-aminoadipic semialdehyde synthase; ROCF: arginase; ALDH18A1: delta-1-pyrroline-5-carboxylate synthetase; HGD: homogentisate 1,2-dioxygenase; purB: adenylosuccinate lyase; ABAT: 4-aminobutyrate aminotransferase; GOT2: aspartate aminotransferase; atoB: acetyl-CoA c-acetyltransferase; GCDH: glutaryl-CoA dehydrogenase.
Lipid metabolism is not only nutrient reserves when insect metabolic depression under extreme environment, but also serve as cell structural components, growth regulators and precursors of neurotransmitters. In our paper, bean weevil lipid metabolism was significantly affected by hypoxia/hypercapnia, while it significantly changed in fungi, C. neoformans, and Drospphila under hypoxia only (Donahaye & Navarro, Reference Donahaye and Navarro2000; Zhou et al., Reference Zhou, Xue, Lai, Schork, White and Haddad2008a; Gleason et al., Reference Gleason, Corrigan, Cox, Reddi, McGinnis and Culotta2011). Our results were similar to C. maculatus under hypoxic/hypercapnic (Donahaye & Navarro, Reference Donahaye and Navarro2000; Chi et al., Reference Chi, Ahn, Yun, Lee, Liu and Zhu-Salzman2011; Ahn et al., Reference Ahn, Zhou, Dowd, Chapkin and Zhu-Salzman2013). It suggests that stored product insects (i.e., bean weevil, cowpea bruchid) have much higher hypoxia tolerance. In hypoxia/hypercapnia, some DEGs encoding the rate-limiting enzymes in lipid metabolism were up-regulated (fig. 5b). For example, long-chain-fatty-acid--CoA ligase gene (ACSBG) in the initial stage were up-regulated and acetyl-CoA C-acetyltransferase gene (atoB) in the final stage of fatty acid degradation were down-regulated, which might lead to the activation of fatty acid degradation. The increase of PNLTP in glycerolipid metabolism was helpful for the mobilization of triglyceride (TG) reserves for energy sources and water balance, while caused TG to be exhausted in a short time, resulting in insect death due to desiccation (Donahaye & Navarro, Reference Donahaye and Navarro2000). The genes of glycerol-3-phosphate O-acyltransferase 3/4 (GPAT3_4), glycerol-3-phosphate dehydrogenase (GLPA), and glycerol-3-phosphate dehydrogenase (NAD+) (GPD1) in sphingomyelin metabolism were up-regulated, which might lead to brain lipid precursors transferring into the processes of signal transduction, resulting in insect neurological disorder; The increase of glucuronosyltransferase gene (UGT) might inactivate ecdysteroid in steroid hormone biosynthetic pathway, leading to insect diapause (O'Reilly & Miller, Reference O'Reilly and Miller1989; Lin et al., Reference Lin, Cai, Wu and Luo2016).
Amino acid metabolism was most significantly affected by bean weevil under hypoxia/hypercapnia. Most of DEGs related were up-regulated, for example, the genes of homogentisate 1,2-dioxygenase (TAT), aspartate aminotransferase, mitochondrial (GOT2), and kynurenine/2-aminoadipate aminotransferase (KAT2) and 4-hydroxyphenylpyruvate dioxygenase gene (HPD) were up-regulated, which might make amino acids lose more important molecular functions than the energy supply (fig. 5c). The decrease of TAT and HPD in tyrosine metabolism might lead to the decrease of dopamine which is important for neurotransmission, curricular sclerotization, and melanization in insects (Manekar et al., Reference Manekar, Godshalwar, Rewale and Singh2005; Marmaras & Lampropoulou, Reference Marmaras and Lampropoulou2009); The increase of 4-aminobutyrate aminotransferase gene (ABAT) might lead to the decrease of GABA, which is the principle synaptic transmission inhibitor both in the central nervous system and at nerve/muscle junctions in insects (Nicolas & Sillans, Reference Nicolas and Sillans1989; Ramputh & Bown, Reference Ramputh and Bown1996; Duncan & Newton, Reference Duncan and Newton2000; Rash and Hodgson, Reference Rash and Hodgson2002).
Most of DEGs related to oxidative phosphorylation (OPHOS), except for the decrease of cytochrome c oxidase subunit 3 gene (COX3), were found to be significantly up-regulated due to hypoxia or hypercapnia. Cytochrome c oxidase subunit (COX) is critical for the utilization of O2 in process of mitochondrial respiration. COX has three largest subunits (COX1, COX2, and COX3). In this paper, COX1 was up-regulated and COX3 was down-regulated, which might influence the catalytic activity of COX and the utilization of O2 in bean weevil under the hypoxic environment (Khalimonchuk & Rödel, Reference Khalimonchuk and Rödel2005). This phenomenon was similar to the response of Tibetan migratory locust but opposite to the response of Epiblema scudderiana and Eurosta solidaginis under a similar situation (McMullen & Storey, Reference McMullen and Storey2008; Zhang et al., Reference Zhang, Chen, Zhao and Kang2013). The alteration in expressions of DEGs encoding NADP-producing enzymes (e.g., NDUFA12, NDUFAS8 and NDUFB11) and succinate dehydrogenase (e.g., SDHA and SDHB) were up-regulated in hypoxia/hypercapnia. Unlike Ephestia cautella and Drosophila, these enzymes were suppressed under pure carbon dioxide (Duncan & Newton, Reference Duncan and Newton2000; Colinet & Renault, Reference Colinet and Renault2012).
In addition, most of the genes related to immunity, stress response, and signal transduction were significantly suppressed in bean weevil under hypoxia and hypoxia/hypercapnia, except for a few genes that were up-regulated. For example, PGRP2 and PGRP-SC2 involved in pathways of Toll-like receptor signaling and immune deficiency were up-regulated (Dziarski & Gupta, Reference Dziarski and Gupta2006). SODM1 and CATA, which are important for protecting cells from ROS damage, were up-regulated (Guzy et al., Reference Guzy, Hoyos, Robin, Chen, Liu, Mansfield, Simon, Hammerling and Schumacker2005; Maroz et al., Reference Maroz, Kelso, Smith, Ware and Anderson2008). AAT2 and RXRA involved in oxidative phosphorylation, β-oxidation of fatty acids, were also up-regulated (Aprille, Reference Aprille1988; Huss et al., Reference Huss, Levy and Kelly2001). These genes up-regulated might be helpful for bean weevil surviving under severe hypoxia and hypoxia/hypercapnia.
Conclusion
We elucidated the differences in transcriptional profiles of the 4th adzuki bean weevil larvae under hypoxic, hypoxic/hypercapnic, and normal oxygen environments. Several differences between insect response to hypoxia and hypoxia/hypercapnia have been found, such as the regulation of primary metabolism, signal transduction pathways, immune system. We suppose that these multiple changes might contribute to the high hypoxia even hypoxia/hypercapnia tolerant in bean weevil. It might complement our previous metabolomics work on bean weevil under the same situation. These studies are critical for revealing the mechanism of hypoxia and hypoxia/hypercapnia tolerance in stored product insects, although further verification experiment should be done in future.
Supplementary material
The supplementary material for this article can be found at https://doi.org/10.1017/S0007485318000512.
Acknowledgements
This study was supported by the Key Construction Program of the National ‘985’ Project (985, Grant No. TS0320215002) and Agri-X (Grant No. Agri-X 2016007) from Shanghai Jiao Tong University, Shanghai international scientific and technological cooperation foundation (Grant No.17310742000) and Zhenjiang scientific and technological foundation for social development (Grant No.SH2017053). The authors sincerely thank the experts from Shanghai Personal Biotechnology Co., Ltd for RNA-Seq technical support.