


Introduction
If the current geographic distribution of a species is known, its potential to invade other parts of the world can be estimated using a variety of correlative and mechanistic niche modelling methods (Guisan & Zimmermann, Reference Guisan and Zimmermann2000; Kriticos & Randall, Reference Kriticos, Randall, Groves, Panetta and Virtue2001). Despite criticism of the ability of some of these methods to model the potential range of invasive species reliably (e.g. Randin et al., Reference Randin, Dirnböck, Dullinger, Zimmermann, Zappa and Guisan2006; Duncan et al., Reference Duncan, Cassey and Blackburn2009; Sutherst & Bourne, Reference Sutherst and Bourne2009; Rodda et al., Reference Rodda, Jarnevich and Reed2011; Webber et al., Reference Webber, Yates, Le Maitre, Scott, Kriticos, Ota, McNeill, Le Roux and Midgley2011), the practice has nonetheless become commonplace to satisfy the needs of policymakers and others. However, in the absence of suitable modelling standards, peer-review processes and experienced modellers, a confusing range of divergent models sometimes emerges (Venette et al., Reference Venette, Kriticos, Magarey, Koch, Baker, Worner, Gómez Raboteaux, McKenney, Dobesberger, Yemshanov, De Barro, Hutchison, Fowler, Kalaris and Pedlar2010). The availability of highly automated modelling systems (e.g. Graham et al., Reference Graham, Newman, Kumar, Jarnevich, Young, Crall, Stohlgren and Evangelista2010) can promote the confusion by further divorcing the modeller from the ecological modelling process, thereby making the technology to generate distribution models accessible to an even wider audience, with even less experience or understanding of the underlying theoretical and methodological issues. Nonetheless, when applied carefully, bioclimatic models can provide a sound scientific basis to help evaluate the relevance of current and future phytosanitary restrictions (government regulations that restrict the importation of plant products) imposed on international trade to mitigate against the risk of introducing pests to importing countries (FAO, 2006).
Correlative climate-based modelling tools and species distribution data are often used to identify and characterise climates that are suitable for pest organisms, and then to identify climatically suitable regions in the risk assessment area. It is well known that species distribution records can be biased and erroneous (Wieczorek et al., Reference Wieczorek, Guo and Hijmans2004) and may be influenced by non-climatic factors, such as biotic interactions and human land use. In many cases, the biases and errors in the input datasets go unknown or unexplored and propagate through the model, resulting in an erroneous model (Graham et al., Reference Graham, Elith, Hijmans, Guisan, Peterson and Loiselle2008). Whilst some effort has been applied to developing techniques to cleanse datasets (e.g. Wieczorek et al., Reference Wieczorek, Guo and Hijmans2004), there nonetheless may remain undetected taxonomic, geographic or epistemic errors or artefacts of non-climatic factors in the distribution data. One approach to tackling this problem may be to incorporate information into the model from a range of knowledge domains besides distribution data, such as physiological development experiments and seasonal phenology data. We may be more confident in a model where different lines of evidence support parameter values or other modelling options. Where the different lines of evidence conflict, the modeller is alerted to the need to explore the issue further to identify the source of the conflict, consider the weight of evidence, seeking to either resolve the conflict or to characterise and report the apparent uncertainty.
The Natal fruit fly, Ceratitis rosa Karsch, belongs to the family Tephritidae, the true fruit flies, which is one of the largest and most economically important families of Diptera (White & Elson-Harris, Reference White and Elson-Harris1992). This pest species is native to tropical Africa (White & Elson-Harris, Reference White and Elson-Harris1992), with the earliest description in 1887 from specimens collected at Delagoa Bay, Mozambique (Anonymous, 1963; Weems, Reference Weems1966; Botha et al., Reference Botha, Hardie and Barnes2004). By 1900, it was recognised as a pest of orchard fruit over a large part of the KwaZulu Natal Province, South Africa (Weems, Reference Weems1966). After the Mediterranean fruit fly, Ceratitis capitata (Wiedemann), C. rosa is the second most economically important fruit fly pest in South Africa (Weems, Reference Weems1966; Grout & Stoltz, Reference Grout and Stoltz2007). Ceratitis rosa is also a pest of phytosanitary concern that may potentially restrict international fruit trade (Barnes, Reference Barnes, Price and Seewooruthun2000; Barnes et al., Reference Barnes, Rosenberg, Arnolds and Johnson2007; EPPO, 2007), making reliable estimates of the potential global distribution particularly important.
In 2001, C. rosa expanded its distribution within Kenya to include the central highlands (Copeland et al., Reference Copeland, Wharton, Luke, De Meyer, Lux, Zenz, Machera and Okumu2006). In the 1950s, it spread to the remote islands of Mauritius and Reunion (White & Elson-Harris, Reference White and Elson-Harris1992), where it has been reported to be strongly competitive against other indigenous and invasive Ceratitis spp. (Hancock, Reference Hancock1984; Quilici et al., Reference Quilici, Franck, Peppuy, Dos Reis Correia, Mouniama and Blard Cirad-Flhor2002; Duyck et al., Reference Duyck, David, Junod, Brunel, Dupont and Quilici2006a). Elsewhere within the African continent, the species has not demonstrated high invasiveness, as can be seen by the limited expansion of its distribution beyond its historical native range. This apparent discrepancy may be due to the escape from natural enemies, such as parasitoids or competitors, on Mauritius and Reunion (Keane & Crawley, Reference Keane and Crawley2002).
Ceratitis rosa is a polyphagous species with a wide host range (De Meyer, Reference De Meyer2001), attacking many commercially grown fruit crops, as well as wild host plants including invasive exotics such as the bugweed tree Solanum auriculatum (White & Elson-Harris, Reference White and Elson-Harris1992). The crops that are most affected in South Africa are deciduous fruit, table grapes, citrus and sub-tropical fruit (Barnes, Reference Barnes, Price and Seewooruthun2000). Damage is caused by C. rosa when the females oviposit under the skin of fruit and the larvae subsequently develop inside the flesh. Three larval stages and a prepupal stage are completed inside the fruit, after which pupation occurs in the soil (Botha et al., Reference Botha, Hardie and Barnes2004). Under ideal conditions, adult flies may live several months, feeding on honeydew from aphids, mealybugs and scale insects, as well as juice from damaged fruit. In summer, the entire life cycle can be completed in three to four weeks, but during colder months, this period will be considerably longer (Du Toit, Reference Du Toit, Bedford, Van den Berg and De Villiers1998; Botha et al., Reference Botha, Hardie and Barnes2004). In addition, the oviposition puncture sites may lead to fungal infections (Hepburn & Bishop, Reference Hepburn and Bishop1954; Du Toit, Reference Du Toit, Bedford, Van den Berg and De Villiers1998; De Villiers & Grové, Reference De Villiers, Grové, De Villiers and Joubert2006).
The potential global distribution of C. rosa was estimated by De Meyer et al. (Reference De Meyer, Robertson, Peterson and Mansell2008), using the correlative ecological niche modelling techniques, GARP (generic algorithm for rule-set prediction) and PCA (principal components analysis). Similarly, Li et al. (Reference Li, Ma, Hu, Liu and Zhang2009) used GARP and maximum entropy species distribution modelling (MaxEnt) (Phillips et al., Reference Phillips, Anderson and Schapire2006; Elith et al., Reference Elith, Phillips, Hastie, Dudík, En Chee and Yates2011). These models were built on a database of records of species presence, primarily in the form of collection records (De Meyer et al., Reference De Meyer, Robertson, Peterson and Mansell2008; Li et al., Reference Li, Ma, Hu, Liu and Zhang2009). These correlative models do not lend themselves to including information on the relative abundance and seasonal phenology of the species in estimating its potential range. They rely solely on presence data and are designed to work with temporally static covariates, such as the Bioclim variables (Kriticos & Randall, Reference Kriticos, Randall, Groves, Panetta and Virtue2001; Venette et al., Reference Venette, Kriticos, Magarey, Koch, Baker, Worner, Gómez Raboteaux, McKenney, Dobesberger, Yemshanov, De Barro, Hutchison, Fowler, Kalaris and Pedlar2010). Their output is similarly static, so it is impossible to compare phenological information with model results.
In contrast, CLIMEX (Hearne Scientific Software Pty Ltd, Australia) (Sutherst & Maywald Reference Sutherst and Maywald1985; Sutherst et al., Reference Sutherst, Maywald and Kriticos2007) is a mechanistic modelling package developed primarily to estimate the potential distribution of invasive species and to explore the climatic factors that influence population growth or decline. CLIMEX models can be fitted using inductive or deductive methods as the situation requires. Inductive methods can be used to fit climatic stress functions to define the species range limits, adjusting parameter values until the model results agree with species distribution or phenological data. Deductive methods can be used to define parameter values based on direct experimental observations of species responses to experimentally determined climatic factors or to phenological observations.
In a typical CLIMEX model, the growth index is the least well-defined summary variable because experimental development data, relative abundance and phenological information are far less readily available than the simple occurrence data typically used to fit the stress indices. The growth index parameters are frequently informed by theoretical considerations, and hence the relative climate suitability within the species range is likely to be less reliably characterised than the species range limits. Normally, this is of little consequence because most models are developed to estimate the species potential range, rather than abundance or suitability patterns within that range.
CLIMEX splines monthly meteorological data to weekly values to calculate climate suitability on a weekly basis and then integrates these weekly suitability values to derive annual estimates. The weekly suitability estimates allow the modeller to compare observed phenological and seasonal abundance data with modelled climate suitability data directly, affording the modeller the ability to fit the growth index parameters more reliably. Phenological and abundance data are particularly useful for modelling where they are derived from localities traversing boundaries of the organism's distribution, as this can aid in both defining the organism's range limits more precisely and characterising the climatic factors constraining its distribution (Kriticos et al., Reference Kriticos, Potter, Alexander, Gibb and Suckling2007).
South Africa spans a wide range of climatic conditions (Kriticos et al., Reference Kriticos, Webber, Leriche, Ota, Macadam, Bathols and Scott2012) where the abundance of C. rosa has been reported to vary considerably, including areas where the organism is apparently absent (Myburgh, Reference Myburgh1962; Grout & Stoltz, Reference Grout and Stoltz2007). This made the region well suited for conducting a trapping survey to generate relative abundance and seasonal phenology data, which, together with presence data from across the known distribution range of the species in South Africa, could be used to estimate C. rosa's climatic niche using CLIMEX. CLIMEX was chosen because it has a proven track record of being able to model the potential distribution of invasive species reliably (more than 300 peer reviewed papers) and includes the ability to compare modelled and observed phenological patterns. Whilst the potential to use phenological observations to aid model fitting have been discussed previously (Zalucki & Van Klinken, Reference Zalucki and Van Klinken2006; Sutherst et al., Reference Sutherst, Maywald and Kriticos2007), and its use has been claimed (Scott, Reference Scott1992), we know of no publications actually demonstrating its use.
In this paper, we collect and analyse trapping data for C. rosa in South Africa, and combine this information with distribution data from this region to build a CLIMEX model. This model is then applied to central Africa to compare the model fit with the independent distribution data in that region. The validated model is then used to create a global climatic risk map.
Materials and methods
Trapping data
To measure the distribution, relative abundance and seasonal phenology of C. rosa across South Africa, a total of 36 sampling sites were used (fig. 1). Since CLIMEX uses climatic data, the sampling sites were chosen to represent different climatic regions of the country (table 1) (Kriticos et al., Reference Kriticos, Webber, Leriche, Ota, Macadam, Bathols and Scott2012). As little information is available on the distribution of C. rosa along the west coast of the country, more sampling sites were chosen in this region. At each of the sampling sites, three yellow bucket traps, baited with three-component Biolure® Fruit Fly, were used to monitor C. rosa. Dichlorvos was used to kill the flies in the traps. The traps were placed in host plants or in close vicinity to a host to ensure the availability of food for the flies. Each of the three traps per site were separated by at least 150m. In addition, traps were placed mostly in back gardens in towns where chemical sprays were not applied. However, at some of the locations, traps were placed on farms where suitable monitoring opportunities were unavailable in town. As traps were placed in back gardens, the number and composition of host plants in the vicinity of the traps differed between the sites, being reflective of the species’ natural distribution in the area without the influence of monoculture orchards. All traps were rebaited and trap catches collected on a monthly basis throughout the year by collaborators across the country. Sampling was done over a two-year period. The starting date varied between sites, commencing from August to October 2006 at the majority of the sites. Sampling at Tom Burke in Limpopo Province only continued for 11 months, whereupon this site was replaced with a nearby site at Baltimore, where sampling continued for one more year.
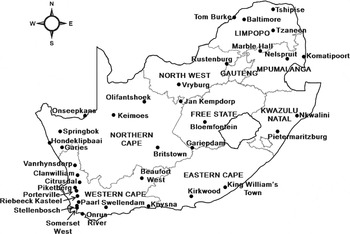
Fig. 1. The sampling areas, indicated by dots, used in South Africa to monitor Ceratitis rosa over a two-year period.
Table 1. The climatic regions represented by the sampling sites according to the Köppen-Geiger climate classification system (Kriticos et al., Reference Kriticos, Webber, Leriche, Ota, Macadam, Bathols and Scott2012). See Köppen (1936) for a detailed description of the parameters.
At each site, the relative abundance was determined by calculating the average number of flies caught per trap per month, thereby combining data from the three traps used at each sampling site, as well as combining data from all the months during which sampling was done into one single value. This resulted in a single relative abundance value for each location. Seasonal occurrence was determined by calculating the average number of flies caught per trap for each month. Thus, the fly counts from the three traps per site were averaged for each month, and the data for the two years (e.g. August 2006 and August 2007) were then again averaged, resulting in 12 monthly abundance values.
The Köppen-Geiger climate classes into which each of the trapping sites fell were estimated by spatially intersecting a point shapefile with the 10′ Köppen-Geiger zone shapefile from the CliMond dataset (Kriticos et al., Reference Kriticos, Webber, Leriche, Ota, Macadam, Bathols and Scott2012).
CLIMEX
The influence of climate on the distribution and abundance of poikilotherms has been well documented (Andrewartha & Birch, Reference Andrewartha and Birch1954, Reference Andrewartha and Birch1984; Woodward, Reference Woodward1987). This understanding has been incorporated into CLIMEX, a generic and dynamic simulation model, based on the assumption that if you know where a species lives, the climate conditions that it can tolerate can be inferred (Sutherst & Maywald, Reference Sutherst and Maywald1985; Sutherst et al., Reference Sutherst, Maywald and Kriticos2007). CLIMEX uses the ‘compare locations’ model to simulate the mechanisms that limit a species’ geographical distribution and to estimate the potential geographical distribution and seasonal abundance of a species in relation to climate (Sutherst et al., Reference Sutherst, Maywald and Kriticos2007).
CLIMEX assumes that a population may experience two types of season each year, one that is favourable for growth and one that is unfavourable, during which the population will decline (Sutherst & Maywald, Reference Sutherst and Maywald1985; Sutherst et al., Reference Sutherst, Maywald and Kriticos2007). The programme integrates a population's weekly responses to climate and uses these to calculate two types of annual indices, the growth index (GIA) and stress indices (SI) (Sutherst et al., Reference Sutherst, Maywald and Kriticos2007).
A species’ range limits are defined primarily by its ability to survive stressful conditions. CLIMEX includes the option of fitting stress functions for cold, dry, heat, wet, cold-dry, cold-wet, hot-dry and hot-wet stress indices. For some of these indices, multiple stress functions can be fitted. For example, there are three types of cold stress function based on damaging low temperatures, a day degree energetic balance and one based on average daily temperatures. Each stress index function has a characteristic range boundary shape and constitutes a hypothesis that can be tested using species distribution data.
The CLIMEX annual growth index (GIA) represents the potential for population growth and development and combines the organism's response to temperature, soil moisture and, where relevant, day-lengths and diapause. CLIMEX assumes that soil moisture is the dominant factor influencing the moisture content of vegetation, and, consequently, the microclimatic conditions in the vicinity, and the moisture index therefore describes the species’ response to the soil moisture values (Sutherst et al., Reference Sutherst, Maywald and Kriticos2007). Each of the temperature and moisture growth indices are formulated in accordance with Shelford's Law of Tolerance, incorporating a lower and upper bound at which population growth starts and stops, respectively; an optimal range in which population growth is maximized occurs between the two bounds (reviewed in Shelford, Reference Shelford1963). The individual growth indices are arranged in accordance with the Sprengel-Liebig Law of the Minimum, wherein the environmental resource in shortest supply limits population growth (reviewed in Van der Ploeg et al., Reference Van der Ploeg, Böhm and Kirkham1999). If a resource falls outside the optimal range but within the lower and upper bounds, it limits population growth, subject to the constraints of the Sprengel-Liebig Law.
In addition to the temperature and moisture stresses, the potential distribution of a species may also be constrained by a minimum length of the growing season measured in degree-days. The stress indices (SI) represent factors that reduce the population during the unfavourable season. These can be prolonged periods of cold, wet, hot or dry weather, or combinations of these factors.
CLIMEX combines the growth and stress indices into an overall ecoclimatic index (EI), ranging from 0 to 100 (Sutherst et al., Reference Sutherst, Maywald and Kriticos2007), with an EI of 0 being unsuitable and an EI of 100 being optimal all year round. Assigning classes of suitability to EI values between 0 and 100 is usually an arbitrary process intended to reduce the perceived level of model precision compared with that implied by a percentile score.
CLIMEX provides the user with two distinct data product types: (i) maps of annual summary variables, such as the ecoclimatic index (EI), the annual growth index (GIA) or the stress indices, and (ii) weekly time-series graphs of state variables such as the weekly growth index (GIW) (Sutherst & Maywald, Reference Sutherst and Maywald1985). The CLIMEX model was constructed by manually, iteratively fitting the stress parameters until the geographical distribution simulated by CLIMEX (EI ≥ 1) coincided with the South African geographic distribution, and relative abundance and seasonal phenology as gauged by the trapping data accorded with graphs of GIW (table 2). Relevant biological information (e.g. developmental thresholds and the species’ reaction to different levels of relative humidity) informed the parameter values to ensure that they were biologically plausible. Parameters for the temperature and soil moisture growth indices were mostly informed by reported experimental observations, theoretical knowledge and the phenological observations, aiming to get the start and finish dates and peak climate suitability at each site to agree with the corresponding patterns of trap abundance.
Table 2. CLIMEX parameters used to model the distribution of Ceratitis rosa, based on its distribution, relative abundance and seasonal phenology in South Africa.

The 10′ CliMond climate dataset was used within CLIMEX to represent current climate (Kriticos et al., Reference Kriticos, Webber, Leriche, Ota, Macadam, Bathols and Scott2012). The CM10_1975H_V1 dataset of historical long-term monthly climate averages for minimum and maximum temperature, precipitation and relative humidity at 0900 and 1500 hours is centred on 1975. Over the collection period, the changes in climate between the climate observations and the trapping data are likely to be relatively small (<1 °C: Rahmstorf et al., Reference Rahmstorf, Cazenave, Church, Hansen, Keeling, Parker and Somerville2007). Any errors due to a lack of contemporaneity between observations and climate data are, therefore, likely to be small at present. Where the parameters are fitted to distribution data, the errors are likely to be reflected in parameters. Such errors are self-cancelling when using the same climate dataset to fit the model and to estimate the potential range, as we have done in this paper.
Temperature index
The minimum temperature for development (DV0) was set to 8.6 °C, as this was the minimum developmental threshold determined by Grout & Stoltz (Reference Grout and Stoltz2007). The lower optimum temperature (DV1) was set to 24 °C and the upper optimum temperature (DV2) to 28 °C. This range spanned the estimated optimum developmental threshold of 27.7 °C (Grout & Stoltz, Reference Grout and Stoltz2007). The maximum temperature for development (DV3) was set to 33 °C, as determined by Grout & Stoltz (Reference Grout and Stoltz2007). Developmental temperature thresholds for C. rosa were also estimated by Duyck & Quilici (Reference Duyck and Quilici2002) using strains from Reunion. Their study resulted in an estimated lower developmental temperature threshold for the larvae than that of Grout & Stoltz (Reference Grout and Stoltz2007), as well as a lower value than for C. capitata. This suggested that C. rosa is more cold tolerant than C. capitata. However, this does not correspond to the known distribution of these two species in South Africa, where C. rosa has a more restricted distribution, as opposed to C. capitata, which is widespread and is more abundant than C. rosa in the colder regions (Grout & Stoltz, Reference Grout and Stoltz2007). Grout & Stoltz (Reference Grout and Stoltz2007) suggested there may be different biotypes of C. rosa in Reunion and South Africa. In the present study, South African distribution data is used for modelling, and it was decided to use the temperature thresholds determined for the South African biotype. The number of degree-days above DV0 needed to complete one generation (PDD) was set to 400 °C days. This was similar to the value of 429 °C days determined by Grout & Stoltz (Reference Grout and Stoltz2007) using constant temperature experiments.
Moisture index
Ceratitis rosa is sensitive to desiccation, needing an abundant water supply (Ripley & Hepburn, Reference Ripley and Hepburn1930; Myburgh, Reference Myburgh1962; Duyck et al., Reference Duyck, David and Quilici2006b), which may be the reason why it does not persist in the hot, dry inland areas of the Western Cape, as well as the Northern Cape Province of South Africa. The lower moisture threshold (SM0) was set to the same value as the threshold for dry stress (SMDS) (table 2).
Cold stress
Ripley & Hepburn (Reference Ripley and Hepburn1930) suggested that C. rosa can be expected to survive the extremes of most winter conditions in South Africa, provided there is sufficient food, water and shelter. This is because the adult flies enter a hibernation phase during which they undergo physiological changes that reduce their activity and attraction to traps (Ripley & Hepburn, Reference Ripley and Hepburn1930). However, the immature stages do not have this ability to hibernate, and development of these stages will cease when the temperature falls below the minimum developmental threshold of 8.6 °C (Grout & Stoltz, Reference Grout and Stoltz2007). Furthermore, C. rosa shows a crepuscular behaviour, mating only when the light intensity is between zero and 20 foot candles (approximately 215 lux) (Myburgh, Reference Myburgh1962). This happens from about one hour before sunset, and they stay copulated until the next morning. The minimum temperature at which mating will take place is 17 °C (Myburgh, Reference Myburgh1962) and, consequently, when the temperature during the sunset period is below 17 °C, C. rosa will not be able to mate. If this occurs for only a few months per year at a location, the eggs and larvae may still continue to develop, provided the temperature does not drop below the minimum developmental threshold for too long. However, if low temperatures during the sunset period occur for a large part of the year, the fly will not be able to persist in such areas. This is the case in the Lesotho Highlands at sites like Oxbow (28°43′S, 28°37′E), where long-term averages (1961–2005) of the daily maximum temperature during summer is below 20 °C, dropping down to below 8 °C at night (weather data obtained from the Lesotho Meteorological Services).
Vera et al. (Reference Vera, Rodriguez, Segura, Cladera and Sutherst2002) constructed a CLIMEX model to estimate the potential global distribution of C. capitata. The South African distribution range of C. capitata modelled by Vera et al. (Reference Vera, Rodriguez, Segura, Cladera and Sutherst2002) showed similarities with the distribution of C. rosa as observed from trapping, with lethal cold stress experienced in the Lesotho Highlands. De Meyer et al. (Reference De Meyer, Robertson, Peterson and Mansell2008) indicated the presence of C. rosa around the Lesotho region. Utilisation of cold stress parameter values similar to those used by Vera et al. (Reference Vera, Rodriguez, Segura, Cladera and Sutherst2002) resulted in the model appropriately indicating the Lesotho Highlands as unsuitable, but all the sites where presence of the species was observed were still modelled as suitable, including the region around Lesotho.
A degree-day cold stress mechanism similar to that of Vera et al. (Reference Vera, Rodriguez, Segura, Cladera and Sutherst2002) was fitted to the distribution data with the minimum degree-day cold stress threshold (DTCS) set to 15 °C days and the stress accumulation rate (DHCS) set to –0.001 week–1. This mechanism simulates the stress caused when temperatures are insufficient to support foraging and other activity necessary to maintain respiration losses.
Dry stress and wet stress
The dry stress parameters were fitted to exclude parts of the Western and Northern Cape Provinces where C. rosa did not occur. The dry stress threshold (SMDS) was set to 0.105, a value that approximates the permanent wilting point. Since not much is known about the response of C. rosa to soil moisture (as indicated by modelled soil moisture), the wet stress parameters of the C. capitata model of Vera et al. (Reference Vera, Rodriguez, Segura, Cladera and Sutherst2002) were used (table 2).
Relative abundance and seasonal phenology data
At each location, the single relative abundance value was compared with the EI value from the model output, both quantitatively, by visually inspecting a map where the EI values are plotted along with the relative abundance data for each site, as well as qualitatively, by determining the correlation between the relative abundance values and EI values. For each of the trapping sites, the seasonal phenology was graphically compared with the GIW values from the model output and, where necessary, the values for the moisture and temperature growth indices were adjusted to gain concordance between the threshold values (SM0 and DV0) and the seasonal onset of trap catches, and the optimal ranges (SM1, SM2, DV1 and DV2) and the period of maximum trap activity.
Results
Trapping data
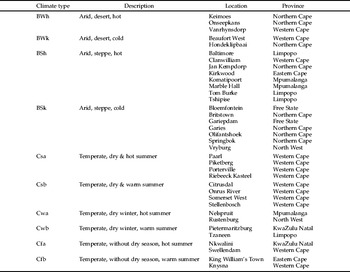
The trapping data (fig. 2) indicated that C. rosa was absent from, or only present in very low numbers, in the drier regions of the Northern Cape Province. In general, this was also the pattern observed for all arid regions across the country (BSh, BSk, BWh and BWk Köppen-Geiger climate zones) (fig. 2, table 1). A gradient was observed along the west coast of the country, with average abundance decreasing from the more moderate south (Cs climates) to the drier north (BS and BW climates) (fig. 2, table 1). Another gradient was observed in the eastern half of the country, with average abundance being higher around the coast and the north-eastern boundaries (with temperate Cw and Cf climates) (fig. 2, table 1), and decreasing towards the inland areas.
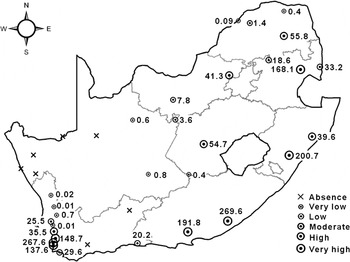
Fig. 2. The relative abundance of Ceratitis rosa in South Africa over a two-year sampling period. The following classes of abundance were used: absence: zero flies; very low: 0.01–1 fly per trap per month; low: 1.01–10 flies per trap per month; moderate: 10.01–35 flies per trap per month; high: 35.01–100 flies per trap per month; very high: >100 flies per trap per month. The average numbers of flies per trap per month are shown next to the symbols.
CLIMEX model
Native distribution, abundance and seasonal phenology
The modelled potential distribution of C. rosa in South Africa is shown in fig. 3. EI values between one and four were considered as marginal, EI values of five to nine as suitable, EI values of 10 to 29 as highly suitable and EI values of 30 and more as optimal. In terms of presence-absence data alone, this corresponds well with its known distribution, as observed during trapping. The two exceptions were Vanrhynsdorp and Swellendam (fig. 3). Vanrhynsdorp was modelled as being climatically unsuitable, but flies were observed during trapping. Swellendam was modelled as being climatically highly suitable (EI = 24), but no flies were caught in the traps. In terms of relative abundance, the modelled levels of climate suitability (EI) also generally correspond very well with the trapping data (r2 = 0.54, n = 36). Exceptions were Citrusdal (EI = 7), Tshipise (EI = 7) and Gariepdam (EI = 6), modelled as suitable, and Porterville, modelled as being highly suitable (EI = 11), whereas trap counts were very low. Conversely, Kirkwood had an EI of five, but trap counts were very high (figs 2 and 3). Considering the large number of non-climatic factors that affect fruit fly population abundance, the correlation co-efficient relating it to modelled climate suitability is remarkable.
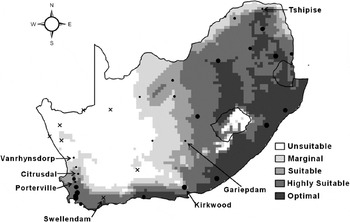
Fig. 3. The projected climate suitability for Ceratitis rosa in South Africa using the CLIMEX ecoclimatic index (EI). The relative abundance of C. rosa, as observed through trapping, is indicated by black dots with larger dots indicating higher counts. Absences are shown by black crosses. Unsuitable: EI = 0; marginal: EI = 1–4; suitable: EI = 5–9; highly suitable: EI = 10–29; optimal: EI = 30–100.
At most of the sites, the observed seasonal phenology corresponded well with the CLIMEX weekly growth indices (GIW) (see fig. 4a for examples). Exceptions were at the sites in the Western Cape Province, stretching along the west coast from Onrus River in the south to Citrusdal, where the seasonal phenology followed a similar pattern to the growth indices during the period when the GIW was positive, but flies were also observed in the traps during the period when the GIW was zero (see fig. 4b for examples). At Kirkwood and Tzaneen, C. rosa were caught in the traps in substantial numbers during the winter period during which the GIW was zero (fig. 4c).
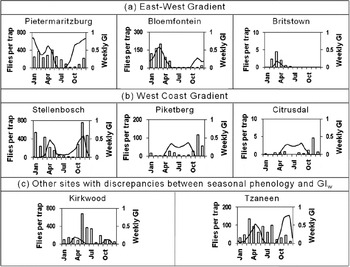
Fig. 4. Seasonal phenology, indicated by the average number of Ceratitis rosa caught per trap per month over the two-year sampling period and CLIMEX weekly growth indices (GIW), at selected sites in South Africa. (a) Sites along the east-west gradient, with higher counts in the east, decreasing towards the west. (b) Sites along the west coast gradient with higher counts in the south, decreasing towards the north. (c) Sites, besides those in (b), where discrepancies were observed between seasonal phenology and GIW. Solid black line: GIW; white columns: flies per trap.
The modelled climate suitability for Africa corresponded well with the presence data from the Fruit fly database at the Royal Museum for Central Africa (accessed via M. de Meyer), with the largest part of northern Africa being unsuitable for establishment (fig. 5). According to this database, C. rosa has also been recorded from Yaoundé in Cameroon. However, this record was not included in fig. 5, as there is uncertainty regarding its taxonomic accuracy (M. de Meyer, personal communication). The CLIMEX model also indicates a large area in central and western Africa that was modelled as climatically suitable, but for which there are no reliable presence records. In terms of climatic zones, the model fits with results from the observed South African distribution, estimating unsuitability or marginal suitability in the arid regions (Bw and Bs climates) of Africa (Kriticos et al., Reference Kriticos, Webber, Leriche, Ota, Macadam, Bathols and Scott2012).
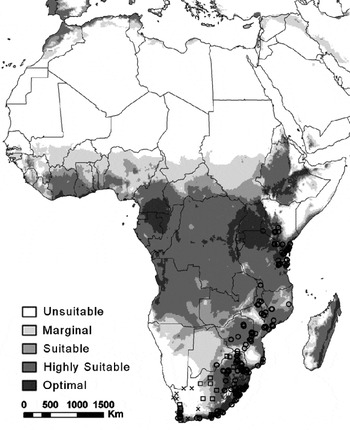
Fig. 5. The projected climate suitability for Ceratitis rosa in Africa, using the CLIMEX ecoclimatic index (EI) and Robinson's map projection. Unsuitable: EI = 0; marginal: EI = 1–4; suitable: EI = 5–9; highly suitable: EI = 10–29; optimal: EI = 30–100. (○) Localities where C. rosa has been recorded (fruit fly database held at the Royal Museum for Central Africa (accessed via M. de Meyer)). Presences of C. rosa, as observed through trapping, are shown by open squares and absences are shown by black crosses.
Potential global distribution
The modelled potential global distribution of C. rosa is shown in fig. 6. Again, the model generally estimates the arid regions (according to Köppen-Geiger) (Köppen, Reference Köppen, Köppen and Geiger1936; Kriticos et al., Reference Kriticos, Webber, Leriche, Ota, Macadam, Bathols and Scott2012) to be climatically unsuitable or only marginally suitable (fig. 6). In the Americas, the model indicates a large part of South America, Central America, Mexico, as well as some of the southern-most part of the USA to be climatically suitable. In Europe, suitable climates are restricted to some of the coastal regions of the Mediterranean mainly in parts of Portugal, Spain, Italy and Greece (fig. 6). Suitable climates in Asia are restricted to the southern and south-eastern countries (fig. 6). In Australia, all of the southern and eastern horticultural areas appear to be suitable, while in New Zealand, the major horticultural areas of the North Island, including Northland, Bay of Plenty Hawke's Bay and the Kapiti coast, appear to be suitable (fig. 6).
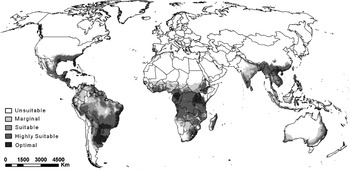
Fig. 6. The projected global climate suitability for Ceratitis rosa, using the CLIMEX ecoclimatic index (EI) and Robinson's map projection. Unsuitable: EI = 0; marginal: EI = 1–4; suitable: EI = 5–9; highly suitable: EI = 10–29; optimal: EI = 30–100.
Discussion
The CLIMEX model captures the observed distribution of C. rosa in Africa very well. The model has perfect sensitivity (all the known presences fall within areas that are estimated to be climatically suitable). The model also identifies a large area outside the known native range of C. rosa as being climatically suitable, which may be indicative of an invasive species that has not yet reached its full potential range. This type of model behaviour mirrors that of Sutherst & Bourne (Reference Sutherst and Bourne2009) for the cattle tick, Rhipicephalus (Boophilus) microplus, which had a native range extending throughout much of the known distribution of C. rosa in Africa and a modelled climatically suitable range that was also similar to that for C. rosa. The modelled invasion risks for R (B) microplus in western Africa were subsequently proven to be well founded with an established population observed deep within the previously unoccupied area that had been modelled as climatically suitable. In this case, the model was identifying the climatic potential for R (B) microplus to overcome competitive displacement from Boophilus species such as B. decoloratus (Sutherst, Reference Sutherst1987). The existence of other fruit fly species in the zones modelled as climatically suitable for C. rosa but for which there are no known records is consistent with the competitive displacement hypothesis.
The discrepancies between the estimated range and observed distribution and relative abundance at some sites may be due in part to trap placement. In Swellendam, the traps were placed on a farm next to orchards where pesticide sprays against fruit flies were applied and where other fruit fly traps were used. This may have resulted in zero trap catches, while in reality the climate may have been suitable for C. rosa, and possibly even low levels of C. rosa may have been present that were not detected during sampling. At Porterville, the low C. rosa counts in the traps did not correspond well with the EI of 11. Here, traps were placed on a farm with very few host plants in close proximity to the traps. This may have resulted in trap catches being lower than expected according to the overall level of climatic suitability of the area. Although there were apparent discrepancies between the relative abundance of C. rosa and the EI at Tshipise, the seasonal phenology followed a similar pattern to the GIW as projected by the model, indicating that the model does correspond well to the trapping data. Furthermore, the proximity of these sites to boundaries between different climate suitability zones suggests that these deviations are not serious. At Vanrhynsdorp, only two flies were found in the traps over the entire sampling period. This may have been incidental, being introduced on occasion from the south, meaning that this site is likely to be climatically unsuitable for permanent establishment.
The discrepancies between the GIW and the monthly trap catches at the Kirkwood, Tzaneen and Western Cape sites may be a result of habitat modification due to human intervention, both in the form of urban development and agricultural production. The sites in the Western Cape fall in a winter rainfall region, with the summer period being dry and warm. The natural vegetation consists of fynbos, which differs vastly from the tree-rich modified habitats in towns and agricultural production zones, made possible by irrigation, especially during summer. If 2.5mm irrigation per day is added as a top-up to natural rainfall during the months September to April (the dry summer period) to simulate this effect, the growth indices closely match the observed phenologies at these sites. This is illustrated for Stellenbosch, Piketberg and Citrusdal in fig. 7a. Similar results were obtained for Onrus River, Somerset West, Paarl and Riebeeck Kasteel. These are all areas where synthetic vegetation communities are extensive relative to the natural vegetation. Kirkwood and Tzaneen fall in a summer rainfall region, with the winter being the dry period. If 2.5mm irrigation per day (as a top-up to natural rainfall) is added during winter, the growth index projected by the model gives a better fit with the observed phenology (fig. 7b). The best fit was obtained when irrigation was added for the months May to September and April to August at Kirkwood and Tzaneen, respectively. At Kirkwood, the resulting increase in EI from five to 23 makes this site highly suitable for establishment of this pest and better matches the relative abundance observed from trapping. However, applying similar levels of irrigation to the entire country resulted in complete over estimation of the species distribution, highlighting how spatially discrete irrigation areas are within South Africa.
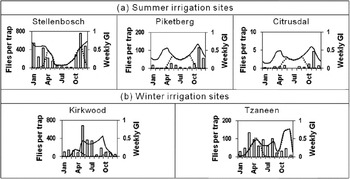
Fig. 7. Seasonal phenology, as the average number of Ceratitis rosa caught per trap per month over the two-year sampling period and CLIMEX weekly growth indices (GIW), as projected by the CLIMEX model with 2.5mm top-up irrigation added, at selected sites in South Africa. (a) Sites where irrigation was added during summer (September to April). (b) Sites where irrigation was added during winter (May to September in Kirkwood; April to August in Tzaneen). Solid black line: weekly GI with irrigation; dotted black line: weekly GI without irrigation; white columns: flies per trap.
The repeated measures of abundance and phenological data throughout the year minimise the chances that the species was not present at a particular location at the time that the trap was deployed. The parameter fitting methods for using the phenological data may benefit from a statistical optimisation method that simultaneously considers the model fit across all of the phenological data. This may avoid the problems inherent in comparing a model based on mean climatological values (averaged over 30 years) against observations for individual years, which may not be representative of long-term patterns. In the absence of such tools, it was necessary to fit these parameters manually, giving simultaneous consideration to parameter estimates from development rate experiments (e.g. Grout & Stoltz, Reference Grout and Stoltz2007) and theoretical considerations such as the need for host plants to have sufficient soil moisture above the permanent wilting point. Given the complexities of this task, it is unclear whether the parameter estimates from an automated fitting system would be more suitable.
The GARP model of De Meyer et al. (Reference De Meyer, Robertson, Peterson and Mansell2008) and the MaxEnt model of Li et al. (2009) show a similar pattern to the CLIMEX model in South Africa, where they were fitted. Globally, in areas where CLIMEX produced a positive EI, the modelled potential distribution follows a similar pattern to that indicated by the GARP model of De Meyer et al. (Reference De Meyer, Robertson, Peterson and Mansell2008). However, the GARP model estimates suitable climate in some areas where the CLIMEX model indicates zero EI. The GARP model appears to inadequately capture the effects of cold and dry stress in restricting the species’ distribution. Figure 8 shows the areas where cold and dry stress occurs, as estimated by CLIMEX. Both the GARP and PCA models of De Meyer et al. (Reference De Meyer, Robertson, Peterson and Mansell2008) indicate suitable habitat extending implausibly into cold or dry regions. Even using only the higher confidence thresholds, the GARP model presents much of central Australia as suitable, but this would seem implausibly dry. Using the same thresholds, the GARP model also indicates that much of northern Europe and central China are suitable for C. rosa to persist. In much of these areas, temperatures remain below the activity threshold for more than six months of the year, and average minimum temperatures remain below –5 °C for a month or more. The PCA model even includes regions in China where average monthly winter temperatures reach –10 °C and the extremely arid Namibian and Patagonian deserts. The South African trapping data suggests that such xeric conditions are climatically unsuitable.
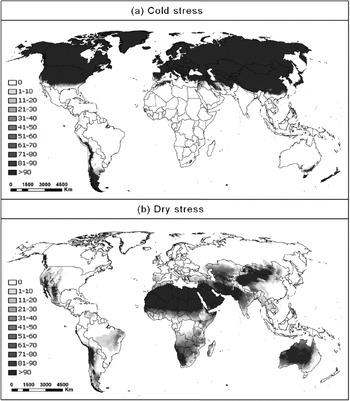
Fig. 8. Annual (a) cold stress (CS) and (b) dry stress (DS) indices calculated with the cold and dry stress parameters from table 2, respectively, and using Robinson's map projection.
Globally, the CLIMEX model of C. rosa also shows similarities to the MaxEnt model of Li et al. (2009), mostly in the areas where CLIMEX indicates higher climate suitability. However, the MaxEnt model appears over-fitted (excessively conservative). At the southeastern coast of South America, CLIMEX indicates that Buenos Aires (Argentina), Montevideo (Uruguay) and Porto Alegre (Brazil) are all of high climatic suitability for C. rosa, whereas the MaxEnt model indicates these areas to be climatically unsuitable. These sites all have similar patterns in temperature and rainfall, with the minimum temperature ranging from 6.5 to 19.9 °C, the maximum temperature from 14.7 to 29.4 °C and the weekly rainfall from 13 to 31mm. These values fall within the limits of the species, and the CLIMEX growth indices indicates that they are synchronised appropriately and hence that these sites should be climatically suitable. Similar observations were made in the southeast of the USA (e.g. Jacksonville, Atlanta and Dallas) an area which CLIMEX indicates is suitable whereas the MaxEnt model indicates it to be unsuitable. Here, the temperature and rainfall also falls within the species’ tolerance limits, suggesting that these sites are indeed climatically suitable. The area of greatest under-prediction in the model of Li et al. (Reference Li, Ma, Hu, Liu and Zhang2009) may be in the southern Chinese agricultural region, south of the Yangtze Rriver, which experiences a mild sub-tropical climate. This outcome may be due to over-fitting of the MaxEnt model, resulting from the use of inappropriate covariates or the use of goodness of fit statistics that were developed for native range models and are not well suited to selecting models for invasive species (AUC, Cohen's kappa and the True Skill Statistic), where model sensitivity is more important than model specificity (Lobo et al., Reference Lobo, Jiménez-Valverde and Real2008) or where the range equilibrium assumption they rely upon is untenable. The apparent modelling anomalies in these three correlative models (GARP, PCA and MaxEnt) reinforce concerns about their ability to produce reliable results when extrapolating into novel climates (Kriticos & Randall, Reference Kriticos, Randall, Groves, Panetta and Virtue2001; Sutherst & Bourne, Reference Sutherst and Bourne2009; Rodda et al., Reference Rodda, Jarnevich and Reed2011; Webber et al., Reference Webber, Yates, Le Maitre, Scott, Kriticos, Ota, McNeill, Le Roux and Midgley2011).
The conclusion of Grout & Stoltz (Reference Grout and Stoltz2007) that a cold-adapted biotype of C. rosa may exist on Reunion suggests that the cold range limits indicated by the CLIMEX model presented here may be conservative with regard to C. rosa sensu lato, but it does appear to be consistent with regard to the biotype(s) found throughout mainland Africa.
The use of the phenology data to aid the calibration of the temperature and soil moisture growth indices provided greater confidence in the relative climate suitability results. Whilst the possibility of using phenological data in this manner is raised in the CLIMEX manual (Sutherst et al., Reference Sutherst, Maywald and Kriticos2007), we know of no other published demonstrations of its use in model fitting. The trapping data also provided an indication of true absences, which, given the duration of the survey and proximity of sites occupied by C. rosa, can be taken as moderately strong evidence of climatic unsuitability. This rich source of data was used to explore hypotheses regarding the nature of climatic factors limiting C. rosa's potential for growth and persistence (e.g. different types of cold stress). Whilst the use of baited traps may never become a standard practice due to its costs, it may nonetheless play an important role in producing more robust models and uncovering species range boundaries where this information could usefully inform a costly biosecurity decision (e.g. Kriticos et al., Reference Kriticos, Potter, Alexander, Gibb and Suckling2007).
Acknowledgements
We would like to thank Citrus Research International (CRI), the Technology and Human Resources for Industry Programme (THRIP) and the National Research Foundation (NRF) for funding, Juanita Liebenberg from Fruitgro Science, seconded to the Department of Conservation Ecology and Entomology of the University of Stellenbosch, for technical assistance, monitors across South Africa for trap servicing, as well as the Lesotho Meteorological Services and Australian Government Bureau of Meteorology for providing weather data. Several anonymous reviewers provided useful suggestions for improving the manuscript.


