


Introduction
Climate change is expected to cause shifts in the geographical distribution of species as a result of the rearrangement of climate zones (Beever and Belant, Reference Beever and Belant2016). Hence, the magnitude of the associated impacts is projected to be higher in some regions than in others. The Latin American and Caribbean region is one of the most vulnerable areas to climate change; most of the species living there are endemic or restricted to a specific tropical ecosystem (CEPAL, 2015). Consequently, they are more susceptible to the effects of global warming because of their particular physiology and phenological qualities, which are typically adapted to narrow ecological niches (Sheldon, Reference Sheldon2019). It is anticipated that poikilothermic organisms, such as insects, whose body temperature varies according to the surrounding weather, will be strongly influenced by a volatile climate (Régnière et al., Reference Régnière, Powell, Bentz and Nealis2012). Temperature, precipitation, and other climatic parameters can directly affect the ecological interactions of insect pests; for instance, the increase in heat in the tropics allows species to colonize higher elevations and extend their geographical distributions upslope (Freeman et al., Reference Freeman, Scholer, Ruiz-Gutierrez and Fitzpatrick2018). Furthermore, climate warming resulting from increasing levels of greenhouse gases (GHGs) in the Earth's atmosphere could have a significant and highly uncertain impact on the development, distribution, and population density of agricultural insect pests (Lehmann et al., Reference Lehmann, Ammunét, Barton, Battisti, Eigenbrode, Jepsen, Kalinkat, Neuvonen, Niemelä, Terblanche, Økland and Björkman2020).
Predictions of geographical distribution changes relating to global warming are frequently included in species distribution models (SDMs) (Guisan and Zimmermann, Reference Guisan and Zimmermann2000). These models use associations between environmental variables, such as temperature, precipitation, and geographical records of species to identify the environmental conditions under which reproductive populations can be established (Peterson et al., Reference Peterson, Soberón, Pearson, Anderson, Martínez-Meyer, Nakamura and Araújo2011). SDMs have multiple applications in conservation, ecology, evolution, epidemiology, and invasive species management studies (Peterson, Reference Peterson2006). In an agricultural context, SDMs allow the assessment of the potential dispersal of exotic and invasive species to crops (Villacide and Corley, Reference Villacide and Corley2003; Beckler et al., Reference Beckler, French and Chandler2005; Campo et al., Reference Campo, Hyman and Bellotti2011), while also permitting the implementation of control and eradication programs and monitoring of these biological agents. SDMs can also assist in the selection of cultivatable areas and the declaration of phytosanitary problem-free zones (Anderson and Martínez-Meyer, Reference Anderson and Martínez-Meyer2004; Parra et al., Reference Parra, Graham and Freile2004; Phillips et al., Reference Phillips, Anderson and Schapire2006; Aluja and Mangan, Reference Aluja and Mangan2008). The advantages of these models make their use appropriate in making decisions to mitigate the effects of insect pests.
Fruit flies of the Neotropical genus Anastrepha include more than 300 species, many of which are of economic importance in the Americas and some of them of quarentenarian importance (Castañeda et al., Reference Castañeda, Osorio, Canal and Galeano2010; Tigrero and Norrbom, Reference Tigrero and Norrbom2020). The guava fruit fly (GFF), Anastrepha striata, is one of the quarentenarian species in the genus (EPPO, 2021). This species is widespread in America from the USA to Brazil, infesting 37 species belonging to 23 genera and 17 families; however, the most important host belongs to the Myrtle family (Myrtaceae) (Norrbom, Reference Norrbom2004; Gallo-Franco et al., Reference Gallo-Franco, Velasco-Cuervo, Aguirre-Ramírez, González, Carrejo and Toro-Perea2017). All surveys of fruit flies carried out in Colombia reported A. striata, but georeferenced and documented records have only been done in six of 32 Colombian departments (Castañeda et al., Reference Castañeda, Osorio, Canal and Galeano2010). In contrast to other countries, in Colombia, surveys have shown that the altitudinal distribution ranges from 16 to 2400 m (Martínez and Serna, Reference Martinez and Serna2005; Castañeda et al., Reference Castañeda, Osorio, Canal and Galeano2010; Gallo-Franco et al., Reference Gallo-Franco, Velasco-Cuervo, Aguirre-Ramírez, González, Carrejo and Toro-Perea2017). Further studies related to this species biology are lacking, only some regarding distribution range; sexual behavior (Pérez-Staples and Aluja, Reference Pérez-Staples and Aluja2004), pheromones (Cruz-López et al., Reference Cruz-López, Malo and Rojas2015), host use (Saavedra-Díaz et al., Reference Saavedra-Díaz, Galeano-Olaya and Canal2017), and genetic structure (Gallo-Franco et al., Reference Gallo-Franco, Velasco-Cuervo, Aguirre-Ramírez, González, Carrejo and Toro-Perea2017) have been carried out. The distribution of fruit fly species in Colombia is also related to the presence of its primary host plant (Castañeda et al., Reference Castañeda, Osorio, Canal and Galeano2010). A. striata is mainly associated with Myrtaceae; this family encompasses nearly 180 species in Colombia, distributed across all vegetation type communities and altitudinal gradients, being species adapted to very humid lowlands and to highland paramo (Parra, Reference Parra2014). According to Saavedra-Díaz et al. (Reference Saavedra-Díaz, Galeano-Olaya and Canal2017), fruit flies in Colombia do not use the same fruit or host in the same region, i.e., host partitions. This species has been reported on guava crops, turning into a plague with significant negative impacts on fruit production (Insuasty et al., Reference Insuasty, Cuadro, Monroy and Bautista2007; Martínez-Alava, Reference Martinez-Alava2007; Castañeda et al., Reference Castañeda, Osorio, Canal and Galeano2010).
In Colombia, guava is one of the top five species of economic importance and is a significant crop in Colombian agriculture as an essential product of small and intermediate producers (Agronet, 2018). The damage caused by A. striata can be devastating; total losses of 90% of the crop have been documented in recent decades (Núñez et al., Reference Núñez, Gómez, Guarín and León2004). The potential distribution of fruit flies as part of pest management has been considered in the United States (Sequeira et al., Reference Sequeira, Millar and Bartels2001), Europe (Godefroid et al., Reference Godefroid, Cruaud, Rossi and Rasplus2015), and globally for Anastrepha obliqua (Fu et al., Reference Fu, Li, Huang, Wu, Ni and Qü2014). In Colombia, integrated pest management (IPM) against fruit flies has been proposed by governmental institutions (Instituto Colombiano de Agropecuario [ICA], 2016); however, none of these initiatives have included potential distribution or spatial distribution modeling. The aim of this study was to model the potential distribution of A. striata and to assess the establishment risk in Colombia under current and possible future climate change scenarios. The resulting maps and data may provide a broad geographical perspective for decision-making in area-wide and local fruit fly management for guava crops and could be informative about the behavior of the species in other countries.
Materials and methods
Geographical records
Geographic records of A. striata were compiled from specimens deposited at the following entomological collections: Colección Entomológica de la Universidad de Antioquia, Medellín, Antioquia, Colombia (CEUA), Colección Entomológica de la Universidad Nacional de Colombia, Sede Palmira, Valle del Cauca, Colombia (CEUNP), Colección Taxonómica Nacional Luis María Murillo, ICA Tibaitatá, Mosquera, Cundinamarca, Colombia (CTNI), Colección Entomológica Forestal Universidad Distrital Francisco José de Caldas, Bogotá, Cundinamarca, Colombia (EF-UDFJC), Colección de Insectos del Instituto de Investigación de Recursos Biológicos Alexander von Humboldt, Villa de Leyva, Boyacá, Colombia (IAVH), Colección de Insectos del ICA Palmira, Valle del Cauca, Colombia (ICA-P) Colección de Zoología, Instituto de Ciencias Naturales, Universidad Nacional de Colombia, Sede Bogotá, Cundinamarca, Colombia (ICN), Museo Entomológico ‘Francisco Luis Gallego’, and Universidad Nacional de Colombia, Sede Medellín, Antioquia, Colombia (MEFLG); secondary sources, including articles and databases, were also used (Supplementary Table S1). For an adequate geographical interpretation, a figure with the maps of the administrative boundaries (‘Departments,’ as they are locally known in Colombia), natural regions, digital elevation models, and the location of some geographical features is referred to throughout the text (fig. 1).
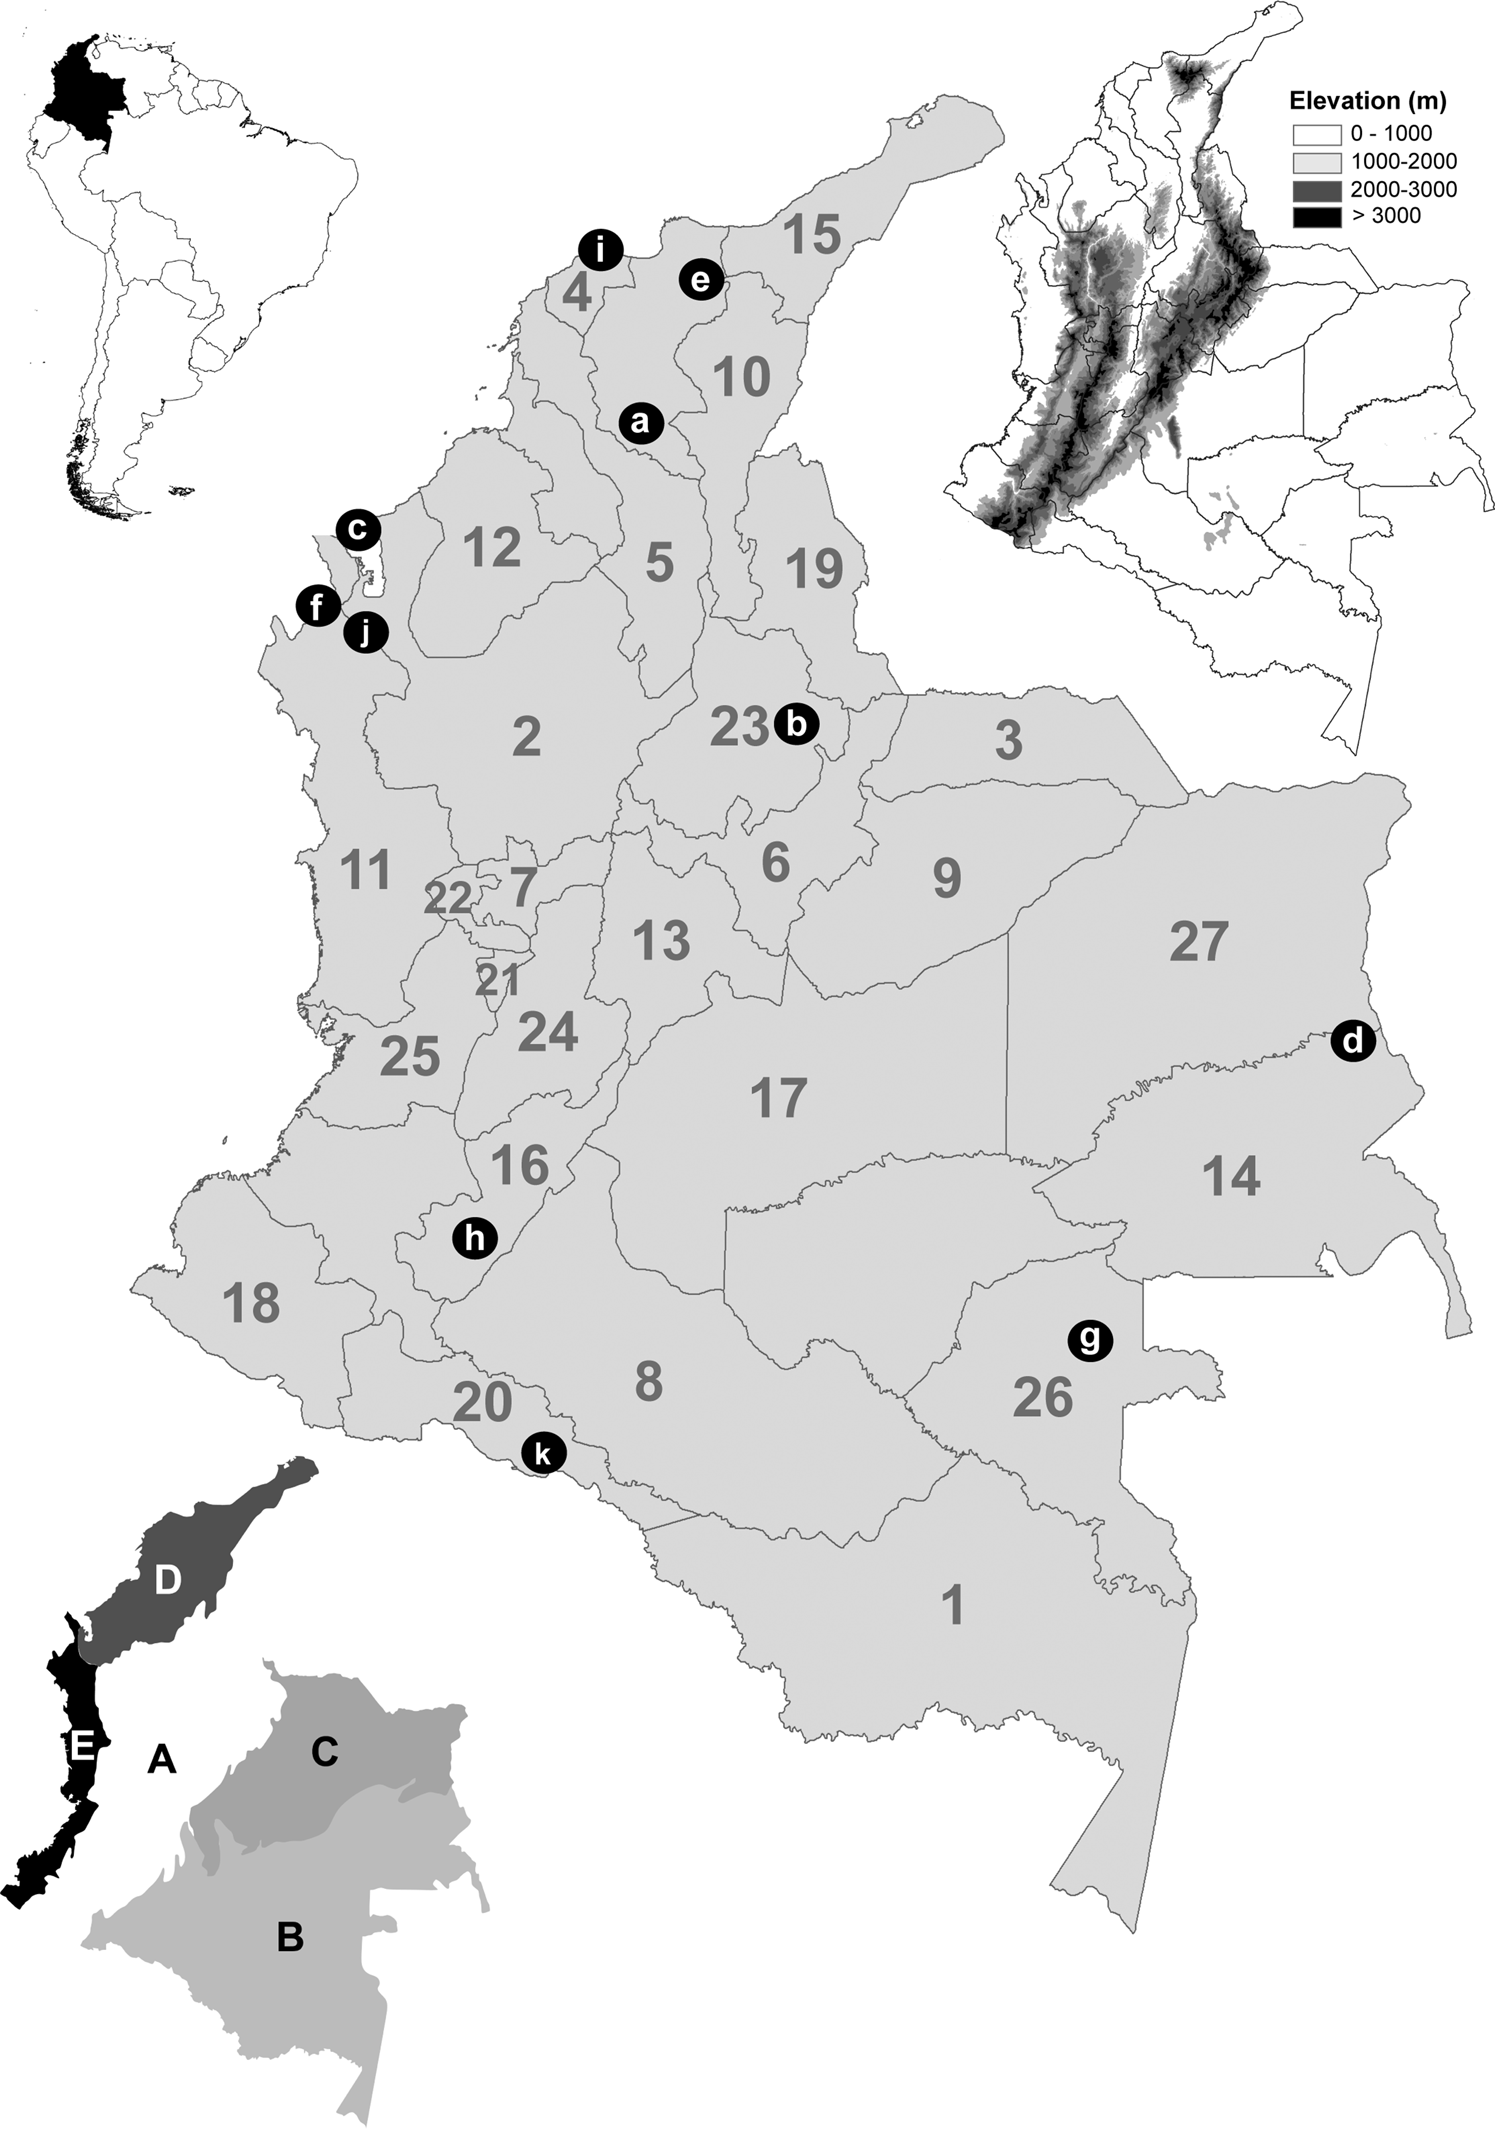
Figure 1. Location of Colombia in South America (top left). Digital elevation map (top right) in m. Map of administrative boundaries (center) (number of each department in gray) (1) Amazonas; (2) Antioquia; (3) Arauca; (4) Atlántico; (5) Bolívar; (6) Boyacá; (7) Caldas; (8) Caqueta; (9) Casanare; (10) Cesar; (11) Chocó; (12) Córdoba; (13) Cundinamarca; (14) Guainia; (15) Guajira; (16) Huila; (17) Meta; (18) Nariño; (19) Norte de Santander; (20) Putumayo; (21) Quindío; (22) Risaralda; (23) Santander; (24) Tolima; (25) Valle del Cauca; (26) Vaupes; (27) Vichada. Referenced localities are indicated with black dots and white letters. (a) Depresión Momposina; (b) Cañon del Chicamocha; (c) Golfo de Uraba; (d) Inirida interfluvial region; (e) Sierra Nevada de Santa Marta; (f) Serrania del Darien; (g) Vaupes River; (h) Valle de Laboyos; (i) Salamanca National Park; (j) Los Katios National Park; (k) La Paya National Park. Five natural regions (bottom left) (IGAC, 2021) (A) Andes; (B) Amazon; (C) Orinoquia; (D) Caribbean; and (E) Pacific.
Climatic information
Bioclimatic variables were gathered from the WorldClim 1.4 climate data archive (Hijmans et al., Reference Hijmans, Cameron, Parra, Jones and Jarvis2005; table 1) in the form of 19 bioclimatic data layers, summarizing potentially relevant climate dimensions at a 30 arc-second (1 km) spatial resolution. The data were derived from monthly precipitation and temperature values, appropriate to the biological requirements of A. striata in terms of temperature, precipitation, seasonal trends, and extreme or limiting environmental factors (Hijmans et al., Reference Hijmans, Cameron, Parra, Jones and Jarvis2005). Bioclimatic data layers incorporating global climate change were calculated using a general circulation model (GCM) for different scenarios. The MIROC5 Global Climate model was selected to include variation and uncertainty among climate change mathematical simulations (Yañez-Arenas et al., Reference Yañez-Arenas, Peterson, Rodríguez-Medina and Barve2016). The years 2050 and 2070 were considered as future time slices under two emission scenarios: representative concentration pathways (RCPs) 2.6 and 8.5. They were consistent with a wide range of possible changes in future anthropogenic (i.e., human-caused) GHG emissions and aimed to represent their atmospheric concentrations in different scenarios (Ward et al., Reference Ward, Mohr, Myers and Nel2012). RCP 2.6 presumes that global annual GHG emissions (measured in CO2 equivalents) peak between 2010 and 2020, with emissions declining substantially thereafter (Meinshausen et al., Reference Meinshausen, Smith, Calvin, Daniel, Kainuma, Lamarque, Matsumoto, Montzka, Raper, Riahi, Thomson, Velders and van Vuuren2011). Under RCP 8.5, emissions continue to rise throughout the 21st century (Meinshausen et al., Reference Meinshausen, Smith, Calvin, Daniel, Kainuma, Lamarque, Matsumoto, Montzka, Raper, Riahi, Thomson, Velders and van Vuuren2011).
Table 1. Bioclimatic variables used in modeling the potential distribution for A. striata in Colombia

An essential element in the development of ecological niche models is the hypotheses of areas (M) that have been accessible to the species (Barve et al., Reference Barve, Barve, Jiménez-Valverde, Lira-Noriega, Maher, Peterson, Soberón and Villalobos2011). Based on the presence records and the terrestrial ecoregions of the world proposed by the World Wildlife Foundation (Olson et al., Reference Olson, Dinerstein, Wikramanayake, Burgess, Powell, Underwood, D'amico, Itoua, Strand, Morrison, Loucks, Allnutt, Ricketts, Kura, Lamoreux, Wettengel, Hedao and Kassem2001), the area M was estimated to calibrate the model. Charted Colombian administrative boundaries (fig. 1) were used as the area for the final projection model. According to the variable contributions calculated by the jackknife analysis and the Pearson correlation coefficients, variables were selected to be retained for further evaluations. If two variables had a correlation of >|0.8|, the highly contributing variable was preferred over the other (Raghavan et al., Reference Raghavan, Barker, Cobos, Barker, Teo, Foley, Nakao, Lawrence, Heath and Peterson2019). In the current and future models, nine bioclimatic variables were used (table 1).
Model design
The potential distribution model was generated with a maximum entropy algorithm incorporated in MaxEnt v.3.3.3k (Phillips et al., Reference Phillips, Anderson and Schapire2006). The partial receiver operating characteristic (pROC) statistics were applied for only the current model to the 50% subset of occurrences left out before model calibration for testing. pROC was chosen as a significance test in light of critiques of the appropriateness of traditional ROC approaches (Peterson et al., Reference Peterson, Papes and Soberón2008). This metric was used to test the statistical significance of ecological niche model predictions. A value of 1.0 was equivalent to the performance of a random classifier. These results were based on 100 bootstrap replicates, and statistical significance was assessed by bootstrapping and comparison with a random classifier ratio of 1.0, according to the significant sensitivity of this algorithm to particular parameter settings. A detailed model selection exercise was conducted using the ENMeval R package. This provided an automated method to execute MaxEnt models across a user-specified range of regularization multiplier (RM) values and feature combinations (FCs) (Muscarella et al., Reference Muscarella, Galante, Soley-Guardia, Boria, Kass, Uriarte and Anderson2014). The RM range was set from 0.5 to 4.0 in increments of 0.5, and three FCs, i.e., linear (L); linear and quadratic (LQ); linear, quadratic, and product (LQP); linear, quadratic, product, and threshold (LQPT); linear, quadratic, product, threshold, and hinge (LQPTH), were employed, resulting in 45 possible combinations of features and RMs (Muscarella et al., Reference Muscarella, Galante, Soley-Guardia, Boria, Kass, Uriarte and Anderson2014). The fine-tuned MaxEnt models were made by seeking the lowest delta value of Akaike's information criterion, which was corrected for small sample sizes (AICc) among the candidate models, reflecting both model goodness-of-fit and complexity to provide the most conservative results (Basanta et al., Reference Basanta, Rebollar and Parra-Olea2019). The model with the lowest delta AICc score was selected; it had a parameterization of RM of 2.0 and an LQHP FC and exhibited good predictive performance.
A total of ten model replications were implemented through bootstrapping tools. The medians were used through repetitions as a final niche estimation (Altamiranda-Saavedra et al., Reference Altamiranda-Saavedra, Arboleda, Parra, Peterson and Correa2017). A final set of models was built using the ‘logistic’ output and 10,000 background points (Barbet-Massin et al., Reference Barbet-Massin, Jiguet, Albert and Thuiller2012). All models were converted to binary using a threshold of training omission rate with an error rate of E = 5%. The threshold selection methods were based on lower threshold values, i.e., with a broader distribution of suitable habitat and close to zero omission errors. To predict variations in the spatial distribution, the expansion and contraction in the dispersion area were estimated through pairwise ranking between the two binary distribution models (current and future distribution models) through the SDMtoolsbox tool in ArcGIS 10.3. The range of median values was calculated across all models for RCPs 2.6 and 8.5, and the estimated variance among models was considered as a measure of uncertainty using ArcGis 10.3 (Peterson et al., Reference Peterson, Cobos and Jiménez-García2018). Finally, to assess the model's transferability, a variance partitioning approach was used to compare the estimates of environmental suitability in the SDM prediction maps on a pixel-by-pixel basis across different maps and to characterize the proportion of variance in the estimates of suitability attributable to individual factors (Diniz-Filho et al., Reference Diniz-Filho, Nabout, Telles, Soares and Rangel2009). As Supplementary material, all models are available to download in the .KMZ format (Supplementary Material 2).
Current risk of establishment of A. striata in municipalities
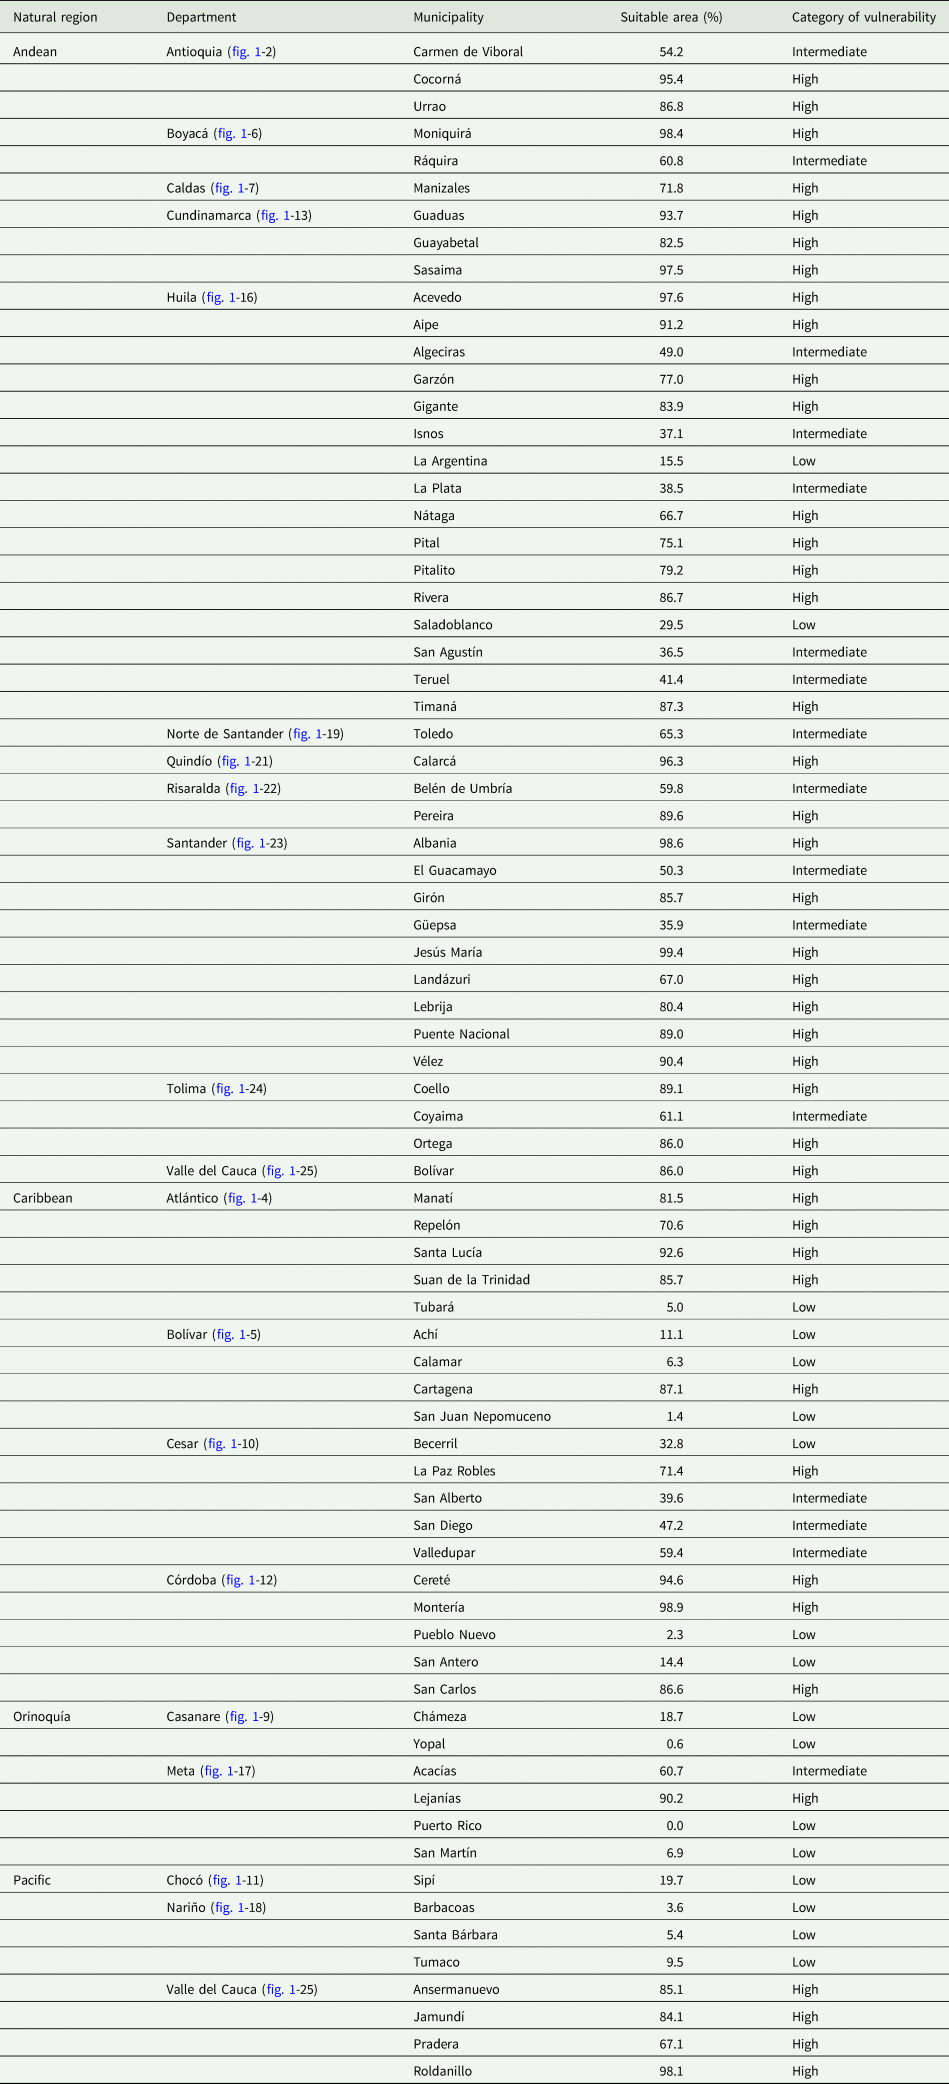
A preliminary list of 75 guava-producing municipalities was generated by consulting annual reports from the ICA (Instituto Colombiano Agropecuario) Phytosanitary Surveillance and Epidemiology Technical Division (ICA, 2020). The area at risk for A. striata establishment was measured as the percentage of suitable space in the current potential distribution model by each municipality using ArcGIS 10.3. Consequently, the 75 districts were classified in the following way: units with coverage below 33% were considered low vulnerability; those with coverage between 33 and 66% had intermediate vulnerability; and those with coverage above 66% had high vulnerability.
Results
A total of 211 geographical records of A. striata were collected at elevations ranging from 6 to 3044 m (fig. 2a); most were located in the Andean region (fig. 1A) (Colombian natural regions; IGAC, 2021). The percentage contribution of the bionomical variables is shown in table 1. The final model for current environmental conditions showed an extensive suitable area for A. striata establishment, mainly in the Andean region (fig. 1A). There was less establishment risk in the Caribbean (fig. 1D) and Pacific regions (fig. 1E), and it was almost nonexistent in the Orinoquia (fig. 1C) and Amazonian regions (fig. 1D). Despite the notable absence of suitable areas in the Amazonian region, the current model (fig. 2a) included the interfluvial areas of the Inírida, Guainía, and Vaupés rivers (fig. 1, localities d, g), the surrounding jurisdiction of Mitú in Vaupes (fig. 1g -26), southwestern Putumayo (fig. 1-20), and the western area of La Paya National Natural Park (fig. 1, locality k) as suitable for A. striata establishment. Omission errors were evidenced in locations such as Leticia in southern Amazonas (fig. 1-1), southwestern Putumayo (fig. 1-20), Orinoquian localities (northeastern Vichada [fig. 1-27] and northern Arauca [fig. 1-3]), and the Caribbean of central Guajira (fig. 1-15). The currently unsuitable areas for the establishment of A. striata (fig. 2a) were as follows: the Caribbean region, a large part of the xerophytic formations in northern Guajira (fig. 1-15), areas of Salamanca National Park (fig. 1, locality i), the Depresión Momposina (fig. 1, locality a), Sierra Nevada de Santa Marta (fig. 1, locality e), and swamp complexes in eastern Cordoba (fig. 1-12). The areas above the 2050 m elevation along the Andean region were also unsuitable, including all high-altitude areas of the Andean paramos complex (fig. 1A), the foothills of western Norte de Santander (fig. 1-19), eastern Boyacá (fig. 1-6), and Cundinamarca (fig. 1-13), and the surrounding areas of El Cañon de Chicamocha (fig. 1, locality b) and Valle de Laboyos in Huila (fig. 1, locality h). Extensive areas of tropical rainforest (TRF) in the Pacific and Amazon (fig. 1B, E) were deemed unsuitable, as were the savannas in the Orinoquia region (fig. 1C).

Figure 2. (a) Potential distribution of A. striata in Colombia for the current environmental conditions (suitable areas in gray); red dots are the localities of the compiled geographical records. (b) Uncertainty of models in the range of median values of GCMs for A. striata. The color scale represents the degree of variance (blue: low; red: high). (c) Locations of guava-producing municipalities and their vulnerability category for A. striata establishment under the current climatic scenario (red: high; yellow: intermediate; green: low).
Potential distribution under climate change scenarios
Significant levels of uncertainty in climate change models were found, especially in the Andean region (fig. 3). An increase in the area suitable for A. striata establishment was observed in all climate change scenarios (fig. 4a–d). This result was more pronounced in the most pessimistic GHG emission scenario (RCP 8.5) for both temporal projections in 2050 and 2070 (fig. 4b, d). According to the analysis of predicted changes in suitable habitat and the associated potential distributions, the greatest extent of the possible area increase for A. striata was predicted under the RCP 8.5 scenario by 2050 (fig. 4b) with an increased area of 520,071 km2 (table 2). Remarkably, this expansion was predicted to occur mainly in the Amazonian natural region (fig. 1b), including the departments of Caquetá (fig. 1-8), Amazonas (fig. 1-1), Vaupés (fig. 1-26), Guainía (fig. 1-14), and Putumayo (fig. 1-20). In contrast, RCP 2.6 predicted reductions in the area (i.e., contraction area) by 2050, with a potential decrease of more than 52,808 km2 (table 2). This effect was especially distinct in the northern area of the Pacific region, specifically in the Chocó department (figs 1-11 and 4a).

Figure 3. Potential distribution of A. striata in Colombia based on climate change scenarios: (a) 2050 under RCP 2.6, (b) 2050 under RCP 8.5, (c) 2070 under RCP 2.6, and (d) 2070 under RCP 8.5.
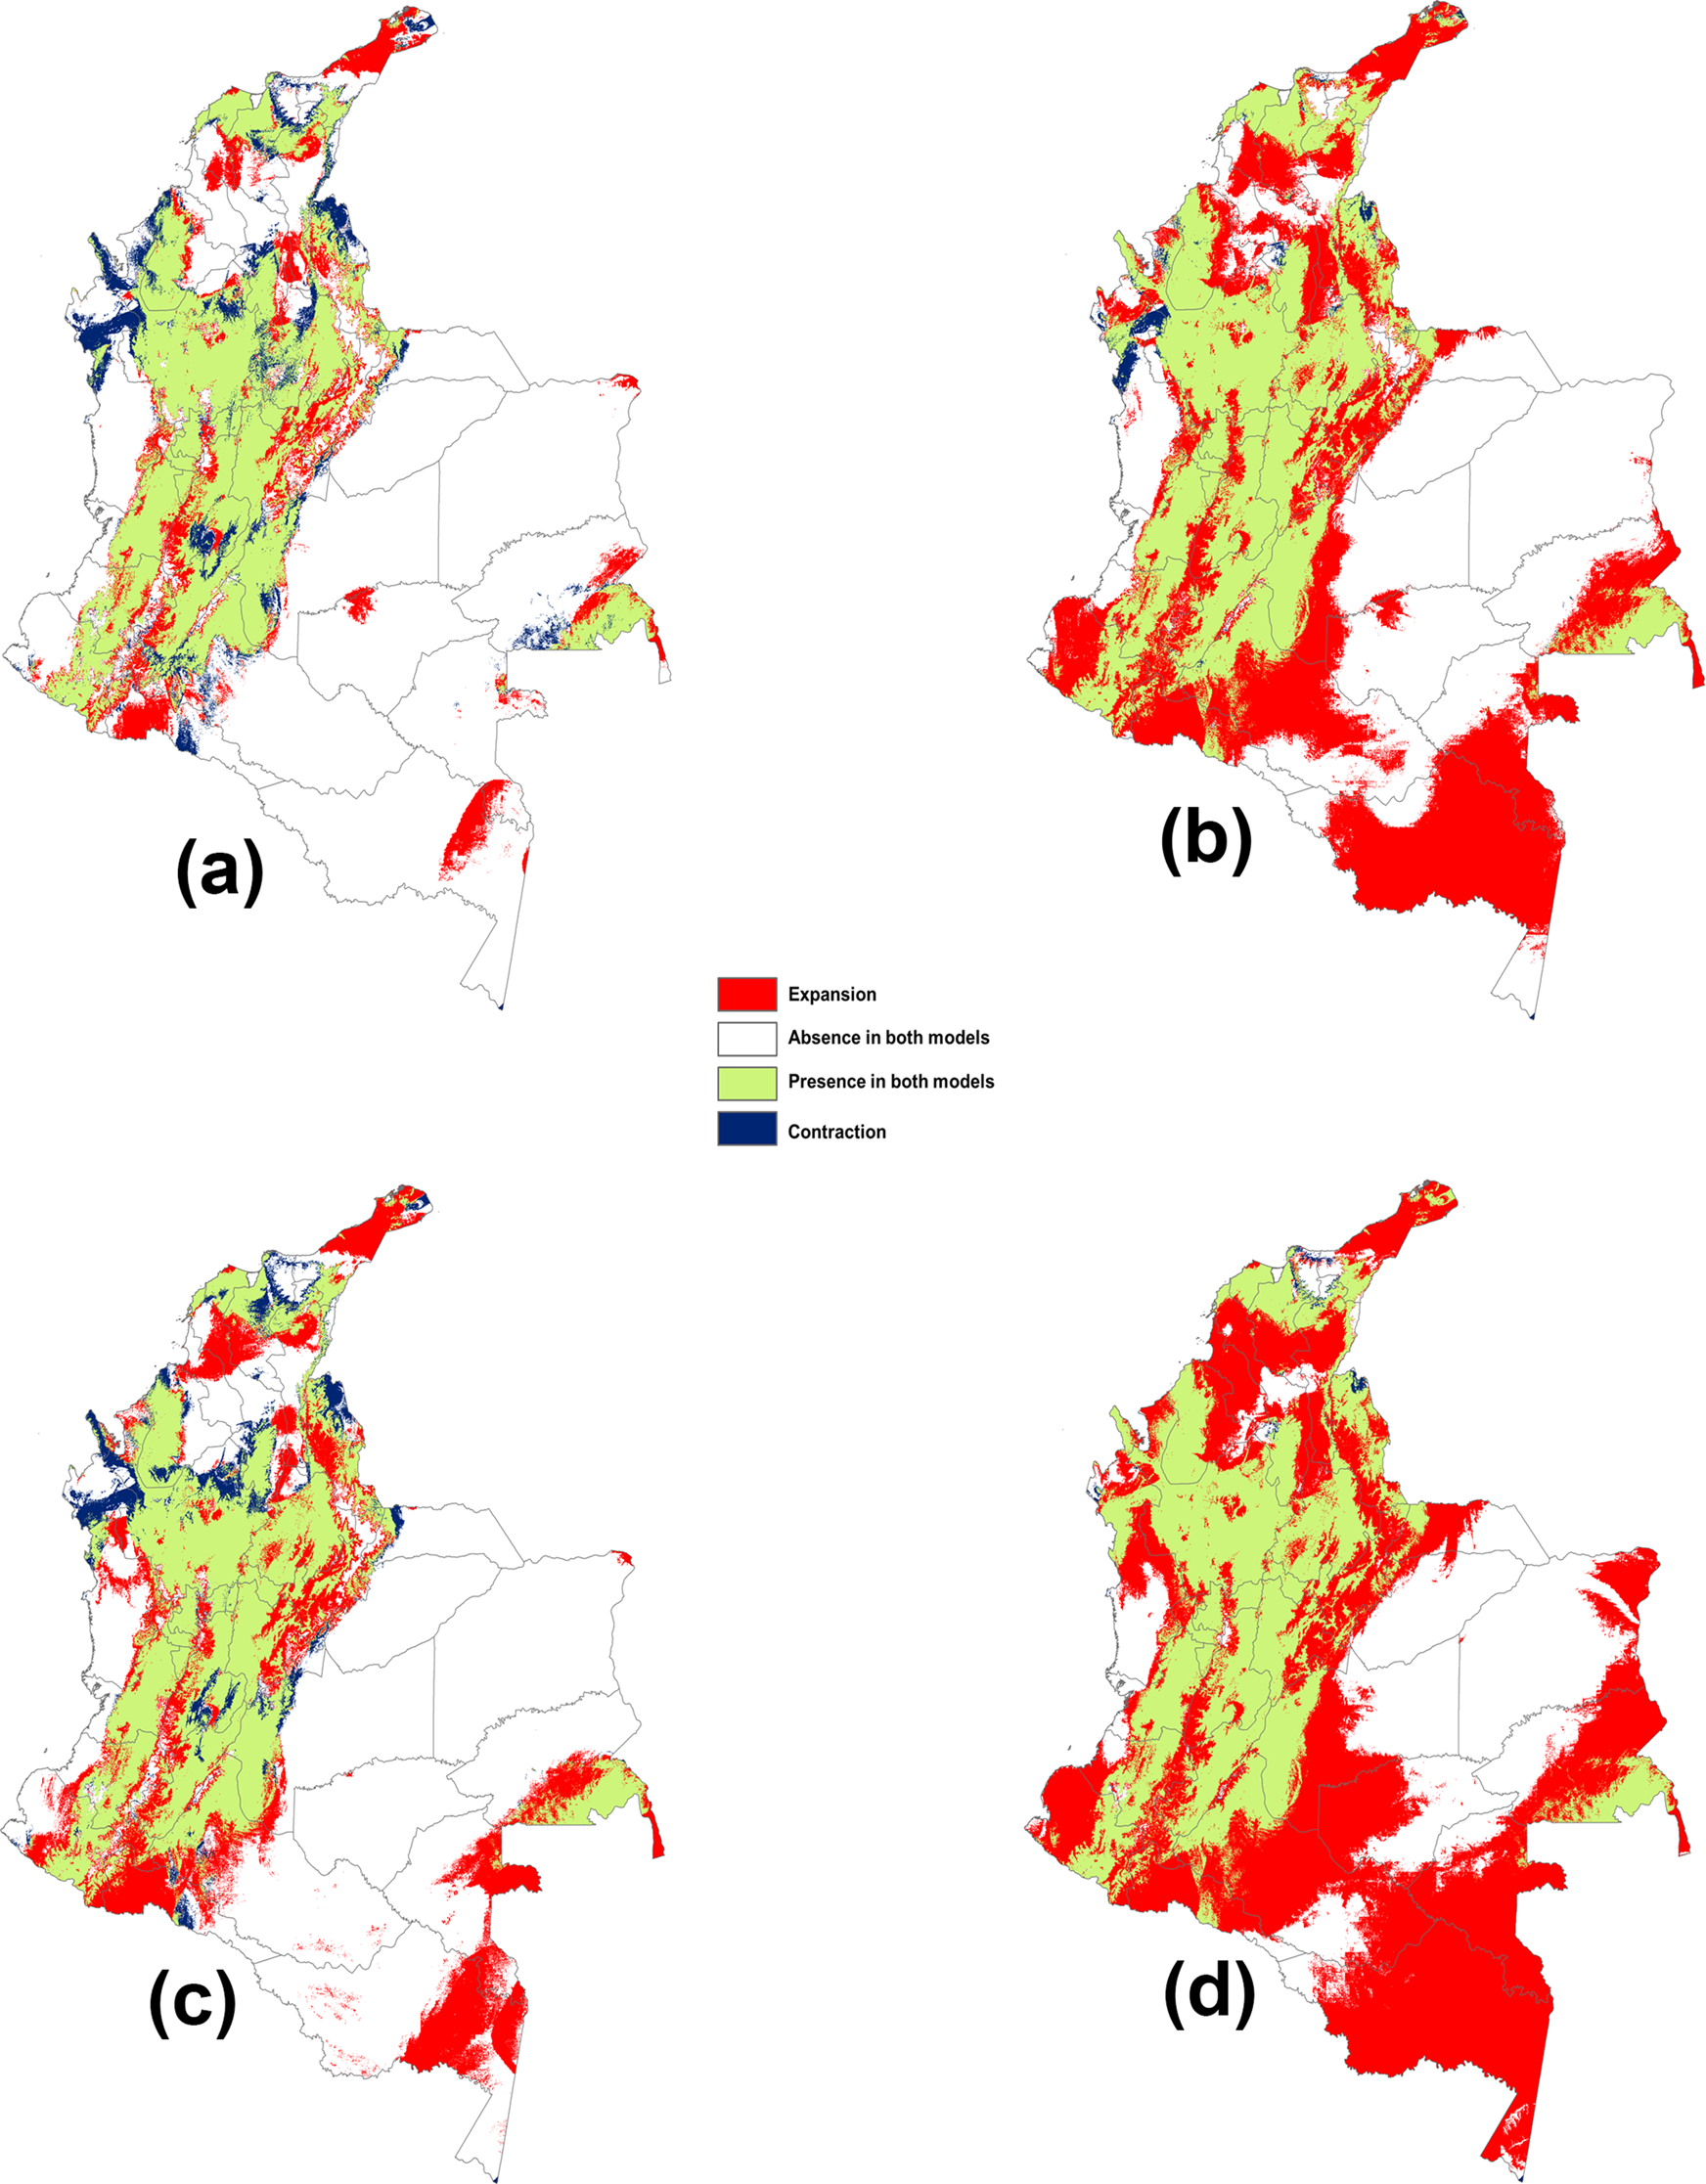
Figure 4. Changes in suitable climatic spaces for A. striata and the potential distributions between current and future conditions in Colombia: (a) current vs. time 2050 under RCP 2.6, (b) current vs. 2050 under RCP 8.5 (c) current vs. 2070 under RCP 2.6, and (d) current vs. 2070 under RCP 8.5.
Table 2. Changes in the potential distribution area (km2) of A. striata in Colombia between different climatic scenarios

Current risk of establishment of A. striata in municipalities
Forty-eight guava-producing municipalities in Colombia are located in the Andean region (fig. 1A), 18 in the Caribbean region (fig. 1D), 8 in the Pacific region (fig. 1E), and 6 in the Orinoquia region (figs 1C and 2c). Of these municipalities, 56% were categorized as highly vulnerable to the establishment of A. striata; 21% had intermediate vulnerability, and 23% had low vulnerability (fig. 2c and table 3).
Table 3. List of guava-producing municipalities and their respective risk category for the establishment of A. striata according to the area deemed suitable by the ecological niche model under current climate conditions in Colombia
Discussion
This study was the first regional (northwest South America) study to use ecological niche modeling to assess the potential distribution of a fruit fly species of economic importance under global climate change scenarios. Additionally, this study was the first to consider the risk of pest establishment according to administrative boundaries to configure regional policies and decision-making. The results showed that in Colombia, (i) under the current environmental model, the suitable areas for the establishment of A. striata were located mainly in the Andean region, with some risk areas in the Caribbean region and to a lesser extent in the Pacific, Orinoquia, and Amazonian regions. High-spatial alignment with geographical records has been recently reported by Rodriguez et al. (Reference Rodriguez, Norrbom, Arevalo, Balseiro, Diaz, Benitez, Gallego, Cruz, Montes, Rodriguez, Steck, Sutton, Quisberth, Lagrava and Colque2018). (ii) The climate change models showed an increase in suitable areas for the establishment of A. striata in response to global warming, and (iii) high-environmental suitability for the establishment of populations was evidenced in the guava-producing municipalities in Colombia. Distribution patterns of fruit flies should be influenced by host distribution, natural enemies, other fruit fly species, and/or climate conditions. Our results indicated that A. striata currently inhabits a significant portion of Colombian territory, probably because of its thermal physiological plasticity (Baker et al., Reference Baker, Stone, Plummer and McPhail1944) and all abovementioned faunistic interactions acting together.
Data on Colombian GFF hosts are widely lacking; however, species of Myrtaceae, its main hosts, could be found through a wide altitudinal range (Parra, Reference Parra2014); due to the effect of the host on insect distribution (Castañeda et al., Reference Castañeda, Osorio, Canal and Galeano2010; Salazar-Mendoza et al., Reference Salazar-Mendoza, Peralta-Aragón, Romero-Rivas, Salamanca and Rodriguez-Saona2021), A. striata may use the available host species according to altitude. In Colombia, guava is parasitized by A. striata, A. obliqua, Anastrepha fraterculus s.l., and Anastrepha ornata (Núñez et al., Reference Núñez, Gómez, Guarín and León2004; Castañeda et al., Reference Castañeda, Osorio, Canal and Galeano2010; Saavedra-Díaz et al., Reference Saavedra-Díaz, Galeano-Olaya and Canal2017). However, Saavedra-Díaz et al. (Reference Saavedra-Díaz, Galeano-Olaya and Canal2017) found that, in the studied ecosystems, two species of Anastrepha do not use the same resource, and guava parasitization by A. obliqua is accidental; only GFF was the Tephritid fly in guava. An uncommon species, A. ornata, had been reared from guava (Castañeda et al., Reference Castañeda, Osorio, Canal and Galeano2010), but it is scarce and only occurs at high altitudes. The other two species, A. striata and A. fraterculus s.l., are frequently found on guava; however, they showed altitudinal separation. Núñez et al. (Reference Núñez, Gómez, Guarín and León2004) found that at 1700–1900 m, more than 90% of flies from guava were A. striata, and fewer were A. fraterculus, but the opposite trend was observed in coffee crops. A. fraterculus were primarily obtained from infested Myrtaceae collected at over 2000 m altitude, and GFF under 1000 m. Among the GFFs collected and referred to by Castañeda et al. (Reference Castañeda, Osorio, Canal and Galeano2010) from traps over 2000 m specimens of A. striata were scant (N.A. Canal, unpublished data). Among 16 species collected from traps, Salazar-Mendoza et al. (Reference Salazar-Mendoza, Peralta-Aragón, Romero-Rivas, Salamanca and Rodriguez-Saona2021) found the same three fruit fly species from guava in the altitudinal transect in Peru, with A. fraterculus predominant in lowlands and A. striata in highlands. Among species in the A. fraterculus complex, those from lowlands in Peru were different from those from highlands in Peru, Ecuador, and Colombia (Hernández-Ortiz et al., Reference Hernández-Ortiz, Canal, Salas, Ruíz-Hurtado and Dzul-Cauich2015).
In Colombia, fruit fly species may be in places with very low variability in weather conditions, thus exhibiting hierarchical competition. There is a competitive displacement from the host to the less adapted species (Duyck et al., Reference Duyck, David and Quilici2004) due to being genetically adapted to climatic conditions, i.e., the host is not the main factor for geographical distribution; it is the weather. Under scenarios of climatic change in temperate regions, fruit flies could be moved to similar Colombian behaviors. Natural enemies could affect fruit fly distribution. Surveys reporting parasitoids, such as the fruit-infesting Tephritid in Colombia, were summarized by Ruíz-Hurtado et al. (Reference Ruíz-Hurtado, Ramírez, Rojas, Galeano and Canal2013) and Cruz-B et al. (Reference Cruz-B, Bacca and Canal2017). Data have shown that parasitism is low, similar to other countries, and a high species turnover according to the altitudinal range, i.e., parasitoids are adapted to weather conditions, but fly species are not. Similar conclusions were found by Salazar-Mendoza et al. (Reference Salazar-Mendoza, Peralta-Aragón, Romero-Rivas, Salamanca and Rodriguez-Saona2021) in an altitudinal transect from Peru where parasitism was similar among altitudes, but parasitoid richness was different. Other biological factors could affect fruit fly populations, but they are largely unknown around the world. From the biological point of view, Colombian weather conditions are stable throughout the year in the same place, and there are differences only by altitude variation; in GFF and perhaps other fruit fly species and insect species, weather must be the principal factor for distribution. Thus, models developed in this paper reflect A. striata behavior and can act as a guide for other countries under climatic scenarios.
Our omission errors may be the result of the retrieved geographical record attributes of A. striata, which were mainly based on two sources: the first came from five departmental initiatives (control programs) (Castañeda et al., Reference Castañeda, Osorio, Canal and Galeano2010) and the second came from sporadic records of specimens deposited in entomological collections. These data show the lack of comprehensive surveys of fruit flies in Colombia; systematic collections were carried out mainly in the mountain ecosystem, and data from the eastern plains and Amazonian and Pacific regions are scarce (Herrera-Buitrago et al., in prep.). Optimal biological data are a crucial aspect for good results in distribution models. Despite these circumstances, the current distribution model coincided with previous information, which showed that guava fruit flies were common in Colombia, as summarized by Rodriguez et al. (Reference Rodriguez, Norrbom, Arevalo, Balseiro, Diaz, Benitez, Gallego, Cruz, Montes, Rodriguez, Steck, Sutton, Quisberth, Lagrava and Colque2018); additionally, the results of the statistical validation of the model under the current environmental conditions showed adequate statistical support.
The most influential variables of A. striata occurrence were temperature- and precipitation-related variables (table 1). These results aligned with those of Porter et al. (Reference Porter, Parry and Carter1991). The models also indicated the absence of flies in cold localities at high altitudes, such as paramo ecosystems; the paramo is distributed along the top of the Andean ranges (fig. 1a) and the upper Sierra Nevada de Santa Marta (fig. 1, locality e). Despite the existence of Myrtaceae in these altitudinal floors, in samplings carried out in these ecosystems, A. striata was not collected (N.A. Canal, unpublished data). This suggests that the absence of A. striata in paramo may be because it does not adapt physiologically to these ecosystems.
Additionally, very humid regions with high-precipitation levels (TRFs), such as the Serrania del Darien (fig. 1, locality f) and most forested areas of the Pacific (fig. 1E) and Amazonian region (fig. 1B), were identified as having low suitability for the flies. The area suitable for A. striata in the Pacific region was mainly located in northern Chocó (figs 2A and 1-11) in extensive areas bordering Golfo de Uraba (fig. 1, locality c) and in a small area in the Nariño department (fig. 1-18). However, the map indicates suitability in the interfluvial area of the Inírida (fig. 1, locality d), Guainía, and Vaupés rivers and the surroundings of the jurisdiction of Mitú (fig. 1, locality g) in the Orinoquia and Amazonian regions. The establishment of A. striata must be interpreted cautiously since the precarious conditions of the soils, where it is common to find rocky outcrops and floristic associations of monocotyledons (Hernández-Camacho and Sanchez-Páez, Reference Hernández-Camacho, Sanchez-Páez and Halffter1992), provide unfavorable conditions for A. striata's host plants. However, bionomic and scenopoetic variables that were not assessed may positively affect the occurrence of source populations (Peterson et al., Reference Peterson, Soberón, Pearson, Anderson, Martínez-Meyer, Nakamura and Araújo2011).
The models under climate change scenarios with an increase in temperature expanded the geographic area suitability, as evidenced here for A. striata in Colombia (fig. 4). This behavioral response may be evidenced in species limited by low temperatures, where the increase in warmth in the occurrence area may shift the geographical range toward cold regions (Fu et al., Reference Fu, Li, Huang, Wu, Ni and Qü2014). Although the presence probability decreased in the Pacific region, it could be the result of climatic effects due to proximity to the coastal zone, where the general climatic conditions are remarkably unstable (Martínez-Ardila et al., Reference Martínez-Ardila, Jaramillo-Rodríguez and Robertson2005). Changes in climatic variables, such as precipitation regimes, can cause contractions in the spatial distribution (Martínez-Freiría et al., Reference Martínez-Freiría, Tarroso, Rebelo and Brito2016). Our results agreed with those of Fu et al. (Reference Fu, Li, Huang, Wu, Ni and Qü2014), who demonstrated that climate change expanded the potential distribution of the fruit fly A. obliqua (Macquart, 1835) toward the poles but decreased the distribution in northwestern Australia and northern sub-Saharan Africa due to climate stress caused by marine climate effects.
Notably, the potential distributions of species depend not only on weather conditions but also on dispersal capacity, host availability, the effects of ecological relationships (Peterson et al., Reference Peterson, Soberón, Pearson, Anderson, Martínez-Meyer, Nakamura and Araújo2011), and species physiology (Gamaliel et al., Reference Gamaliel, Buba, Guy-Haim, Garval, Rilov and Belmaker2020). The estimation of these aspects is especially critical for species of economic importance (Lira-Noriega et al., Reference Lira-Noriega, Soberón and Miller2013; Reyes and Lira-Noriega, Reference Reyes and Lira-Noriega2020). This information is difficult to model with climate change scenarios, and even current biotic interaction data are challenging to include (Peterson et al., Reference Peterson, Soberón, Pearson, Anderson, Martínez-Meyer, Nakamura and Araújo2011). This study faced a poor understanding of the basic bionomic parameters of A. striata (Cruz-López et al., Reference Cruz-López, Malo and Rojas2015) due to insufficient local data to infer ecological and distributional patterns in A. striata populations (Canal, Reference Canal2010; Castañeda et al., Reference Castañeda, Osorio, Canal and Galeano2010). The current and future ecological interactions of A. striata in Colombia are still enigmatic and lead to additional challenges for integrated management. Nevertheless, we offered an additional tool never before considered in Colombian fruit agriculture. The most significant proportion of potential areas predicted by climate change scenario models for the expansion of A. striata occurred in the Amazonian region (fig. 4b, d). This could be related to accelerated deforestation rates, which are caused primarily by the presence of illicit crops and the expansion of the agricultural frontier (Vieira, Reference Vieira2019); these activities could promote A. striata establishment (Aluja et al., Reference Aluja, Rull, Sivinski, Norrbom, Wharton, Macías-Ordóñez, Díaz-Fleischer and López2003).
Due to the economic importance of A. striata, knowledge on the autoecology and variables determining its geographic distribution are essential on the local scale (Castañeda et al., Reference Castañeda, Osorio, Canal and Galeano2010); this information provides crucial feedback for implementing effective IPM programs (Martínez-Ardila et al., Reference Martínez-Ardila, Jaramillo-Rodríguez and Robertson2005). Under the current environmental and climatic conditions, the A. striata distribution is intimately associated with guava crops. The predominance of A. striata and guava crop interactions, the high vulnerability of the guava-producing municipalities to the potential occurrence of A. striata, and its presence in a large area, principally in the Andes (fig. 2c and table 3), make it difficult to effectively establish IPM strategies based on a single local initiative. The use of the data offered here concerning each municipality may be used to configure national policies based on area-wide management (Bouyer et al., Reference Bouyer, Cox, Guerrini, Lancelot, Dicko, Vreysen, Dyck, Hendrichs and Robinson2021).
Furthermore, the estimated distributions for A. striata according to climate change scenarios for 2050 and 2070 will not modify this outlook and are trending toward expansion. Importantly, the data presented here have established a clear and present risk to the spread of this fly of economic importance, emphasizing that these risks will only worsen in the face of climate change. Action should be taken to ensure optimal guava productivity. The selection and cultivation of cultivars adapted to environments unsuitable for A. striata, as well as the selection of fly-resistant varieties, present promising opportunities. Alternative approaches employing chemical ecology and trophic relationship studies could represent useful improvements for GFF management in Colombia. Finally, it would be desirable to establish transnational policies to enhance the monitoring of fruit fly pests in areas where eradication techniques, such as low prevalence areas and sterile males use, are unlikely.
Supplementary material
The supplementary material for this article can be found at https://doi.org/10.1017/S0007485321000985.
Acknowledgements
We would like to thank Javier Martínez for allowing us to access the A. striata distribution records, Juan Manuel Perilla for information compilation, and the curators of the referenced entomological collections. This study was supported by Tecnológico de Antioquia (CODEI) and COLCIENCIAS, who financed Juan Manuel Perilla as a young researcher. The authors disclose that they do not have any financial and personal relationship with other people or organizations that could inappropriately influence (bias) this study.
Conflict of interest
The authors state that they have no conflicts of interest.


