

Fifteen years ago, two important articles by Dollar, Fisman and Gatti and Swamy et al. established a curious observational link: greater representation of women in government is associated with lower levels of perceived corruptionFootnote 1 in that government.Footnote 2 The impact of these studies was substantial. In academia, the articles are extremely well cited and have inspired a still-growing literature.Footnote 3 In the policy world, the findings justified governments enthusiastically bringing women into political offices and bureaucratic positions, such as police forces and the civil service, as an anti-corruption measure.Footnote 4
In the years since the publication of these studies, two important challenges to this finding have emerged. First, research has found that the relationship between women’s representation and corruption is not universal – it holds in some countries but not others.Footnote 5 Esarey and Chirillo, for example, find that the relationship is specific to democracies; it does not hold in autocracies.Footnote 6 Secondly, scholars have criticized Dollar, Fisman and Gatti’s explanationFootnote 7 for the finding – that women are simply more honest and trustworthy and therefore less likely to be corrupt – and offered alternative explanations, such as that women have had less opportunity to engage in corruption because they are often excluded from power and patronageFootnote 8 or that networks of corrupt officials suppress women’s representation in government as a means of ensuring that outsiders do not penetrate these networks and disrupt the stream of benefits from corruption.Footnote 9 These challenges call into question our understanding of the relationship between women’s representation and corruption, as well as the basis for some public policies.
In this article, we ask: Why does the relationship between women’s representation and corruption vary across countries? We argue that women’s representation is linked to corruption through the moderating pathway of electoral accountability, which we define as voters’ ability to identify corrupt officials and punish them at the ballot box. Where electoral accountability is high, corruption is a risky behavior; where electoral accountability is low, corruption is less risky. We expect the strength of the relationship between women’s representation and perceived corruption to be proportional to the risk of being held accountable for corruption, with the strongest relationship in places where the risk of accountability is greatest. We offer two mechanisms to explain why accountability influences the women’s representation–corruption relationship. First, experimental and observational evidence indicates that women tend to be more risk averse than men (on average) when confronting identical situations. If women are more risk averse, they should be less likely to engage in corruption in high-accountability contexts because of the risks involved. Secondly, evidence suggests that voters hold female elected officials to a higher standard than men. If this is true, then the consequences for corruption disproportionately fall on women, which may deter them from participating in corruption when the risk of getting caught and punished is high. At the aggregate level, this translates into a strong relationship between women’s representation and corruption in political systems with high accountability and a weaker relationship in systems with low accountability.
This article studies countries with democratic-leaning institutions,Footnote 10 where the concept of electoral accountability for corruption is most relevant.Footnote 11 We expect that the observed relationship between women in government and perceived corruption should be strongest in democracies,Footnote 12 where institutions allow voters to hold government officials individually accountable for corruption by punishing them at the polls (and weakest where they do not). Specifically, there are four contexts in which we expect greater levels of women’s representation in the legislature to be more strongly associated with lower levels of perceived corruption: (1) where corruption is not an institutional norm, (2) where freedom of the press is respected, (3) in parliamentary rather than presidential systems and (4) under personalistic rather than party-centered electoral rules. As we explain below, each of these settings is associated with high levels of electoral accountability. We test these hypotheses empirically with a time-series, cross-sectional dataset of seventy-six democratic-leaning countries.Footnote 13 We present a set of bivariate correlations, multivariate statistical models and substantive marginal effects plots to show that all four hypotheses have strong empirical support, providing compelling new evidence that electoral accountability moderates the relationship between women’s representation and corruption.
The goals of this study are (a) to demonstrate that the empirical link between women’s representation in government and perceived corruption is sensitive to the strength of electoral accountability and (b) to articulate a theory that explains our finding and the pattern of past results. This article is an important contribution because it makes sense of a somewhat confusing pattern of findings and sets a theoretically driven agenda for future research, but it poses at least as many questions as it answers. Future research examining the micro-level mechanisms of differential risk aversion and differential treatment by voters and empirically studying the direction of causality would not be justified if we cannot establish the context sensitivity of the gender–corruption relationship. We return to a more detailed discussion of extensions of the theory and future empirical analyses that we think are suggested by our study in the conclusion.
A THEORY OF GENDER, CORRUPTION AND ACCOUNTABILITY
Why would electoral accountability produce a stronger relationship between women’s representation and reduced corruption? Our theory hinges on gender differences in how elected officials respond to the increased risk of engaging in corruption in governments with strong electoral accountability. The risk of being held accountable for corruption by voters is determined by two factors: the likelihood of corruption being detected and the severity of punishment upon detection.Footnote 14 Increases in the probability of detection and/or the severity of punishment make the prospect of corruption riskier. It is riskier for both women and men, but we argue that women are disproportionately more discouraged by the higher risk of engaging in corruption in high-accountability systemsFootnote 15 for two reasons. First, significant research shows that women are more risk averse than men, and if this is the case, then women will react more strongly to the greater risk associated with high-accountability systems. Secondly, research shows that voters perceive of and treat female representatives differently than male representatives, which could lead to women being more likely to be caught and more severely punished by voters than men. This risk increases in systems with higher electoral accountability. For both of these reasons, women should be disproportionately less likely to engage in corruption, and this gender difference should be larger in high-accountability systems than low-accountability systems.Footnote 16
Mechanism 1: Differential Risk Aversion
A recent review of the economic literature by Croson and Gneezy presents the following summary of the relationship between gender and risk taking:
The robust finding is that men are more risk prone than women. Previous surveys of economicsFootnote 17 and psychologyFootnote 18 report the same conclusions: women are more risk averse than men in the vast majority of environments and tasks.Footnote 19
Much of the evidence of women’s greater risk aversion in economics comes from laboratory experiments. Subjects in these experiments make a series of choices between lotteries offering a different combination of risks and rewards;Footnote 20 the lotteries are structured to determine a subject’s risk aversion.Footnote 21 The experimental findings are bolstered by observational research on differential risk taking in investment portfolios managed by men and women.Footnote 22 In psychology, evidence of gender differences in risk taking comes from a combination of survey experiments with hypothetical choices, self-reported risky behavior from surveys (for example, unsafe sex) and directly observed risky behaviors, such as dangerous traffic maneuvers monitored by researchers.Footnote 23
The explanation for women’s greater risk aversion is unclear. Based on recent evidence indicating that there is no gender difference in risk aversion in traditional societies,Footnote 24 we speculate that it results from the social, cultural and institutional environments in which women are socialized and operate. For the purpose of our research, the reason why women are, on average, more risk averse than men is less important than building from the empirically grounded assumption that they are, on average, and determining how and when that risk aversion translates into different behavior. Experimental research on gender and bribe taking lends insight into this question: it finds that women will only be less likely to take bribes than men when their behavior is being monitored and there is a chance of it being detected – in other words, when that bribe taking (that is, corruption) is risky.Footnote 25
If women are more averse to the risks presented by corruption than men, then women should be less likely than men to participate in corruption when it is risky. The risks of corruption come from the likelihood of corruption being detected and punished in systems with high levels of electoral accountability. Increases in the probability of detection or the severity of punishment for corruption will more strongly decrease women’s propensity to engage in corruption compared to men. This translates into an empirical expectation: the relationship between women in government and corruption gets stronger as corruption gets riskier.Footnote 26 This occurs because women respond more strongly than men to an increased possibility of getting caught and punished.
Mechanism 2: Differential Treatment by Gender
A second reason why the relationship between women’s representation and corruption may be moderated by the strength of accountability is that the mechanisms of accountability may be biased against women. That is, it is possible that women are proportionally more likely than men to be investigated and caught for engaging in corruption and more likely to be blamed and more harshly punished for corruption. This argument is rooted in recent research findings that women are perceived and treated differently while running for and holding office.
Research has found that voters evaluate male and female candidates through the filter of gender stereotypes.Footnote 27 Women have been perceived to be less likely to win elections than men,Footnote 28 even though research shows that women are as likely to win as men in settings with relatively gender equal cultures;Footnote 29 surveys suggest that many citizens still think that men make better political leaders than women.Footnote 30 Evidence of the importance of these stereotypes in evaluations of candidate choice is mixed,Footnote 31 but stereotypes about differences between male and female political leaders clearly exist. Research has also found that these gendered perceptions of elected officials translate into different behaviors by women in office. One line of research argues that because voters hold female candidates to a higher standard than their male counterparts, women are less likely to run for office.Footnote 32 Another suggests that women actually perform better than their male counterparts in direct response to gender stereotypes about women in politics.Footnote 33
If women in office are viewed differently than men and adapt their behavior accordingly, then it is logical that they may avoid a risky activity (like corruption) while in office. This could occur because they are more at risk of getting caught and/or because they are more at risk of being punished harshly. Their higher risk of being caught derives from the fact that they are more likely to be under a microscope while in political office. Recent research on female candidates for executive office and women serving as presidents and prime ministers reports that the novelty of women in politics leads the media and voters to pay extra close attention to women’s actions and behaviors.Footnote 34 A recent study of the US Senate finds that female voters are not blindly loyal to women in office simply because they are women but are, in fact, more likely to evaluate women in office more carefully based on the policies they promote while in office and hold them accountable.Footnote 35
Women’s higher probability of being punished for corruption results from the higher standard to which women are held. If women in office are stereotypically thought to be less corrupt than men, then they are likely to be more severely punished if they are accused of engaging in (or are perceived to be engaging in) corruption. Recent anecdotal evidence of female presidents (Laura Chinchilla in Costa Rica (2010–14) and Michelle Bachelet in Chile (2014 to present)) shows how quickly and severely their approval ratings have fallen in response to corruption scandals.
Summary
In sum, we argue that electoral accountability makes corruption risky, and therefore accountability should moderate the relationship between women’s representation and corruption for two reasons. First, women are more averse to the risks of engaging in corruption than men. Secondly, women may be more likely than men to be held accountable for corruption due to unequal treatment. If female legislators are less likely to engage in corruption than male legislators when accountability is high, then we should see this reflected in an aggregate relationship between women’s representation in legislatures/parliaments and corruption levels in a country. We expect a negative relationship between women’s representation and corruption when electoral accountability is strong, and this relationship will get weaker as electoral accountability gets weaker.Footnote 36
HYPOTHESES FOR ACCOUNTABILITY AND CORRUPTION
We identify four contexts in which voters should be able to hold elected representatives accountable for corruption – in other words, when they can more easily perceive corruption in government and punish corrupt officials at the polls – and, in turn, make corruption more risky: (1) when corruption is not a pervasive norm, (2) where press freedom is respected, (3) in parliamentary systems (as compared to presidential systems) and (4) when electoral rules establish direct and personalistic linkages between voters and elected legislators or members of parliament.Footnote 37 If our theory is correct, the empirical relationship between women’s representation in legislatures/parliaments and corruption should be statistically significant and negative in these settings of high accountability; the empirical relationship should be substantially smaller, and perhaps statistically insignificant, in low-accountability settings. In this section, we explain our reasoning for the link between our theory and these observable relationships.
Corruption Norms
Although corruption occurs in countries all over the world, research has found that democracies are less corrupt, on average, than non-democracies.Footnote 38 But even within democracies, corruption is present in (and in some cases endemic to) the political system.Footnote 39 Countries where corrupt behaviors (such as bribery and graft) are ‘rooted in widely shared expectations among citizens and public officials’ and become a normal part of doing government business have strong corruption norms.Footnote 40 Measuring the presence of corruption norms is a challenge, but one proxy for it could be the (perceived) pervasiveness of corruption in politics and society.Footnote 41 Where corruption is endemic and pervasive, corruption norms develop because corruption becomes the accepted and expected way that politics is done. Corruption norms do not develop, however, where corruption is not pervasive.
We use the pervasiveness of corruption as a proxy for corruption norms and one of the institutions (albeit an informal institution) of electoral accountability. In countries with pervasive corruption, the risk of corruption being detected and punished (that is, accountability) must be low in order for corruption to flourish. By comparison, a country with less corruption has (ipso facto) demonstrated a tendency to remove or exclude corrupt persons from government. The pervasiveness of corruption can moderate the relationship between women’s representation and corruption because less pervasive corruption (stronger corruption norms) increases the risk of engaging in corruption.Footnote 42 Because women are more risk averse and aware of the differential treatment they may receive as officeholders, less pervasive corruption creates a stronger disincentive for women to engage in corruption than men. As a result, we expect a stronger link between women’s representation in government and corruption in countries with weaker corruption norms.Footnote 43
HYPOTHESIS 1: The relationship between female share of the legislature and corruption level will be more negative in states with low prior levels of corruption compared to states with high prior levels of corruption.
Some evidence supporting this hypothesis has already been presented in prior work. For example, ChaudhuriFootnote 44 reviews multiple experimental studies of the propensity to commit various corrupt behaviors (such as offering or accepting bribes).Footnote 45 He finds that there is substantial heterogeneity in female behavior across multiple experiments. In some experiments, women are less likely to offer a bribe than men, but in others women are statistically indistinguishable from men. He suggests that one of the key contextual factors may be the degree to which corruption is endemic to its political and economic culture: ‘evidence for greater incorruptibility on the part of women comes primarily from developed nations. We do not find strong differences in developing countries where the problem of corruption is far more endemic’.Footnote 46
Press Freedom
A second contextual factor that could affect the relationship between women’s representation and corruption in a democracy is the freedom of the press. The ability of citizens to identify corrupt officials is at least partly conditional on the ability of the media to investigate and report on allegations of corruption. Brazil’s now-infamous mensalão scandal, for example, came to light when several newspapers and news magazines produced a series of news stories alleging that the governing Worker’s Party (PT) was paying opposition legislators monthly salaries to support the governing party’s legislative agenda.Footnote 47 In the aftermath of the scandal, several deputies were forced from office, and the PT lost eight seats in the 2006 Chamber of Deputy elections – the first time since the transition to democracy in 1985 that it lost seats rather than gained them.
We argue that corruption is riskier in countries with a freer press compared to those where the government restricts press freedom because the risk of detection, and consequently punishment, is higher where journalists are free to investigate and expose corruption.Footnote 48 The greater risk of detection and punishment in countries with a free press should in turn lead women in office to be proportionally less likely to engage in corruption compared to men, resulting in a stronger relationship between female participation in government and corruption.
HYPOTHESIS 2: The relationship between female share of the legislature and corruption level will be more negative in countries with a free press than in those with an unfree press.
Parliamentary Governance
A third contextual factor influencing accountability for corruption in a democracy is the nature of the separation of powers. Research on the differences between parliamentary and presidential systems has long debated the strengths of each in terms of accountability. Scholars concerned about the fragility of democracy in presidential systems often argue that parliamentary systems are better for democracy because the fixed terms inherent to presidential systems make it impossible to bring an end to unpalatable governments in any way other than the breakdown of democracy.Footnote 49 The ability to call a vote of no confidence in parliamentary systems, in contrast, gives voters an opportunity to preserve democracy but turn over the government more quickly. Linz notes one of the key drawbacksFootnote 50 of the fixed terms of presidential systems: ‘It breaks the political process into discontinuous, rigidly demarcated periods, leaving no room for the continuous readjustments that events may demand’.Footnote 51 He later explicitly relates this to corruption, saying ‘parliamentary systems, precisely by virtue of their surface instability, often avoid deeper crises. A prime minister who becomes embroiled in scandal or loses the allegiance of his party or majority coalition and whose continuance in office might provoke grave turmoil can be much more easily removed than a corrupt or highly unpopular president’.Footnote 52
We build on Linz’s logic and argue that the absence of fixed terms in parliamentary systems should strengthen accountability for corruption. Indeed, there is already empirical evidence that parliamentary systems have lower levels of perceived corruption than presidential ones, although the causal pathway identified varies.Footnote 53 In parliamentary systems, the chief executive, cabinet and parliament’s terms in office are not fixed and elected officials constantly face the threat of being held to account by voters at any time. When a corruption scandal breaks, the absence of fixed terms for parliament, the threat of a vote of no confidence, and the fact that a no confidence vote not only causes the member of parliament (MP) to suffer defeat but can bring down the entire government mean that the punishment for an MP and a party is severe, and thus corruption is risky. In presidential systems, fixed terms mean that punishment may be delayed to the end of the term in office, giving elites time to rebuild their images prior to being held to account by voters, and the separation of powers means that actions in the legislature do not necessarily threaten the government itself. Thus, we argue that corruption is riskier in parliamentary systems. Because of women’s greater behavioral response to this risk (attributable to greater risk aversion and/or differential treatment by voters), the link between women’s representation and lower levels of corruption should be strongest in parliamentary systems.
HYPOTHESIS 3: The relationship between female share of the legislature and corruption level will be more negative in parliamentary systems when compared to presidential systems.
Personalism
Finally, we directly examine the strength of the link between elected representatives and voters – the degree of personalism produced by the electoral system. Existing research has produced mixed findings regarding the effects of electoral rules on corruption. Persson, Tabellini and TrebbiFootnote 54 and Kunicová and Rose-AckermanFootnote 55 link electoral rules to voters’ ability to monitor elected officials and find that stronger ties between constituents and individual elected representatives produce lower levels of corruption. In contrast, ChangFootnote 56 and Chang and GoldenFootnote 57 find that electoral systems that produce incentives to cultivate personal votes (measured as open-list proportional electoral systems with high district magnitudes) have higher levels of corruption, which they argue results from candidates having greater incentives to seek illegal funds for their campaigns in more personalistic systems. Attempting to mediate these divergent findings, Treisman found that the relationships between electoral rules and corruption were often indeterminate.Footnote 58
We argue that more personalistic rules should strengthen the effect of women’s representation on corruption. Personalistic electoral rules create tighter ties between voters and their elected representatives, while less personalistic rules emphasize the mediating role of parties in the voter–representative linkage.Footnote 59 The risk of being punished for corrupt behavior is therefore greater in personalistic systems because voters can individually identify their representative and hold them directly accountable. In less personalistic (more party-centric) systems, elites may be able to hide inside the party organization and deflect direct punishment at the polls. Voters may be willing to swallow one bad egg the party wants to defend if they are supportive of the party more generally. Parties may even collaborate to conceal the individual guilt of one member to preserve their collective electoral viability.
Because of the stronger electoral accountability created by personalistic systems, we claim that the individual risk of corrupt behavior is greater in these systems. Our theory predicts that this risk deters women in office from engaging in corruption more strongly than men, and as a result, the link between female representation in government and corruption is stronger than in party-centered systems.
HYPOTHESIS 4: The relationship between female share of the legislature and corruption level will be more negative in personalistic systems than in party-centric systems.
DATA AND VARIABLES
The dataset that we use is from Schwindt-Bayer and Tavits, and it contains measures of corruption perceptions, women’s representation in the legislature, accountability indicators and control variables for seventy-six democratic-leaning countries from 1990–2010;Footnote 60 summary statistics are reported in Table 1. The dataset includes all countries and years for which Freedom House’s average Civil Liberties and Political Rights scalesFootnote 61 was 5 or lower and Polity IV’s polity2 score was greater than 0 for twelve years or more.Footnote 62 The dataset also requires that, during this 12+ year period, countries have a consistent executive structure (presidential or parliamentary) and to not be missing all (or nearly all) data for any variable. These selection criteria have three main advantages: (1) they exclude countries that do not function according to the rules and norms of minimal democracy, (2) they include both semi-democracies and full democracies to allow generalization across degrees of democracy and (3) they allow sufficient time points and data availability to conduct a panel analysis.
Table 1 Dataset Summary Statistics

The dependent variable is the perceived level of corruption in countries as determined by three widely accepted country-level measures of corruption: Transparency International Corruption Perceptions Index (TI CPI), which measures ‘the abuse of public office for private gain’;Footnote 63 the World Bank Governance Indicators Control of Corruption measure (WBGI), which measures ‘the extent to which public power is exercised for private gain, including both petty and grand forms of corruption as well as “capture” of the state by elites and private interests’;Footnote 64 and the Political Risk Services’ International Country Risk Guide’s (ICRG) corruption risk measure, which measures ‘bribery […] excessive patronage, nepotism, job reservations, “favor-for-favors,” secret party funding, and suspiciously close ties between politics and business’.Footnote 65 Because corruption is notoriously difficult to assess, cross-national research often relies on corruption perceptions as a measure of underlying corruption; we believe these measures are advantageous because of their comprehensive nature and their wide availability over space and time.Footnote 66 All three measures are created from surveys and expert assessments of country-level corruption, and each measure has strengths and weaknesses.Footnote 67 By examining all three, we strengthen the robustness of our conclusions. The three measures correlate very highly with one another as well as with several alternative measures of corruption, which bolsters their validity.Footnote 68
We focus on the TI CPI (available from 1995–2010) in presenting our results, but our primary findings are similar regardless of whether we use the ICRG (available from 1990–2010) or the WBGI (available from 1996–2010, with biannual measurements between 1996 and 2002). The TI CPI measure is a scale of 0 to 10, the ICRG measure is a scale of 0 to 6Footnote 69 and the WBGI measure is a scale of −2.5 to 2.5. The original coding of all of these variables is such that higher numerical values indicate less perceived corruption (or more perceived government control of corruption). However, for ease of interpretation, we have recoded all three variables so that higher values equal more perceived corruption.Footnote 70
Our main independent variables are the percentage of the lower house of the legislature/parliamentFootnote 71 that is femaleFootnote 72 and four measures of accountability in the political system: (1) a one-year time lag of the dependent variable (specific to the corruption measure under analysis) to capture corruption norms in a country,Footnote 73 (2) the Freedom House’s Freedom of the Press measure, which we recode to range from −80 to 0 in order of increasing freedom,Footnote 74 (3) a dichotomous coding of whether a country’s form of government is presidential (coded as 1) or parliamentary (coded as 0)Footnote 75 and (4) a measure of the degree of personalism produced by a country’s parliamentary or legislative electoral system.Footnote 76 Personalism ranges from 1 to 13 in order of increasing levels of personalism. Each of these four measures of accountability is interacted with the percentage of women in the lower house of the parliament/legislature to allow the relationship between female participation in government and corruption to be conditional on the accountability variable.
We also include a set of common control variables for these kinds of corruption models:Footnote 77 the percentage of citizens who are Protestant;Footnote 78 democratic freedom, measured as the average political rights and civil liberties Freedom House scores inverted such that higher scores indicate greater freedom;Footnote 79 level of economic development, as measured by logged GDP per capita;Footnote 80 trade imbalance, measured as imports minus exports as a percentage of GDP;Footnote 81 and women’s economic rights, as measured in the Cingranelli-Richards Human Rights Dataset.Footnote 82 These measures block possible sources of spurious correlation attributable to cultural, socioeconomic and political explanations for variation in levels of corruption across countries and over time.
STATISTICAL METHODS
Our approach to analyzing and presenting our empirical evidence is straightforward: we consider each of our four accountability variables in turn. For each one, we first use a scatterplot to examine the pooled bivariate relationship between the TI CPI dependent variable and the percentage of women in government. To determine whether this relationship changes with the strength of electoral accountability for corruption, as would be consistent with Hypotheses 1–4, we split the data into high and low values on the accountability variable and construct separate scatterplots for each.
Secondly, we verify the findings of the bivariate plot by constructing a multivariate linear regression model.Footnote 83 We include a lagged dependent variable in all models because we believe that corruption is a path-dependent process, the presence of which is a function of its history; this variable also models temporal dependence in the data. We include year and geographical region dummiesFootnote 84 to account for additional temporal and spatial dependence in the data.
We plot the marginal effect of percentage women in the legislature on the dependent variable at different values of the accountability variable, as prescribed by Brambor, Clark and Golder,Footnote 85 to determine whether the relationship between perceived corruption and women in government is stronger when individual accountability for corruption is stronger (as indicated by Hypotheses 1–4).
Some variables (including the TI CPI and WBGI dependent variables, press freedom, personalism, trade imbalance, and women’s economic rights variables) have missing observations in our dataset.Footnote 86 Simply deleting the observations with partially missing data can lead to biased and inefficient estimates in cases where stochastic multiple imputation of the dataset would not.Footnote 87 Consequently, when we estimate our model, we use multiple imputation with chained equationsFootnote 88 as implemented in Stata 14.2Footnote 89 to perform regression including the partially missing cases while incorporating uncertainty about the unknown true values of the missing variables.
EVIDENCE: GENDER, ACCOUNTABILITY AND CORRUPTION
As described above, we have four hypotheses about how accountability should influence the relationship between women’s political representation and corruption. In this section, we show evidence associated with each hypothesis in turn.Footnote 90 Note that our statistical methods only look for a correlational relationship between women’s representation and corruption at different levels of accountability. A specific pattern of correlations is predicted by our theory (that women’s representation in government causes lower corruption only when electoral accountability is high) and we seek to match those predictions as evidence for our theory, but we cannot definitively determine a direction of causality.Footnote 91 We discuss empirical causal modeling strategies in the conclusion as suggestions for future research, but in this article our goal is simply to establish whether there is an empirical relationship between women’s representation and corruption that is conditional on electoral accountability and consistent with our theoretical predictions.
Hypothesis: Corruption Norms
Our first hypothesis is that the relationship between the female share of the legislature and the perceived corruption level should be stronger (more negative) in democracies with low prior levels of corruption compared to democracies with high prior levels of corruption. As Figure 1 indicates, we find evidence for this relationship in our data. The simple bivariate scatterplots with the linear prediction included show that the percentage of the legislature/parliament that is female is not associated with perceived corruption in countries with high levels of prior perceived corruption. Where prior perceived corruption levels are low, greater levels of women’s representation in the lower house of parliament are strongly associated with lower levels of perceived corruption.

Fig. 1 How does the past prevalence of corruption influence the relationship between gender and corruption? Note: the figure shows the relationship between the TI CPI and the percentage of women in the lower house for seventy-six democratic-leaning countries between the years 1996–2010; the top panel shows countries with prior TI CPI scores>5 and the bottom panel shows countries with TI CPI scores≤5. The difference between the slopes is 0.070, which is statistically significant (p<0.001).
Table 2 confirms this pattern in a multivariate regression using all three measures of corruption.Footnote 92 The interaction between the percentage of the legislature that is female and the lagged measure of corruption perceptions is positive and statistically significant in all three models.Footnote 93 Figure 2 presents the marginal effect of women’s representation on perceived corruption as the prior perceived corruption level increases based on the TI CPI results from Table 2; it indicates that a larger share of women in government is associated with a lower level of perceived corruption, but only when prior levels of perceived corruption are already low.Footnote 94 When prior perceived corruption levels range from 0 to about 4.5, increasing women’s representation correlates with less perceived corruption to a statistically significant degree. At a prior corruption score of 2, the present corruption score would be ≈0.02 lower for every one-percentage-point higher value of women in parliament. This indicates that a state with a 40 per cent share of women in the legislature would have a 0.80 point lower present TI corruption score compared to a state with no women in parliament; this is about 8 per cent of the maximum difference possible on this perceived corruption scale. The finding is consistent with our theoretical argument that the gender–corruption relationship is sensitive to electoral accountability. Interestingly, the model also indicates that there is a statistically significant and positive relationship between women’s participation in government and perceived corruption at the highest lagged values of perceived corruption (between ≈7.5 and 10 on the TI CPI scale); however, only about 9 per cent of our observations lie in this range.

Fig. 2 How does the relationship between gender and corruption differ by prior corruption? Note: the figure reports the marginal effect of the percentage of female members in the lower house of parliament on the TI CPI for different lagged values of the TI CPI score. Estimates are based on Model 1 reported in Table 2.
Table 2 How Does the Past Prevalence of Corruption Influence the Relationship Between Gender and Three Measures of Corruption?

Note: the table reports the output of ordinary least squares regression models using three dependent variables: (1) Transparency International Corruption Perception Index (TI CPI); (2) the International Country Risk Guide corruption rating (ICRG); and (3) the World Bank Governance Indicators Control of Corruption measure (WBGI). All three measures have been recoded so that higher values on each DV indicate more corruption. The data includes seventy-six democratic-leaning countries; the time dimension spans 1995–2010 for the TI CPI variable, 1996–2010 for the WBGI variable, and 1991–2010 for the ICRG variable. Year and region dummies are included in the models, though not reported in this table. Estimates are based on multiple imputation into fifty datasets using chained equations. R2 for the models are: (1) 0.919, (2) 0.931, (3) 0.867. t statistics in parentheses. *p<0.05, **p<0.01, ***p<0.001
Hypothesis 2: Press Freedom
We also find evidence that press freedom is associated with the relationship between women’s representation and corruption in a way that is consistent with our theory of electoral accountability. The bivariate scatterplot shown in Figure 3 shows no relationship between gender and corruption perceptions when press freedom is restricted, but a strong negative relationship in countries with high levels of press freedom. This is consistent with the idea that the greater risk of detection and punishment for corruption that is created by a free press disproportionately affects the behavior of women.

Fig. 3 How does press freedom influence the relationship between gender and corruption? Note: the figure shows the relationship between the TI CPI and the percentage of women in the lower house for seventy-six democratic-leaning countries between the years 1995–2010; the top panel shows countries with press freedom scores≤−30 and the bottom panel shows countries with press freedom scores>−30. The difference between the slopes is 0.110, which is statistically significant (p<0.001).
Table 3 shows that this finding is supported by the results of a multivariate regression: a statistically significant interaction effect exists between women’s representation in parliament and press freedom for all three measures of corruption. The relationship is most clearly seen in Figure 4, which illustrates the marginal effect of women’s parliamentary representation on corruption perceptions as press freedom increases based on the TI CPI results from Table 3.

Fig. 4 How does the relationship between gender and corruption differ by press freedom? Note: the figure reports the marginal effect of the percentage of female members in the lower house of parliament on the TI CPI for different values of the press freedom variable. Estimates are based on Model 1 reported in Table 3.
Table 3 How Does Press Freedom Influence the Relationship Between Gender and Three Measures of Corruption?

Note: the table reports the output of ordinary least squares regression models using three dependent variables: (1) the Transparency International Corruption Perceptions Index (TI CPI); (2) the International Country Risk Guide corruption rating (ICRG); and (3) the World Bank Governance Indicators Control of Corruption measure (WBGI). All three measures have been recoded so that higher values on each DV indicate more corruption. The data includes seventy-six democratic-leaning countries; the time dimension spans 1995–2010 for the TI CPI variable, 1996–2010 for the WBGI variable and 1991–2010 for the ICRG variable. Year and region dummies are included in the models, though not reported in this table. Estimates are based on multiple imputation into fifty datasets using chained equations. R2 for the models are: (1) 0.922, (2) 0.931, (3) 0.873. t statistics in parentheses. *p<0.05, **p<0.01, ***p<0.001
The estimated marginal effect of women’s representation on perceived corruption becomes negative and statistically significant when press freedom is in the top third of its range (about −25 to 0). When press freedom is at −10, the marginal effect of women in parliament is ≈ −0.02. Once again, this implies that countries with a 40 per cent female parliament are, on average, about 0.8 lower in the TI corruption perceptions measure compared to a country with no women in parliament. As Hypothesis 2 indicated, a larger share of women in parliament is associated with lower levels of corruption when the press is free, but not when the press is restricted.
Hypothesis 3: Parliamentary Governance
The relationship between women’s representation and corruption perceptions in our data is different across types of democratic government. In presidential systems, women’s representation in legislatures has no discernible relationship with perceived corruption, whereas in parliamentary systems, greater women’s representation correlates with considerably lower levels of perceived corruption. These divergent patterns are striking in the bivariate relationships depicted in Figure 5.

Fig. 5 How does separation of powers influence the relationship between gender and corruption? Note: the figure shows the relationship between the TI CPI and the percentage of women in the lower house for seventy-six democratic-leaning countries between the years 1995–2010; the top panel shows countries with presidential systems and the bottom panel shows countries with parliamentary systems. The difference between the slopes is 0.148, which is statistically significant (p<0.001).
As Table 4 shows, multivariate regression models support the bivariate findings: the interaction between the percentage of female legislators and the presidentialism dummy variable is statistically significant and positive in all three models. The marginal effect plot in Figure 6 shows the relationship between the percentage of the legislature/parliament that is female and corruption perceptions estimated in the TI CPI model in Table 4. While greater women’s representation has no statistically significant relationship with the level of perceived corruption in presidential systems, it has a strong and statistically significant negative relationship in parliamentary systems of ≈ −0.01 – about half the substantive magnitude of the relationships in the prior two contexts.
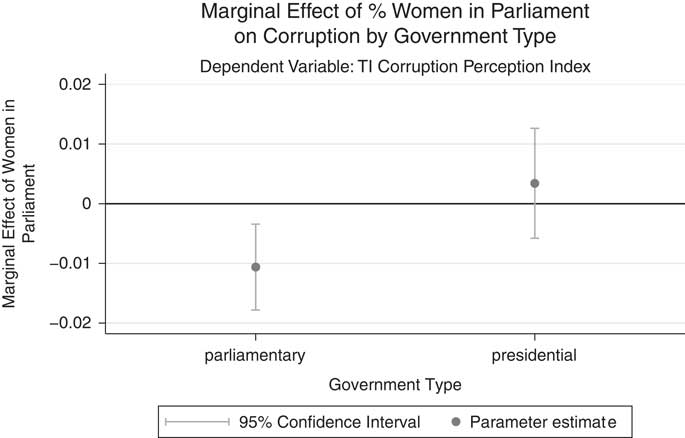
Fig. 6 How does the relationship between gender and corruption differ by government type? Note: the figure reports the marginal effect of the percentage of female members in the lower house of parliament on the TI CPI for parliamentary and presidential systems. Estimates are based on Model 1 reported in Table 4.
Table 4 How Does Separation of Powers (Accountability) Influence the Relationship Between Gender and Three Measures of Corruption?

Note: the table reports the output of ordinary least squares regression models using three dependent variables: (1) the Transparency International Corruption Perceptions Index (TI CPI); (2) the International Country Risk Guide corruption rating (ICRG); and (3) the World Bank Governance Indicators Control of Corruption measure (WBGI). All three measures have been recoded so that higher values on each DV indicate more corruption. The data includes seventy-six democratic-leaning countries; the time dimension spans 1995–2010 for the TI CPI variable, 1996–2010 for the WBGI variable and 1991–2010 for the ICRG variable. Year and region dummies are included in the models, though not reported in this table. Estimates are based on multiple imputation into fifty datasets using chained equations. R2 for the models are: (1) 0.919, (2) 0.931, (3) 0.868. t statistics in parentheses. *p<0.05, **p<0.01, ***p<0.001
This finding supports our theoretical argument that parliamentary systems present a greater individual risk for corruption due to the threat of swift sanctioning by voters, which creates a larger gender difference in corruption behavior. This difference becomes manifest in a stronger negative relationship between the perceived level of corruption and the share of women in the legislature in parliamentary systems compared to presidential systems.
Hypothesis 4: Personalism
Finally, we examine how the relationship between women’s representation and corruption is influenced by the personalism embedded in legislative or parliamentary electoral rules. We find that more personalistic rules are associated with a stronger negative relationship between the percentage of women in parliament and perceived corruption. Figure 7 shows the bivariate scatterplots and linear predictions for democratic-leaning countries with more party-centered (less personalistic) electoral rules compared to more personalistic electoral rules. Both figures show a negative relationship, but the effect is slightly steeper in democratic-leaning countries with more personalistic rules (and the difference between the slopes is statistically significant at p<0.001.

Fig. 7 How does personal accountability influence the relationship between gender and corruption? Note: the figure shows the simple bivariate relationship between the TI CPI and the percentage of women in the lower house for seventy-six democratic-leaning countries between the years 1995–2010; the top panel shows countries with personalism scores≤6, and the bottom panel shows countries with personalism scores>6. The difference between the slopes is 0.082, which is statistically significant (p<0.001).
Table 5 shows our multivariate statistical models with personalism interacted with the percentage of female legislators. The interaction terms are negative and statistically significant in all three models. Figure 8 shows the TI CPI model’s marginal effect for women in parliament on perceived corruption at varying levels of personalism. The effect is not statistically significant in the least personalistic systems (where the personalism score is less than about 2.5); this encompasses 33 per cent of the sample of country-years (that is, about two-thirds of the sample has more personalistic electoral rules). As personalism increases from 3 to 13, the effect of women’s representation on corruption perceptions is negative and statistically significant. At a personalism value of 13, the marginal effect of women in parliament is about −0.03; this means that a country with 40 per cent women in parliament is expected to have a corruption score 1.2 points lower than a country with no women in parliament. This supports our argument that electoral rules that produce a stronger accountability link between individual representatives and voters disproportionately deter women from engaging in corruption.

Fig. 8 How does the relationship between gender and corruption change as personalism changes? Note: the figure reports the marginal effect of the percentage of female members in the lower house of parliament on the TI CPI at different levels of personalism (Johnson and Wallack Reference Johnson and Wallack1997). Estimates are based on Model 1 reported in Table 5.
Table 5 How Does Personal Accountability Influence the Relationship Between Gender and Three Measures of Corruption?

Note: the table reports the output of ordinary least squares regressions using three dependent variables: (1) the Transparency International Corruption Perceptions Index (TI CPI); (2) the International Country Risk Guide corruption rating (ICRG); and (3) the World Bank Governance Indicators Control of Corruption measure (WBGI). All three measures have been recoded so that higher values on each DV indicate more corruption. The data includes seventy-six democratic-leaning countries in each model; the time dimension spans 1995–2010 for the TI CPI variable, 1996–2010 for the WBGI variable and 1991–2010 for the ICRG variable. Year and region dummies are included in the models, though not reported in this table. Estimates are based on multiple imputation into fifty datasets using chained equations. R2 for the models are: (1) 0.920, (2) 0.931, (3) 0.869. t statistics in parentheses. *p<0.05, **p<0.01, ***p<0.001
In sum, we observe that the relationship between the level of women’s representation and the perceived level of corruption is indeed conditional upon the strength of individual accountability to voters in the political system. This finding corresponds to the implications of our theoretical argument: accountability moderates the relationship between women’s representation and corruption through the mechanisms of greater risk aversion and/or higher standards of accountability for women.
CONCLUSION
Corruption is a political threat that all countries fight, with varying degrees of success. In some countries, corruption levels are low and instances of suspected corruption are quickly brought to justice. The recent convictions of former Illinois governor Rod Blagojevich and former New Orleans mayor Ray Nagin in the United States exemplify this. Corruption is a risky activity for political elites in these settings. In other countries, like Mexico and Venezuela, corruption levels are persistently high and individual cases of corruption rarely make headlines or produce negative consequences for those involved. Participating in corruption is therefore not particularly risky in these locales and may even be a way for elites to further their political careers. Previous studies have found that women’s representation in government is associated with lower levels of corruption, leading some to think that increasing women’s election to office will reduce corruption in countries. Yet this finding is not consistent across countries.
In this article, we asked: why are women’s representation and reduced corruption related in some countries but not others? We argued that greater women’s representation in parliaments and legislatures is more strongly associated with lower levels of corruption in countries with higher electoral accountability, that is, where voters can identify corrupt officials and punish them at the ballot box. We explained this conditional relationship with two theoretical mechanisms that relate the relationship between women’s representation and corruption to the risks of corruption – women’s greater risk aversion and the different ways in which voters treat them. We generated four institutional hypotheses about the rules and norms that influence electoral accountability and tested these hypotheses with data from seventy-six democratic-leaning countries around the world. We found consistent evidence that, where accountability is high, a strong negative relationship exists between women’s representation and perceived corruption levels. Where accountability is low, a much weaker relationship exists. Strong electoral accountability appears to be the mechanism by which higher levels of women’s representation relate to reduced corruption perceptions.
Identifying and providing empirical evidence that electoral accountability is the key moderating factor in the relationship between women’s representation and perceived corruption is an important new finding. It answers a puzzling question – why does the relationship only exist in some countries and not others – and provides a critical caution to policy makers who think bringing women into government can solve corruption problems. Increasing the proportion of women in government might reduce perceived corruption, but empirical evidence of an association between the two only exists in countries that already have high levels of electoral accountability. We find little reason to suspect that changing the proportion of women in government will change perceived corruption levels in countries with low electoral accountability.
Our empirical finding also highlights two areas for further research on the gender–corruption link. First, this article does not empirically establish the direction of causality in the relationship between women’s representation and corruption. Our theoretical argument is that having more women in legislatures and parliaments will reduce overall corruption levels because women are less likely to engage in corruption than men. Our empirics support a correlation between women in government and perceived corruption that is consistent with this theory, but they do not prove a direction of causality or establish that the relationship applies to directly observed (as opposed to perceived) corruption. Concordantly, other interpretations of our evidence are conceivable. For example, women could be more likely than men to avoid running for public office in high-corruption environments, but only when electoral accountability is high; this is a strategy of avoiding participation in corruption, and is therefore generally consistent with our theory that women avoid corruption in high-accountability contexts, but it has different causal implications.Footnote 95 In this alternative interpretation, increasing the number of women in office may not reduce corruption; it depends on how women who would not have ordinarily run for office behave once they are elected. Another possibility is that greater female representation in government changes how observers perceive the degree of state corruption, but not the real rate of corrupt practices, when electoral accountability is high. Our current study is not designed to empirically disentangle these and other possibilities, but rather to identify that accountability is an important contextual factor that must be considered in future work that is designed to do so.
Two strategies could be particularly useful to empirically estimate the causal effect of increased women’s representation on corruption. First, survey and laboratory experiments could be designed to investigate the degree to which people select themselves out of positions that involve corruption, or choose to accept these positions but resist corruption once there. Experiments could also focus on how and why voters hold politicians accountable for corruption, which would be particularly useful in helping us establish what causes voters to punish corruption (and what causes politicians to avoid it) at the micro level. As a bonus, experiments can allow a researcher to directly observe corrupt behaviors rather than the indirect perception of corruption. Secondly, instrumental variables techniques may allow us to directly measure the local average treatment effect of a program designed to increase female representation in government on corruption in that government.Footnote 96
A second important priority for future research is to distinguish between the two micro-level theoretical mechanisms – risk aversion and differential treatment – that we argued might explain why accountability moderates the relationship between women’s representation and corruption. Again, survey and laboratory experiments may help us separate these mechanisms and determine the extent to which each produces the greater responsiveness to electoral accountability that we see in observational data. Additionally, collecting panel data on individual voter attitudes and behavior toward women in government and corruption may give us traction on this question. As an added benefit, closer empirical examination of these theoretical mechanisms may also uncover other reasons why electoral accountability moderates the corruption and women’s representation relationship, some of which may be related to men’s responses to women’s increased levels of political participation.
This article takes an important first step towards understanding when women’s representation in government is associated with political corruption and why. While early work suggested that there is a clear and relatively simple link – namely, that more women in government means less corruption because women are intrinsically less corrupt – our findings support a subtler relationship that runs through electoral accountability. These findings matter for scholars hoping to better understand the causes and consequences of women’s political representation, and they have important implications for policy makers who think that increased women’s representation is a direct solution for endemic and pervasive corruption. Our findings support Goetz’s assertion that ‘To expect that women’s gender alone can act as a magic bullet to resolve a corruption problem that is much bigger than they are, that is systemic, is unrealistic to say the least. It reflects not just wishful but almost desperate thinking.’Footnote 97 At the same time, our findings suggest that countries considering the anti-corruption benefits of increasing gender parity in government should consider simultaneously implementing institutional reforms to catch and punish officials who are guilty of corruption. Women’s representation is much more likely to be associated with reduced corruption when accountability is high.


