


Crossref Citations
This article has been cited by the following publications. This list is generated based on data provided by Crossref.
HASSELL, HANS J. G.
HOLBEIN, JOHN B.
and
BALDWIN, MATTHEW
2020.
Mobilize for Our Lives? School Shootings and Democratic Accountability in U.S. Elections.
American Political Science Review,
Vol. 114,
Issue. 4,
p.
1375.
Brown, R. Blake
2020.
The Ghost of the Long-Gun Registry: Prime Minister Justin Trudeau and Gun Control in Canada, 2015-2019.
Études canadiennes / Canadian Studies,
p.
125.
Zhang, Youlang
Liu, Xinsheng
and
Vedlitz, Arnold
2020.
Issue-specific knowledge and willingness to coproduce: the case of public security services.
Public Management Review,
Vol. 22,
Issue. 10,
p.
1464.
Filindra, Alexandra
Collingwood, Loren
and
Kaplan, Noah J.
2020.
Anxious About Social Violence: The Emotional Underpinnings of Support for Gun Control.
Social Science Quarterly,
Vol. 101,
Issue. 5,
p.
2101.
Sharkey, Patrick
and
Shen, Yinzhi
2021.
The effect of mass shootings on daily emotions is limited by time, geographic proximity, and political affiliation.
Proceedings of the National Academy of Sciences,
Vol. 118,
Issue. 23,
Frey, Arun
and
Kirk, David S.
2021.
The Impact of Mass Shootings on Attitudes toward Gun Restrictions.
Socius: Sociological Research for a Dynamic World,
Vol. 7,
Issue. ,
Berrebi, Claude
and
Yonah, Hanan
2021.
Crime and Philanthropy: Prosocial and Antisocial Responses to Mass Shootings.
Victims & Offenders,
Vol. 16,
Issue. 1,
p.
99.
Agerberg, Mattias
and
Sohlberg, Jacob
2021.
Personal Proximity and Reactions to Terrorism.
Comparative Political Studies,
Vol. 54,
Issue. 14,
p.
2512.
Fox, James Alan
Sanders, Nathan E.
Fridel, Emma E.
Duwe, Grant
and
Rocque, Michael
2021.
The Contagion of Mass Shootings: The Interdependence of Large-Scale Massacres and Mass Media Coverage.
Statistics and Public Policy,
Vol. 8,
Issue. 1,
p.
53.
Yousaf, Hasin
2021.
Sticking to One’s Guns: Mass Shootings and the Political Economy of Gun Control in the United States.
Journal of the European Economic Association,
Vol. 19,
Issue. 5,
p.
2765.
Olzak, Susan
2022.
School Shootings, Protests, and the Gun Culture in the U.S..
SSRN Electronic Journal ,
Sato, Yuko
and
Haselswerdt, Jake
2022.
Protest and state policy agendas: Marches and gun policy after Parkland.
Policy Studies Journal,
Vol. 50,
Issue. 4,
p.
877.
LeCount, Ryan Jerome
2022.
Who Wants to Know? White Racial Attitudes and Survey Item Refusal on Gun Ownership Questions.
Sociological Inquiry,
Vol. 92,
Issue. 1,
p.
153.
Olzak, Susan
2022.
School Shootings, Protest and the Gun Culture in the U.S.
SSRN Electronic Journal ,
Vegter, Abigail
and
Haider-Markel, Donald P.
2022.
Gun Ownership, Threat, and Gun Attitudes in an Experiment.
Sociological Perspectives,
Vol. 65,
Issue. 1,
p.
119.
GARCÍA-MONTOYA, LAURA
ARJONA, ANA
and
LACOMBE, MATTHEW
2022.
Violence and Voting in the United States: How School Shootings Affect Elections.
American Political Science Review,
Vol. 116,
Issue. 3,
p.
807.
Olzak, Susan
2023.
School Shootings, Protests, and the Gun Culture in the United States.
Social Forces,
Vol. 102,
Issue. 1,
p.
116.
Intravia, Jonathan
Lang, Joshua A.
Wolff, Kevin T.
and
Vito, Anthony G.
2024.
Assessing the indirect effects of fear of mass shootings on online media usage and attitudes toward gun policy.
Journal of Crime and Justice,
p.
1.
Vargo, Chris J.
and
Minooie, Milad
2024.
Breaking Agenda Setting Boundaries: A Multi-Dimensional Approach to Understanding Salience of Gun Control in the Polarized Public Sphere.
Mass Communication and Society,
p.
1.
Zhang, Youlang
and
Liu, Xinsheng
2024.
How does a focusing event shape public opinion? Natural experimental evidence from the Orlando mass shooting.
Policy Studies Journal,
Mass shootings have become an unfortunate recurring fact of life in the United States, with each new tragedy leading to renewed debate over gun control policy. It is reasonable to hypothesize that when a mass shooting occurs close to an individual, it might have a significant impact on how they think about the issue of gun control. In their recent article, Newman and Hartman (Reference Newman and Hartman2017) test for such a relationship using both cross-sectional and panel survey data. The authors find that ‘Americans – Democrats and Republicans alike – are responsive to tragic events like mass public shootings, albeit in a contextually dependent way’ (Newman and Hartman Reference Newman and Hartman2017, 23). In particular, the authors find that individuals who live closer to mass shooting events are more supportive of stricter gun control regulations.
This finding could have important implications for issue advocacy in the wake of threats to public safety. In a context where segments of public opinion are responsive to these events, policy demanders seeking more stringent gun control policies would be best served by mobilizing support in areas where the threat of mass shootings is most salient. Despite calls to avoid ‘politicizing’ these tragedies, advocacy organizations may invest considerable resources into a strategy focused on those most affected by mass shootings in order to cultivate public support for gun control policies. While this sort of advocacy might not produce stricter gun control measures in the short term, it could very well have agenda-setting and electoral consequences. But the efficacy of such an approach to mobilization rests on the validity of a robust causal relationship between exposure to mass shootings and shifts in public opinion. Thus, the material consequences of Newman and Hartman’s conclusion warrant a closer examination of this relationship.
Of course, recovering an unbiased causal estimate for an event from observational data is challenging. This difficulty is especially pronounced when one uses cross-sectional data, as it is impossible to fully account for all the potential confounding variables. Newman and Hartman’s use of the large-N Cooperative Congressional Election Study (CCES) panel survey thus offers the best leverage for estimating the effect of a shooting intervention on gun control attitudes. The CCES survey is well designed for such an analysis because it includes a large number of respondents who are geo-coded at the ZIP code level and who answered the same question about gun control laws in 2010 and again in 2012. Therefore one can examine whether there is within-person change in gun control attitudes when they live near a shooting that occurred between Waves 1 and 2.
In this response, we attempt to replicate Newman and Hartman’s findings and then seek to extend the analysis. The goal is to examine whether the effect they recover is robust to both alternative distance thresholds and panel models that incorporate individual and time fixed effects. We also seek to extend the analysis by testing for effects across a longer, three-wave panel. In doing so, we also re-examine the potentially polarizing effects that mass shootings may have on the attitudes of Democrats and Republicans. In the course of our research, we identified a discrepancy in how the authors coded their treatment variable; this discrepancy influences whether one finds an effect for mass shootings. Our analyses failed to find any significant or substantively meaningful main effect for a mass shooting intervention on gun control attitudes. We did, however, find evidence that mass shootings have polarizing effects conditional on partisanship. That is, Democrats who live near a mass shooting event tend to become more supportive of gun control restrictions, while Republican attitudes shift in the opposite direction.
Data
We examine the portion of Newman and Hartman’s analysis that allows for the strongest causal inferences – their analysis of CCES panel data (the results shown in Table 1 in their article). However, we first note that there are two versions of the CCES panel:
1. 2010–2012 panel: This is a dataset of 19,000 respondents who were interviewed in 2010 and 2012.Footnote 1
2. 2010–2012–2014 panel: This is a dataset of 9,500 respondents who were interviewed in 2010, 2012 and 2014.Footnote 2
Table 1 2010–2014 panel, fixed-effects regressions
Note: standard errors in parentheses. *p<0.05, **p<0.01, ***p<0.001
In their analysis, Newman and Hartman use the 2010–2012–2014 panel (n = 9,500), but they only use the first two waves of that panel. In a correspondence with the authors, they noted that they were unaware of the existence of the 2010–2012 panel that includes more respondents. Part of the motivation for our analysis was to apply their approach to the 2010–2012 panel that would have more power because of its larger sample size. In the analysis that follows, we first test for treatment effects using the 2010–2012 panel, and then extend the analysis to the full 2010–2012–2014 panel data. The latter dataset includes fewer observations, but measures support for gun control at an additional point in time and therefore also includes more mass shooting interventions.
The Treatment Variable
In describing their panel analysis, Newman and Hartman explain how they code their treatment variable: ‘We created a dichotomous treatment variable coded 1 if a respondent resided in a ZIP code within 100 miles of a mass shooting occurring between survey waves (December 2010 to September 2012), and 0 otherwise’ (Newman and Hartman Reference Newman and Hartman2017, 19). In order to extend their analysis to the other panel data sets, we reconstructed this treatment variable as they describe it. Specifically, we calculated the distance between each respondent’s ZIP code centroid and each shooting event that occurred between the panel waves.Footnote 3 We used the geodist command in Stata to calculate these geodetic distances.
If the distance between a respondent’s ZIP code centroid and one of the mass shooting events was less than or equal to 100 miles, we considered the respondent to have been ‘treated’. Thus our treatment is essentially how Newman and Hartman describe it: if a mass shooting event occurred within 100 miles of the respondent’s ZIP code centroid between 2010 and 2012, they were considered to be treated.
Discrepancy in coding of the treatment variable
As a first step in our analysis, we wanted to be sure that we could replicate Newman and Hartman’s findings from Table 1 in their article using our own approach to calculating these distances. Since different approaches to geocoding can result in small discrepancies in distances, we wanted to make sure that any such discrepancies would not have an important effect on what we found. However, when we compared our coding of the treatment variable with their replication dataset, we immediately realized that there was much more than a trivial discrepancy. When we coded their dataset using our approach, we identified 29.8 per cent of respondents as being treated between the first and second waves, whereas their dataset only coded 6.6 per cent as treated.Footnote 4 Nearly every discrepancy between the treatment variables was a respondent who we coded as treated but who Newman and Hartman identified as untreated. Furthermore, these discrepancies were not usually respondents who lived at the margins of the 100-mile threshold; they often lived quite close to a shooting event.
After additional investigation of these discrepancies and through email communication with the authors, we were able to identify why the treatment variables did not coincide. Newman and Hartman’s process began by calculating the distance of each CCES respondent to the closest mass shooting that occurred between 1966 and 2015. Then, to code their treatment variable, they determined whether the closest shooting during that 50-year period was (a) within 100 miles of the respondent and (b) occurred between the 2010 and 2012 panel waves. In other words, their treatment variable does not capture whether a panel respondent lived within 100 miles of a shooting that occurred between the panel waves, but rather whether the respondent lived in a ZIP code for which the closest shooting during the 50-year period happened to have occurred between those two waves (and was within 100 miles).
To illustrate this discrepancy, we use the 2011 mass shooting in Tucson, Arizona as an example. This is the first mass shooting that occurred between the two waves of the CCES panel survey. Using our approach, we identified ninety respondents who lived in a ZIP code that was within 100 miles of that shooting. However, in Newman and Hartman’s replication dataset, only thirty-one of those ninety respondents are coded as treated. The set of untreated respondents includes fifteen individuals who lived less than 20 miles from the 2011 Tucson shooting. The issue is that of the ninety respondents who lived within 100 miles of the 2011 Tucson shooting, fifty-nine lived closer to some other shooting that occurred from 1967 to 2015. Twenty-one respondents lived in a ZIP code that was closer to a 2002 shooting in Tucson, four lived in a ZIP code that was closer to a shooting that happened in 2008 at South Mountain Community College (Phoenix, Arizona), and thirty-four lived in a ZIP code that was closer to a shooting that occurred in Mesa, Arizona in 2015. Put another way, of the ninety respondents who lived within 100 miles of the 2011 Tucson shooting, twenty-five were coded as untreated by Newman and Hartman because they lived in a ZIP code closer to a shooting event that had happened in the past, and 34 were coded as untreated because they lived in a ZIP code closer to a shooting event that would occur in the future.
Table 2 presents the results from three models.Footnote 5 The first set of estimates comes from a direct replication of the model that Newman and Hartman present in Table 1 of their article.Footnote 6 The second set of results estimates the same model (using the same data), but this time using our treatment variable. Thus the coefficient on the treatment in the second model shows the effect of respondents having experienced a shooting event within 100 miles of their ZIP code. Note that coding the treatment in this way not only means that the coefficient on the treatment is no longer statistically significant, it also changes the sign on the treatment to negative. This indicates that re-estimating the Newman and Hartman model by coding the treatment variable in the way that it is explained in the article provides a small, negative and null effect for the intervention of a mass shooting event.
Table 2 Two-year subset of 2010–2014 panel, multilevel models
Note: standard errors in parentheses. *p<0.05, **p<0.01, ***p<0.001
In email correspondence, the authors indicated that their coding was designed to account for the fact that they only wanted to code as treated those individuals who experienced a shooting between the two waves of the panel if it was their closest shooting to date. The general reasoning appears to be that experiencing a second shooting event after one has already had a shooting event near them might have less of an influence on their opinions. There is certainly a logic to this notion, but we do not think their coding scheme is the correct way to account for this. After all, this approach takes the closest shooting event to a respondent’s ZIP code that occurred at any time from 1966 to 2015. This means that they may be coding somebody as untreated because they live in a ZIP code that was closer to a shooting that occurred several decades earlier. Given the rates of residential mobility in the United States, few Americans are likely to live in the same ZIP code as they did several decades prior, and even if they did, the effects of living near a mass shooting from decades earlier may have faded. Even more problematic is the possibility that respondents could be coded as untreated when they experienced a mass shooting event between the panel waves because they would experience a closer shooting event in the future. In fact, this appears to be why thirty-four of the ninety respondents who lived within 100 miles of the 2011 Tucson shooting were coded as untreated: they lived closer to a shooting that happened three years after the second wave of the panel.
Thus a better approach to accounting for the possibility of pre-treatment is to test whether the treatment effects are conditional on having lived within 100 miles of a mass shooting event that occurred during some reasonable amount of time before the launch of the panel survey.Footnote 7 This is what we do in the third model in Table 2. Specifically, we include an indicator for whether a respondent lived in a ZIP code that was within 100 miles of a shooting event that occurred during the decade prior to the start of the panel.Footnote 8 Even with this specification, we find little evidence that a shooting intervention mattered, either for those who lived in a ZIP code proximate to a shooting during the previous decade or those who did not. The latter group is perhaps the most important; after all, we expect that experiencing a mass shooting event should have the greatest impact on those who had never experienced one nearby before. The first coefficient in the table (β = 0.0385) is equivalent to the treatment effect for this group; it is close to zero and is not statistically significant. In short, conditioning the treatment on (likely) prior exposure to a mass shooting event also fails to produce evidence that living near mass shooting events affects public opinion on gun control.
Extending The Analysis
So far, we have shown that a discrepancy in the coding of the treatment variable has important consequences for whether we find an effect for mass shootings on public opinion using the authors’ own data and their own approach to specifying the model. However, there are three main reasons to treat this result with caution. First, as we note above, the authors use a panel dataset with a smaller sample size than what is actually available for the same period. Thus, here we test for an effect using a larger sample, which provides more power for the test.
Secondly, the authors use a hierarchical model with individual-, ZIP-code and county-level control variables. However, such an approach still allows for the possibility of confounding variables. While no approach can completely eliminate confounding factors that vary over time, we can rule out any time-invariant confounding factors. We do this by analyzing a panel time-series model with individual fixed effects. This allows us to test for within-subject attitude change for a more rigorous assessment of causal effects. In particular, we present fixed-effects panel regressions in order to separate the causal effects of proximity to a mass shooting from the secular effects of attitude change over time within each respondent. To do this, we recode the dependent variable so that support for increasing gun control is coded 1, keeping laws the same is coded 0.5, and reducing gun control restrictions is coded 0.
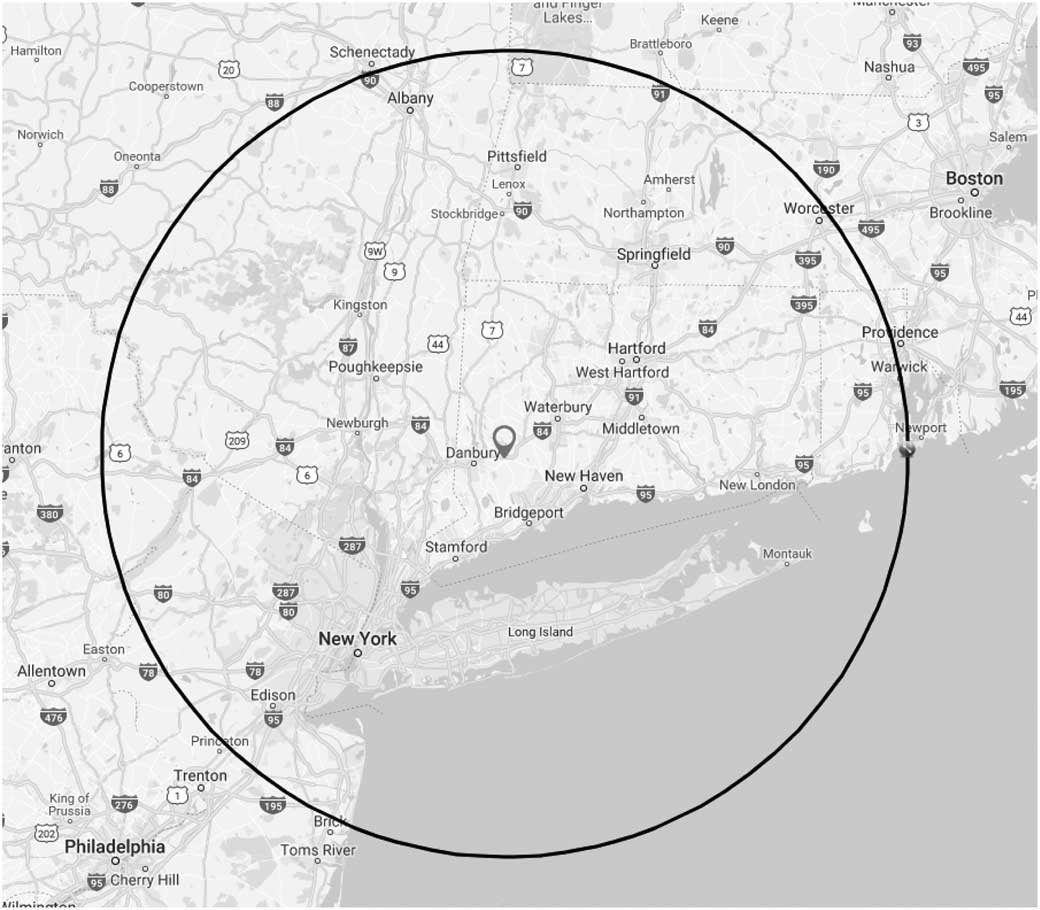
Thirdly, and perhaps most importantly, there are a variety of different ways that one can conceive of the treatment. For example, perhaps the 100-mile threshold is too large: a 100-mile radius around Newtown, Connecticut (the site of the 2012 Sandy Hook Elementary School shooting) would include not only all of New York City and Long Island, but also Albany, New York, parts of Vermont and Pennsylvania, and much of Rhode Island and Massachusetts (see Figure 1). Yet, it seems unlikely that residents of Albany or New York City, for example, would be nearly as impacted by the shooting event as those in nearby Connecticut towns. Thus in the analyses that follow, we test a number of different distance thresholds to capture closer distances to those events. Fortunately, the larger size of the 2010–2012 CCES panel survey that we draw on allows us to set lower thresholds while still including a reasonable number of treated individuals.Footnote 9
Figure 1 A 100-mile radius around Newtown, Connecticut
It is also possible that a distance threshold is not the appropriate way to think about the local impact of a mass shooting event. Except for those in the very immediate area, exposure to such events may largely happen through news coverage of the event and its aftermath. Accordingly, living the same local media market may matter more. Thus, we also test whether living in the same media market as a mass shooting affects gun control attitudes.Footnote 10
Results
Table 3 summarizes the results of six regression models run on the full 2010–2012 CCES panel. Thus these models are estimated on 16,825 respondents whose attitudes were recorded in both 2010 and 2012. Following Newman and Hartman, we exclude respondents who moved between waves. Additionally, we include a control for the number of murders per capita in the respondent’s county, since this is the only control variable that Newman and Hartman include that does vary over time. Because each of these models include individual and time fixed effects, the coefficient for each treatment can be interpreted as the difference-in-differences effect among those exposed to a shooting event.
Table 3 2010–2012 panel, fixed-effects regressions
Note: standard errors in parentheses. *p<0.05, **p<0.01, ***p<0.001
Regardless of the distance threshold used for the treatment indicator, the coefficient for the treatment is never statistically significant and the magnitude is always less than 0.01.Footnote 11 Contrary to the findings presented by Newman and Hartman, this consistently indicates that living near a mass shooting has no discernible effect on citizens’ attitudes toward gun control. When the treatment is operationalized as residing in a media market where a shooting occurred, the treatment still lacks statistical significance and has a similarly sized coefficient. Even if the coefficients did achieve statistical significance, the magnitude is small – in each case, these coefficients would translate into less than a 1-point increase in support for increased gun control. Note that the variable for panel year is consistently significant in these analyses, accounting for about a 2.5-point increase in support for gun control. In other words, while living close to a mass shooting did not increase support for gun control laws, the sample as a whole seems to have become marginally more supportive of gun control during this period.
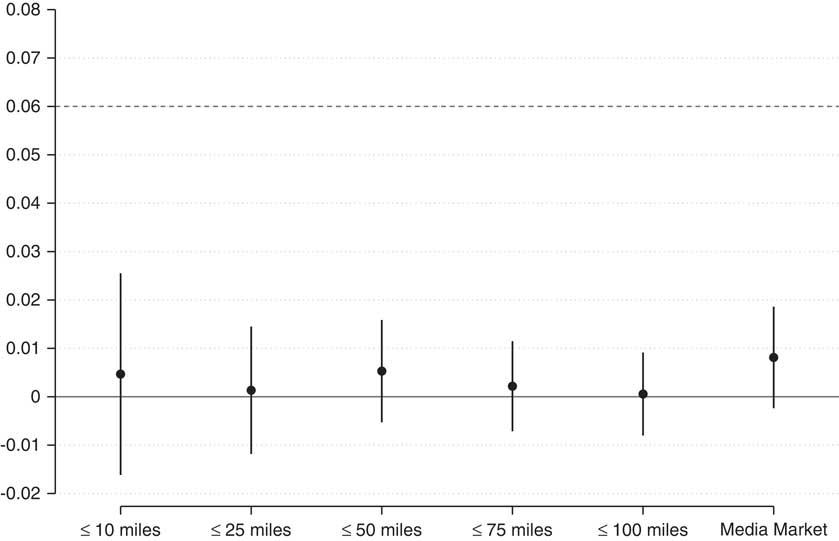
An alternative means of interpreting these results is to compare the effect sizes of the various treatment thresholds to the marginal effects estimated by Newman and Hartman (for example, Rainey Reference Rainey2014). This approach treats Newman and Hartman’s reported effects – a 6 per cent increase in the probability that one will support more restrictive gun control measures – as the null hypothesis, and tests for a negligible effect relative to this estimate. Figure 2 plots the coefficients for the treatment effects from Table 3. The line at 0 indicates ‘no effect’ in a traditional hypothesis testing framework, while the dashed line at 0.06 indicates the size of the effect reported by Newman and Hartman.Footnote 12 As is clear from this plot, there is considerable separation between the upper bound of the confidence intervals on our estimated treatment effects and the size of the effects found by Newman and Hartman. We interpret these results as suggesting a rejection of substantively meaningful effects.
Figure 2 2010–2012 panel, treatment effects of mass shootings compared to Newman and Hartman’s estimate
Note: plot of the treatment effect coefficients reported in Table 3. Vertical lines represent 95 per cent confidence intervals.
Analyzing the three-wave cces panel
To further test for the effect of mass shooting events, we extend our analysis to the full 2010–2012–2014 CCES panel. This panel adds a third measurement for gun control attitudes in 2014, which means we have two windows within which we can measure a treatment effect: between 2010 and 2012 and between 2012 and 2014.Footnote 13 As with the prior analysis, we continue to include both individual and year fixed effects. Note that since we are using the long panel for this analysis, our sample size drops to 7,944 respondents who did not move during the three waves.
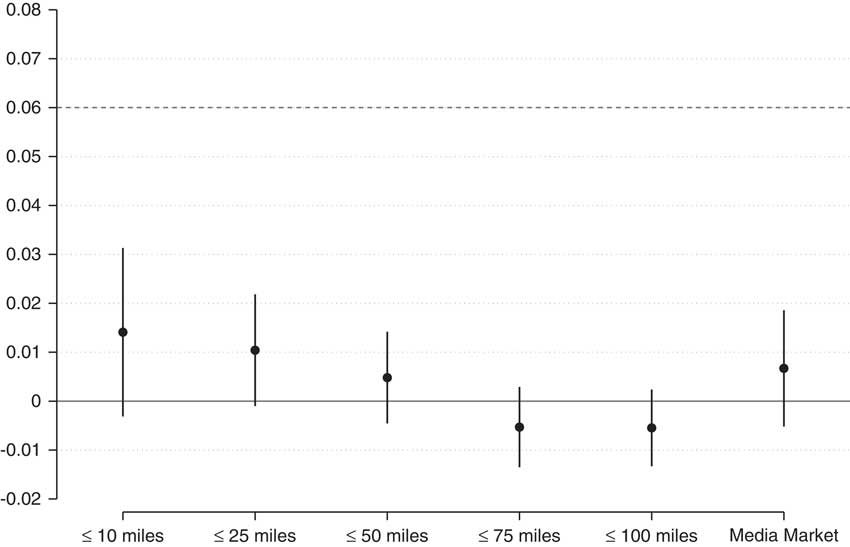
Table 1 presents the full results of the models from the longer panel analysis, and Figure 3 plots the coefficients and confidence intervals for the treatment variable.Footnote 14 Once again, we fail to find any statistically significant treatment effects for having a mass shooting occur proximate to respondents.Footnote 15 Depending on the threshold used, the coefficient for the treatment variable ranges from 0.014 to –0.005, but in no instance is the coefficient statistically significant; even at its maximum size, the magnitude of the effect would be less than 1.5 points. As was the case with the shorter panel, our treatment coefficients also do not overlap with the magnitude of the effect reported by Newman and Hartman. We interpret this as further evidence of a rejection of the null hypothesis that mass shootings have substantively meaningful effects on gun control attitudes, instead suggesting that any effects are negligible.
Figure 3 2010–2012–2014 panel, treatment effects of mass shootings compared to Newman and Hartman’s estimate
Note: plot of the treatment effect coefficients reported in Table 1. Vertical lines represent 95 per cent confidence intervals.
Polarizing Effects
While we fail to find any main effects for mass shooting events, we also consider the possibility that mass shootings may serve to polarize opinion on gun control based on a respondent’s party identification. Newman and Hartman also explore this possibility in their article, though exclusively with the cross-sectional (rather than panel) data that they analyze. They find that ‘there are no significant differences in the effects of proximity when focusing on respondents situated at opposite ends, or in the middle, of the partisanship spectrum’ (Newman and Hartman Reference Newman and Hartman2017, 14). We modified the models presented in Tables 1 and 3 to test for partisan conditional effects. Specifically, we interact our mass shooting treatment variables with indicators for whether a respondent identified as a Democrat, Independent or Republican during the first wave of the panel.Footnote 16 Because a respondent’s party identification during the first wave of the panel is a fixed effect, the component terms of this interaction are excluded and the interaction terms themselves capture the conditional effects.
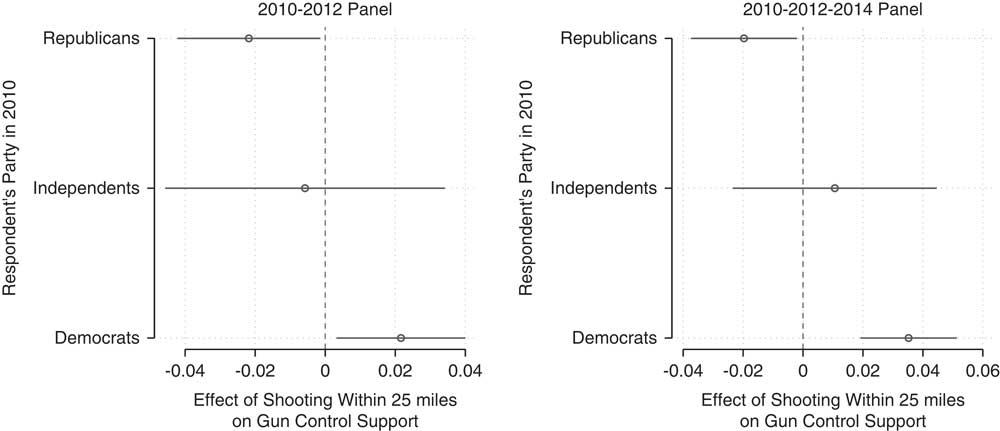
The full results for our tests are presented in Appendix Tables SI.6 and SI.7. In general, we do find some evidence that mass shootings serve to polarize opinion. In most of the models we estimated, the coefficient for the treatment among Democrats was positive, while the coefficient for the treatment among Republicans was negative. While these coefficients are not always statistically significant, they are more than half the time. Thus, in contrast with the conclusion offered by Newman and Hartman, there is some evidence that mass shooting events may cause Democrats to become more supportive of increasing gun control regulations while Republicans become less supportive of doing so. To provide a sense of the potential size of these effects, Figure 4 plots the treatment effects by party when using the 25-mile radius as the treatment threshold. The left-hand plot in the figure shows the results from the 2010–2012 panel data. The results from this model indicate that having a mass shooting occur within 25 miles causes Democrats to become about 2 points more supportive of gun control, on average, while Republicans become about 2 points less supportive. In the 2010–2012–2014 panel data, a mass shooting event again depresses Republican support for gun control by about 2 points, but the increased support from Democrats is about 3.5 points.
Figure 4 Treatment effects of mass shootings by party of respondent
Note: estimates based on panel time-series models with individual fixed effects. Horizontal lines represent 95 per cent confidence intervals. Full model results available in Appendix Tables 6 and 7.
Conclusion
In this article, we have replicated and extended the panel analysis in Newman and Hartman. Based on our results, we believe it would be appropriate to revise the empirical record on the effect of mass shootings. Specifically, we find no evidence that the occurrence of a mass shooting causes opinion to become, overall, more supportive of gun control policy. Across a variety of different specifications, the general effect that we uncover for mass shooting events is small and not statistically distinguishable from zero. This runs counter to the findings reported by Newman and Hartman. Of course, our replication and extension deals solely with the panel analysis presented by Newman and Hartman, but given our revised analysis suggesting null results using that approach, it does raise questions about whether the cross-sectional results they show may be caused by some unobserved confounding variables.
Also unlike Newman and Hartman, we find that the effects of mass shootings are conditional on an individual’s partisanship. In particular, mass shootings appear to polarize public opinion, by moving Democrats to become more supportive of increasing gun control regulations and Republicans to become less supportive. In the aggregate, of course, this polarization of opinion cancels out, but it is certainly noteworthy that each mass shooting event may serve to push partisans even farther apart on this issue. Considered alongside the null results of simple treatment effects, our findings suggest a somewhat different set of implications than those articulated by Newman and Hartman. To the extent that mass shootings may affect public opinion, the result is polarizing rather than consensus building. As a consequence, policy efforts aimed at curbing gun violence may face significant barriers, with mass shootings failing to seriously alter the status quo of aggregate public opinion toward gun control.
Supplementary Material
The supplementary material for this article can be found at https://doi.org/10.1017/S0007123418000352. Data replication sets are available in Harvard Dataverse at: https://doi.org/10.7910/DVN/YJQIXP
Acknowledgements
We would like to thank Benjamin Newman and Todd Hartman for their helpful discussions and clarifications, and Eitan Hersh for his comments and feedback.