It is well known that, in the United States, men now identify more as Republicans and less as Democrats than women do.Footnote 1 This is a relatively recent phenomenon. From the dawn of modern polling in the 1930s and on into the 1950s, women identified as Republicans and supported Republican presidential candidates a bit more than men did.Footnote 2 Following a period in which gender differences in partisanship were largely absent, the modern partisan gender gap emerged during the late 1970s and early 1980s.Footnote 3 While the same pattern wasn’t initially present in other advanced industrialized countries,Footnote 4 by the 1990s men identified with conservative parties and supported conservative candidates more than women in many of these countries as well.Footnote 5
Many different theories about the modern partisan gender gap attribute its emergence to an alleged growing divergence between men’s and women’s policy preferences. Some scholars highlight social changes, such as greater female labor force participation, liberalized divorce laws or feminist political socialization among younger generations, that they posit caused growing differences in preferences between the sexes. However, there is little evidence of preference divergence in the United States. Roughly since the start of modern polling, men have consistently expressed more conservative opinions than women on a series of issues, including criminal justice, social welfare and foreign policy.Footnote 6 Shapiro and Mahajan’s meta-analysis finds that gender differences in opinions in the United States were roughly stable from 1964 to 1983, the entire period that they examined and the period when we find that the modern partisan gender gap emerged and grew the most.Footnote 7 More recently, Clark finds that the magnitude of gender preference differences in the General Social Survey (GSS) has been fairly consistent over time.Footnote 8
We argue that ideological party sorting, rather than preference divergence, was the main mechanism causing the emergence of the partisan gender gap in the United States between the 1960s and the 1990s. Since the 1960s, the US public has gradually perceived more and more of the elite-level ideological party polarization that occurred during this time.Footnote 9 The pattern of party ideological polarization at the elite and mass levels is at least partially driven by liberal and conservative social movements and interest groups increasingly affiliating with the Democrats and Republicans, respectively. This is true on women’s rights issuesFootnote 10 as well as in many other areas.Footnote 11 As this happened, it caused slow, but steady, changes in mass-level party identification as, over many years, people sorted into parties that better matched their policy preferences.Footnote 12 Because men consistently held more conservative positions than women on several prominent issues, this sorting fueled the modern partisan gender gap’s emergence.
We test this explanation using two datasets, each with important, yet different, strengths. The biennial American National Election Studies (ANES) surveys contain detailed questions about respondents’ partisan identification, policy preferences and perceptions of the parties’ ideological stances. However, ANES surveys are too small and infrequent to precisely measure variation in the partisan gender gap over time or differences in its size between groups, such as those with more and less awareness of polarization. To remedy this, we assembled the largest dataset ever used to study the partisan gender gap. We pooled individual-level responses to 1,825 Gallup polls that included questions about gender and party identification from 1953 through 2012. While lacking the ANES’s variety of political questions, the Gallup dataset gives us much more statistical power to precisely track party identification separately by gender and education (which proxies for awareness of polarization) over time. By leveraging the different strengths of these datasets, we find support for our argument that the modern partisan gender gap emerged largely because party polarization made longstanding gender opinion differences more relevant to partisanship.
Existing Literature
Males’ disproportionate support of Ronald Reagan in 1980 sparked scholarly and journalistic interest in the emergence of America’s modern partisan gender gap. Since then, scholars have put forth several explanations that, in different ways, claim this gap emerged because of increasing differences between men’s and women’s policy preferences. One group of explanations claims that women began to prefer a larger welfare state than men because women grew more economically vulnerable. Declining marriage rates and increasing divorce rates are often cited as sources of this increased relative economic vulnerability. In support of this idea, Edlund and Pande find that the partisan gender gap is larger in US states where divorce is more prevalent and that, in panel data, marriage and divorce make men and women more Republican and Democratic, respectively.Footnote 13 Similarly, Iversen and Rosenbluth find that the partisan gender gap is larger in the unmarried population in European countries.Footnote 14 Also consistent with this, Box-Steffensmeier, De Boef and Lin analyze aggregated time-series data and find that the US partisan gender gap increases when economic performance wanes and the number of economically vulnerable single women increases.Footnote 15 Also consistent with an economic vulnerability explanation, several studies show that women tend to perceive the economy more negatively than men do.Footnote 16
A second group of explanations contends that growing female labor force participation caused gender policy preferences to diverge on some issues. For example, Inglehart and Norris’ ‘Developmental Theory of Gender Realignment’ claims that women’s attitudes on cultural issues, such as freedom of self-expression and gender equality, moved substantially to the left in affluent countries because of their increased labor market experience and economic independence from men.Footnote 17 Along similar lines, Iversen and Rosenbluth contend that growing female labor force participation led women to prefer a larger welfare state than men because they needed it to sustain their new economic independence.Footnote 18 They cite public sector employment and subsidized daycare as examples of policies that make it easier for females to maintain their careers while raising children. Consistent with this hypothesis, they show that, in European countries, the gender gap in support for public employment and left-leaning political parties is larger among labor force participants.Footnote 19 Carroll argues that, by making women less economically and psychologically dependent on men, increased labor market participation allows women to make more independent assessments of their political interests.Footnote 20 Huddy, Cassese and Lizotte call this the ‘economic autonomy hypothesis’.Footnote 21 Consistent with this, Manza and Brooks show, in the United States, that women who work outside the home and in more economically independent professions more often vote for the Democratic Party than women who do not.Footnote 22
A third body of work argues that the increasing influence of feminism caused women to become relatively more liberal than men, particularly on social issues. Consistent with this, Inglehart and Norris find that a substantial portion of the partisan gender gap in wealthy countries is explained by differences in cultural attitudes toward postmaterialism, support for gender equality and the role of government.Footnote 23 Also consistent with this idea, Kaufmann finds that, over time, American women’s attitudes on social issues increasingly correlate with their party identification, and Conover and Manza and Brooks find that women with a feminist consciousness have more liberal policy attitudes and are more likely to identify as Democrats.Footnote 24
Few of the studies discussed above test whether their chosen explanation actually produced any growth in policy preference differences in the United States.Footnote 25 This is largely because of the sparse amount of data available on issue preferences in the time period that the modern partisan gender gap developed. Instead, these studies generally relate their causal variables to gender differences in partisan identification or vote choice, while assuming that any observed associations occur because the effects flow through divergent policy preferences.Footnote 26 A problem here is that the two most comprehensive studies looking directly at American gender differences in policy preferences find little evidence of preference divergence when the partisan gender gap emerged. Shapiro and Mahajan’s meta-analysis of gender differences on 962 issue questions asked from 1964 through 1983 shows that gender differences were of a similar magnitude in 1964–1971, 1972–1976 and 1977–1983.Footnote 27 Similarly, DiMaggio, Evans and Bryson find ‘slim evidence of a growing gender gap’ in issue preferences on the ANES or GSS between 1972 and 1994.Footnote 28 While these studies can be critiqued for aggregating too many questions, and thus potentially obscuring growth in gender differences on selected items, they conclusively show that men had more conservative policy preferences than women even before the partisan gender gap was present, and that overall preference differences did not grow as it emerged.
In what areas do men’s and women’s policy preferences consistently differ?Footnote 29 Shapiro and Mahajan show that men were significantly more conservative than women on the size of the welfare state and issues related to the use of force, such as national defense and criminal justice policy.Footnote 30 Kaufmann and Petrocik show that men have held more conservative social welfare views than women since at least the 1950s.Footnote 31 Other studies confirm gender differences on issues related to the use of force,Footnote 32 which appear to date back at least to the 1940s.Footnote 33
If men’s and women’s issue preferences have differed in several areas since prior to the 1960s, why didn’t the partisan gender gap form earlier? In the next section, we argue that this is because people did not perceive that the parties were sufficiently differentiated on the issues on which men and women disagreed. We are not the first to relate elite party polarization and mass-level sorting to the development of the partisan gender gap. Activists in the 1980s publicized the growing differences between the Democratic and Republican platforms on women’s rights issues, like abortion and the Equal Rights Amendment to explain the partisan gender gap.Footnote 34 Yet a problem with that explanation is that men and women reported similar preferences on these types of issues throughout the decades when the gender gap emerged.Footnote 35 In addition, the partisan gender gap predates polarization in the national party’s positions on these issues, which largely occurred after 1976,Footnote 36 and campaign appeals about traditional women’s issues do not seem to increase the partisan gender gap.Footnote 37 All of these reasons make it unlikely that sorting only on traditional, stereotypically gendered (or ‘social’) issues caused the partisan gender gap to emerge.
Our argument is most similar to, and builds on, Kaufmann and Petrocik’s claim that the partisan gender gap was caused by an increase in the influence of social welfare preferences on partisan identification.Footnote 38 While we agree with the main thrust of Kaufmann and Petrocik’s thesis, we advance their line of argument both theoretically and empirically. We draw on the ideological sorting literature and argue that people increasingly sorted into parties that matched their preferences in all prominent political domains, not just social welfare. We also explain and show how awareness of party polarization is a necessary step in the causal process.Footnote 39 While Kaufmann and Petrocik examine only the 1992 and 1996 ANES surveys, both of which were administered after the gender gap had emerged, we employ six decades of ANES and Gallup data.
Theory and Hypotheses
Since the 1960s, Democratic and Republican politicians more consistently took liberal and conservative positions, respectively, on a wide range of prominent national political issues, including the size of the welfare state, crime, civil rights and military aggressiveness.Footnote 40 Over time, some members of the public noticed that their issue preferences were increasingly inconsistent with their party loyalties.Footnote 41 Slowly, some of these people adjusted their preferences to match their partisanship, while others did the opposite: sorting into a party that better matched their policy preferences.Footnote 42
We theorize that this ideological sorting led to the emergence of the modern partisan gender gap. As we discussed in the previous section, men have consistently held more conservative policy views than women in major issue areas, even prior to the emergence of the partisan gender gap. There are more Democratic men than women with conservative issue preferences, and more Republican women than men with liberal issue preferences. Thus ideological sorting led relatively more men than women to move from the Democrats to the Republicans, and relatively more women than men to move from the Republicans to the Democrats. Because the partisan gender gap was emerging when Republican identification was near an all-time low following Watergate, there were more out-of-sync conservative Democrats than out-of-sync liberal Republicans. Thus an additional implication of our theory is that the partisan gender gap developed more because of a change in men’s than women’s partisanship, which is consistent with the findings of Wirls, Kaufmann and Petrocik, and Norrander, among others.Footnote 43
We expect that the partisan gender gap gradually emerged in response to awareness of increasing party polarization. It is well established that party identification is a sturdy attitude that only responds to major political change, and even then does so only slowly.Footnote 44 In the short term, people rarely leave a party that is out of sync with their issue preferences. Instead, some adjust their issue preferences to match their partisanship,Footnote 45 particularly when the perceived differences between ideology and partisanship are not large.Footnote 46 Moreover, McCarty, Poole and Rosenthal show that elite polarization occurred slowly at first, before becoming more rapid in the late 1970s.Footnote 47 Even after elite polarization occurred, it may have taken some time for people to be aware of it. All of this indicates that the type of sorting we are concerned with – changing one’s partisanship to match issue preferences – does happen, but only gradually over many years.Footnote 48
Our theory predicts that we should observe a partisan gender gap first among those who perceive the most polarization between the two parties. Previous work shows that education and other measures of political engagement are positively associated with knowledge of elite political positions, especially when those positions change over time.Footnote 49 Thus if the partisan gender gap is ultimately driven by people noticing the increasing ideological polarization of the two parties, it should emerge earlier and be larger among those with more education.
We can summarize our main argument with three main hypotheses, the second of which has two parts:
Hypothesis 1: The partisan gender gap should emerge slowly as the parties become more polarized.
Hypothesis 2: The partisan gender gap should be larger among those who perceive more political polarization.
Hypothesis 2a: The partisan gender gap should be larger among the more educated.
Hypothesis 2b: Because the relationship between education and the partisan gender gap flows through perceptions of polarization, that relationship should shrink when one controls for those perceptions.
Hypothesis 3: At the same time that the partisan gender gap emerged, the association between individuals’ issue preferences and partisanship should have increased, especially among college-educated men and women, who have (according to Hypothesis 2a) the largest partisan gender gap.
Data
We test these hypotheses using two datasets, each with its own strengths: the ANES and a new individual-level dataset of pooled responses to Gallup polls from 1953 through 2012. As the ANES is used widely in political science, we will not describe it in detail here, but simply highlight its advantages for our project. Since 1970, the ANES has asked respondents about their perceptions of the positions of the Democratic and Republican parties in a variety of issue domains. This allows us to directly relate perceptions of polarization to the partisan gender gap. The ANES also contains detailed policy preference questions on a variety of areas during the decades when this gender gap arose. This allows us to study how the gender gap in issue preferences changed before and after the emergence of the modern partisan gender gap.
Much of the existing literature on the partisan gender gap examines only the ANES,Footnote 50 even though it only contains somewhere between 1,000 and 3,000 respondents, usually sampled every two years since 1952. Several studies use the GSS instead,Footnote 51 which has a similar sample size and has been conducted at similar intervals since 1972. To measure exactly when the partisan gender gap emerged, and among whom, we need bigger samples. This is particularly true when examining whether the gap’s size depends on attributes like education, because comparing the gap between subpopulations requires a sufficient sample in each of them.
To improve on the ANES and GSS’s statistical power, we pooled frequent Gallup surveys to assemble the largest dataset ever used to study the partisan gender gap. While some have used aggregate commercial survey data to model the dynamics of men’s and women’s partisanshipFootnote 52 and presidential approval,Footnote 53 we are aware of no previous studies that have used individual-level data to do so. In Appendix Section 7.1, we describe our collection of individual-level responses from every poll conducted by the Gallup Organization from 1953 through 2012 that (1) asked about presidential approval, party identification and/or ideology and (2) is contained in the Roper Center iPOLL database.Footnote 54 The dataset contains 2,250,703 observations from 1,825 surveys that ask a nationally representative sample about their gender and partisan identification. Because at least 13, and often substantially more, Gallup polls are available in every year our dataset covers, the pooled dataset contains tens of thousands of respondents per year. This gives us greater statistical power to precisely measure how the partisan gender gap changes over time and to examine subgroups, such as college graduates, separately, while maintaining adequate sample sizes.Footnote 55
There are also drawbacks to our Gallup dataset. Many demographic characteristics and political attitudes that we would like to observe are asked sporadically, if at all. Given the substantial cost of merging each additional variable, and the limited usefulness of merging a variable only asked in, for instance, two or three surveys, we only merged variables into the pooled dataset that were asked relatively consistently over time.Footnote 56 The only attitudes that were probed consistently enough to make them useful to merge together were presidential approval, party identification and, since 1992, ideological self-placement. Thus we are unable to examine specific issue preferences over time using Gallup data.
Gallup data also do not contain direct questions about perceptions of the ideological positions of the parties or several other types of questions used to measure political awareness in the ANES.Footnote 57 We use education as a proxy for respondents’ awareness of changing elite party positions and ability to understand the consequences of those positions for their own party affiliation. Because education is strongly correlated with media exposure and overall political sophistication,Footnote 58 it is often used as a proxy for these types of attributes in public opinion scholarship.Footnote 59 For example, Carmines and Stimson argue that the politically ‘sophisticated’ are more likely to notice long-term changes in party positions, and use education, in addition to political information questions, to measure political sophistication.Footnote 60
Gallup asks about party identification in a slightly different manner than the ANES, GSS and CBS/New York Times polls. Gallup asks ‘In politics, as of today, do you consider yourself a Republican, Democrat or Independent?’Footnote 61 Abramson and Ostrom argue that the Gallup question, which is also used in Erikson, MacKuen and Stimson’s analysis of ‘macropartisanship’, introduces more short-term political and economic considerations than the standard party identification question.Footnote 62 Yet while important, these differences should not be overstated. ANES party identification and Gallup party identification are substantially correlated both within individuals and in their aggregate movements over time.Footnote 63
A related complication is that Gallup did not always follow up with Independents and ask whether they lean towards a party. They did so occasionally in the 1950s, almost never in the 1960s and 1970s, sometimes in the 1980s, and then regularly from the 1990s on. As we cannot consistently observe Independent leaners in the Gallup data, we code them as Independents in our main analysis. Because men are more likely than women to label themselves as Independent leaners rather than partisans,Footnote 64 we check the robustness of the results to including leaners as partisans in the subset of surveys that ask about leanings (see Appendix Section 7.5).
A final issue is that Gallup changed from using in-person surveys to phone surveys over time. When both modes were used during the late 1980s and early 1990s, it showed that phone respondents tend to be more Republican than in-person respondents.Footnote 65 Thus we need to take care when looking at long-run changes in the partisan gender gap to account for any differences caused by this change in survey mode.
Results
The Gradual Increase in the Partisan Gender Gap
Hypothesis 1 predicts that the partisan gender gap emerged gradually as people became aware of the increasingly large differences between Democratic and Republican elites’ policy positions. What can be observed in surveys like ANES and GSS is that the genders start moving toward the modern pattern sometime in the 1960s, with the modern party identification gap first reaching statistical significance in the 1970s, and become consistently significant in every ANES survey by the late 1980s.Footnote 66 Given the sample size of surveys like the ANES and GSS, it is neither possible to tell whether the small partisan gender gaps in some years in the 1960s, 1970s and 1980s constitute evidence that a partisan gender gap is really present in the population, nor whether the often large year-to-year fluctuations reflect real changes in the partisan gender gap or random sampling variation. Consequentially, existing studies that use ANES or GSS data give varying answers as to when, and how suddenly or gradually, the partisan gender gap first emerged. Kaufmann and Petrocik identify 1964 as the origin of the partisan gender gap because a higher percentage of women have identified as Democrats than men in presidential ANES surveys since then.Footnote 67 However, Norrander notes that this pattern is partially an artifact of men being more likely to initially identify as Independents; she shows that throughout much of the 1970s women were more likely to identify both as Democrats and Republicans than men. When leaners are classified as partisans, there is a statistically significant partisan gender gap in the ANES of about 4 percentage points that first appears in 1972 and 1974, largely disappears in 1976 and 1978, and re-emerges in 1980.Footnote 68
Another consequence of small samples sizes is that the literature often faces a tension between defining the partisan gender gap in terms of substantive or statistical significance. A focus on statistical significance risks missing the partisan gender gap’s emergence, as a modest gender gap will not be statistically distinguishable from zero in a survey with the ANES or GSS’s sample size. But focusing instead on point estimates risks overfitting to explain random variation. Our pooled Gallup dataset alleviates this problem because it combines surveys that are frequent and numerous enough, and thus have a sufficiently large combined sample size, that we can more precisely identify when the partisan gender gap first emerged and its size over time. The smaller standard errors on our estimates of the gap allow us to focus more on its substantive magnitude, while remaining cognizant of the potential for sampling error.
To analyze the partisan gender gap over time with the Gallup dataset, we construct the sample-weighted average partisanship of men and women, respectively, within each survey s in our sample.Footnote 69 Let Prtnshps,i represent the partisanship of respondent i on survey s. We set it equal to 1, 0, and 1/2, respectively, if the respondent identifies as a Republican, Democrat, and neither a Republican nor Democrat. We take a non-parametric approach in which each gender’s partisanship at time t is estimated by taking a weighted average of surveys that occur in close proximity to time t. A key consideration when constructing these weighted averages is determining how much weight is given to a specific survey s based on the proximity of the date of the survey, labeled t s, to time t. We define t s as the midpoint of when survey s was in the field. Based on the results of a leave-one-out cross-validation procedure, we use an Epanechnikov kernel function with a bandwidth of 100 days to construct these weighted averages throughout our analysis.Footnote 70
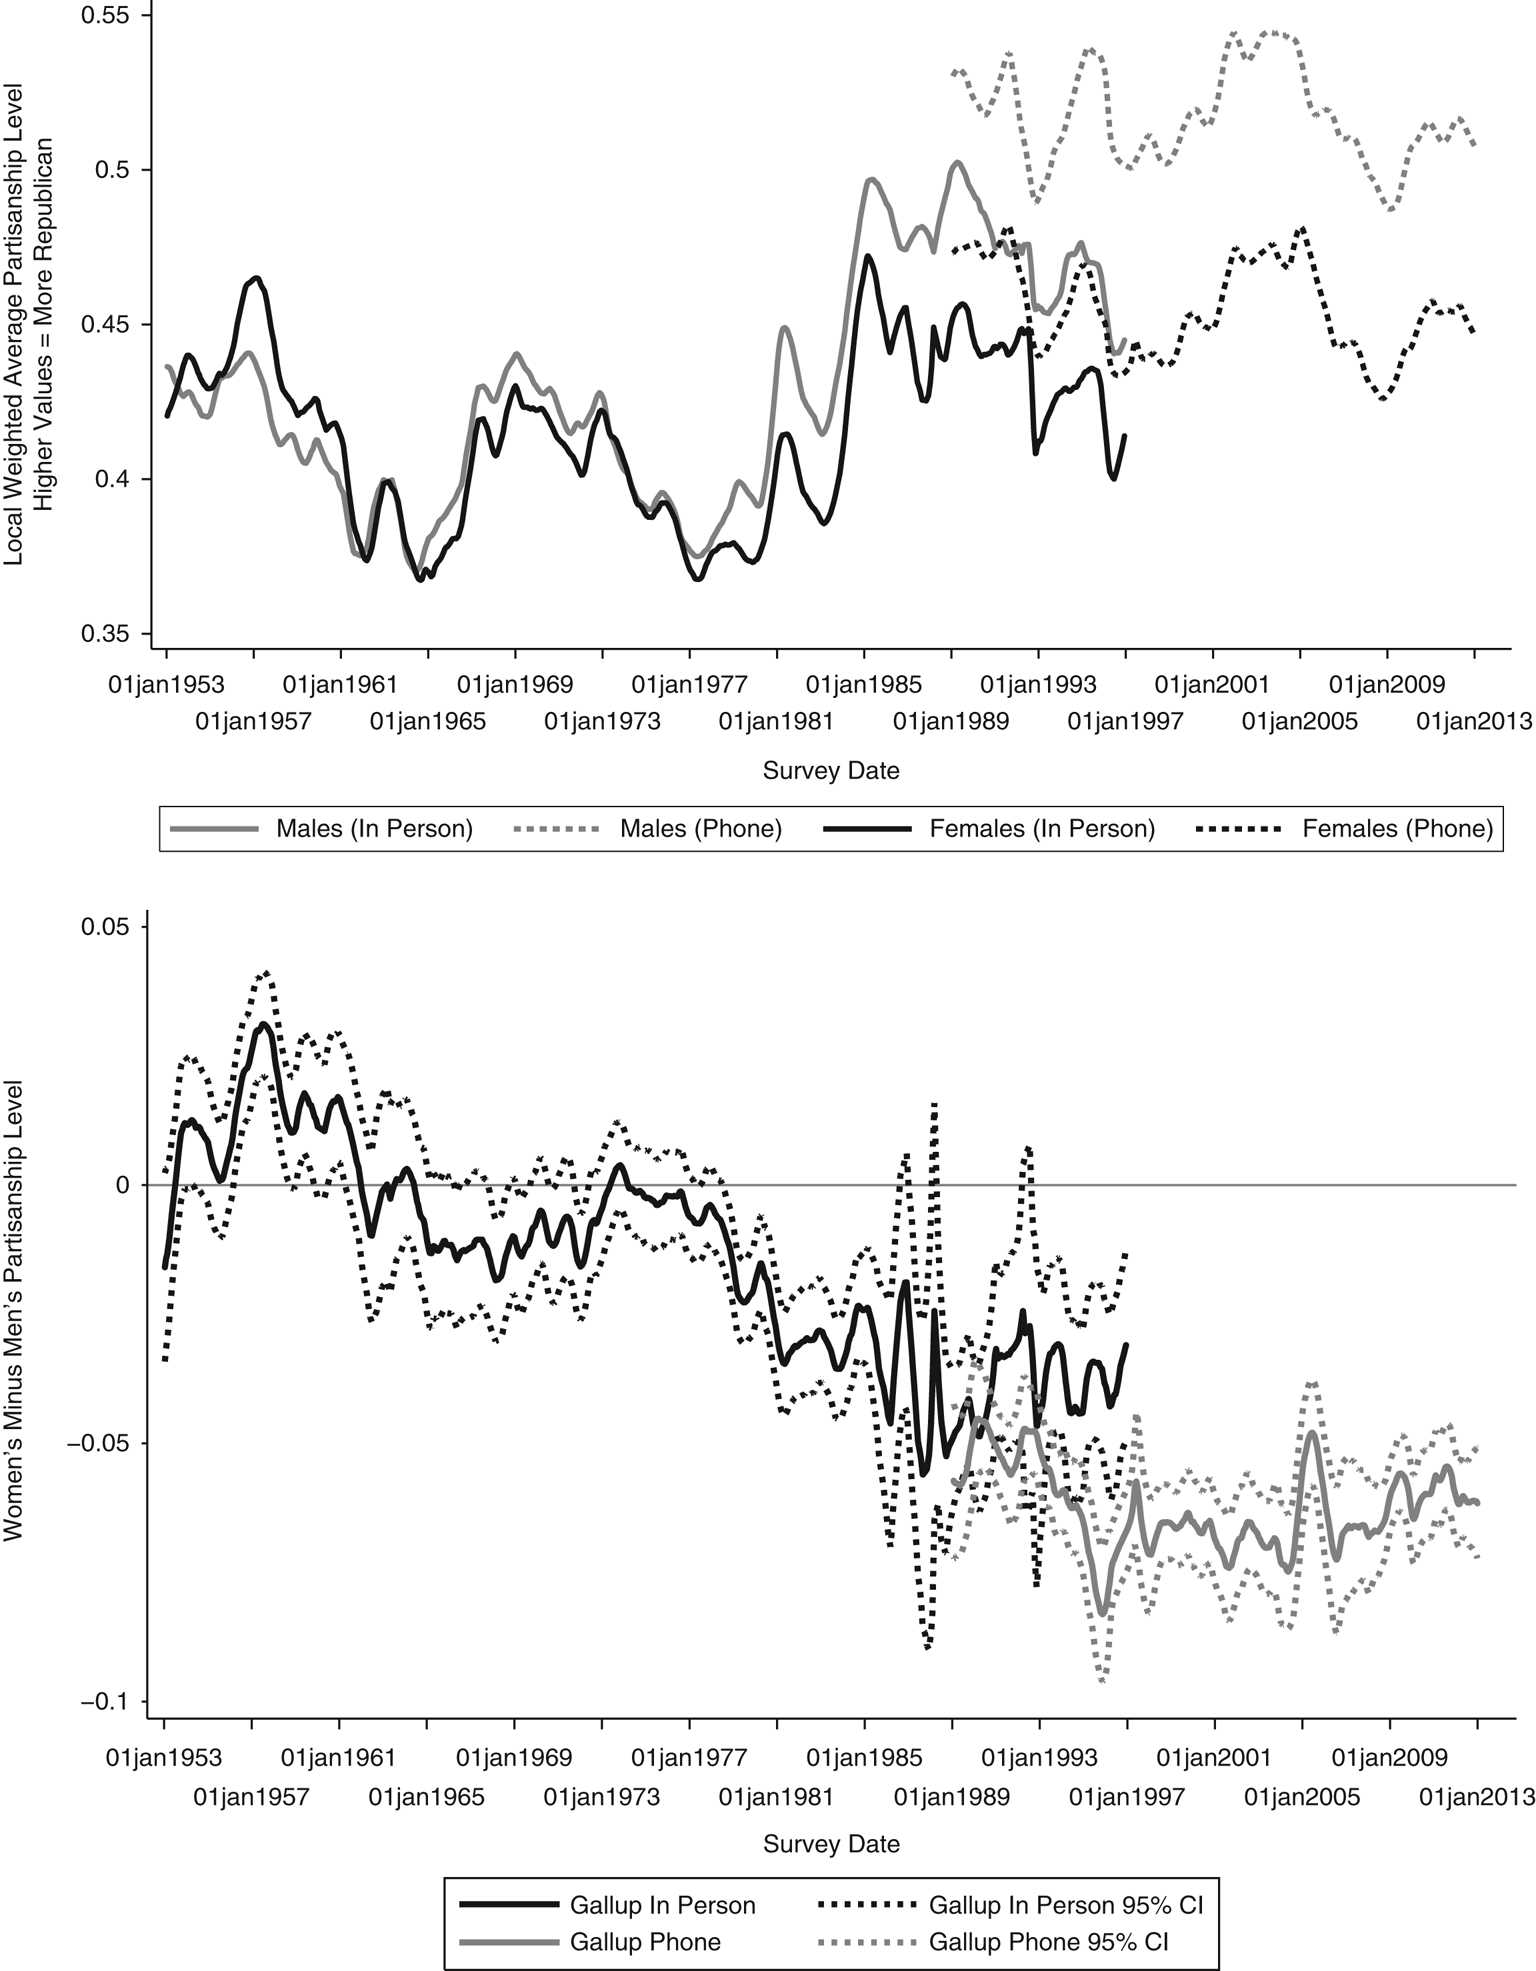
The top panel of Figure 1 presents the evolution of partisanship by gender from 1953 through 2012. Several trends stand out in this broad overview. In the 1950s, American women were slightly more likely than men to identify with the Republicans.Footnote 71 However, the overall partisanship of men and women was quite similar from the early 1960s through the mid-1970s. While both men and women became more Republican from the late 1970s to the early 1990s, men did so at a faster rate. As a result, a substantial partisan gender gap emerged over this time period that remains in place through 2012.

Figure 1. Smoothed partisanship level by gender in Gallup surveys
One can see these patterns most clearly in the bottom panel of Figure 1, which graphs the partisan gender gap over time. There was not much of a gap before the late 1970s. The most rapid change in the gap occurred between 1977 and 1980, when it went from roughly zero to about 4 percentage points.Footnote 72 From 1980 until 1997, the gap oscillated about 3–6 percentage points on in-person Gallup surveys, staying consistently significantly different than zero, with the exception of a couple of instances in which relatively less data caused the standard errors to spike.
The partisan gender gap remained fairly stable in the 1990s and 2000s. In the 1990s, Gallup phased out in-person political polling in favor of phone polling. To ensure that mode effects are not confused with real opinion change, Figure 1 graphs the in-person and phone poll trends separately. There are two mode differences. Both sexes are more Republican in phone surveys than in in-person surveys, producing a mode-driven overall shift toward the Republicans in the 1990s. But our real concern is the gender gap, not the overall partisanship level. The second mode difference is that the partisan gender gap was about two points higher in phone surveys than in in-person surveys conducted in the same time period. Thus the apparent growth in the partisan gender gap in the 1990s appears to come largely from the mode switch. In the 2000s, when Gallup’s transition to phone polling was complete, the gap remained steady at about 7 percentage points. Because in-person polls were used during the bulk of the gender gap’s growth period, followed by stability in the late 1990s and 2000s, we simplify some of our subsequent analyses of the Gallup data by using only the in-person polls at little explanatory cost.Footnote 73
Figure 2 illustrates the advantage of the pooled Gallup dataset’s large sample size for testing Hypothesis 1 by comparing the gender gap estimates in the Gallup data with every ANES and GSS survey during this period. When viewed together, all three series appear to follow the same trend. The partisan gender gap from in-person Gallup surveys is within the ANES’s 95 per cent confidence interval twenty out of twenty-two times and the GSS’s 95 per cent confidence interval 19 out of 21 times. Likewise, the partisan gender gap estimate from phone Gallup surveys is within the ANES’s 95 per cent confidence interval ten out of ten times and the GSS’s 95 per cent confidence interval thirteen of fourteen times. This is roughly the proportion of the Gallup estimates that one would expect to fall outside the 95 per cent confidence intervals due to sampling error. This reassuringly suggests that, despite question wording differences, all three surveys capture a similar construct. The main difference is that the smaller sample sizes in the ANES and GSS produce much larger confidence intervals, which make them unable to detect a significant partisan gender gap in some years in which it is present. For example, ANES and Gallup generate nearly identical point estimates of the partisan gender gap in the late 1980s, but we can only reject the null of no partisan gender gap using Gallup data. Figure 2 shows that, consistent with Hypothesis 1, the development of the partisan gender gap is a smoother process than one might conclude from the ANES or GSS. Several surges and swoons in the gap’s size in the ANES or GSS, which one might be tempted to imbue with political importance if one considered these surveys alone, now appear to be mere sampling variation around the gradual trend.Footnote 74

Figure 2. Comparing partisan gender gap in Gallup, ANES and GSS surveys
Whether ultimately caused by partisan sorting or some other mechanism, it is possible that the partisan gender gap’s growth was driven by specific political events. Using ANES data, Carmines and Stimson argue that 1964 was a ‘critical moment’ that triggered a lot of immediate mass-level party sorting based on racial policy preferences, followed by slower party sorting in subsequent years.Footnote 75 Kaufmann and Petrocik identify the 1964 and 1980 presidential campaigns as instances in which the Republican Party’s positions on social welfare policy moved substantially to the right, raising the salience of those positions and thus causing the gap’s growth. If specific events or years led to a sudden growth in the gender gap, it would contradict Hypothesis 1.Footnote 76
However, Appendix Section 7.3 illustrates that both the magnitude of, and trend in, the partisan gender gap appear to be very similar before and after these presidential campaigns. In that section, we also apply a formal statistical test and find no evidence that either the level or the slope of the partisan gender gap changed before or after the 1964 and 1980 presidential campaigns. The evolution of the partisan gender gap appears to be similar before and after eleven of thirteen presidential campaigns between 1960 and 2008, with the exceptions of 1976 and 1996. Thus, consistent with Hypothesis 1, our large Gallup dataset reveals that the sorting leading to the partisan gender gap was a slow process. In Carmines and Stimson’s typology, we find that the sorting process follows more of a ‘secular realignment’ than a ‘dynamic growth’ pattern.Footnote 77
The Gender Gap Is Associated with Knowledge of Elite Party Polarization
Our theory predicts that the partisan gender gap should be larger among those who are more educated, because such individuals are more likely to be aware of increased polarization. This prediction is supported by the data presented in Figure 3, which compares assessments of polarization in the ANES over time among college graduates and non-college graduates. The dependent variable in this graph is constructed using assessments of the conservatism of the Democratic and Republican parties’ issue positions on all available issues, including domestic welfare spending, law and order, racial policy and gender-related issues from 1970, when these questions were first asked in the ANES, through 2012. A respondent’s assessment of a party’s issue position is recoded so that 1 equals the maximally conservative position and 0 equals the maximally liberal position. We calculate a respondent’s assessment of polarization on a given issue by taking the difference between their assessment of the two parties’ positions on the issue. We aggregate all of the issue positions asked in a given survey to construct a respondent’s overall assessment of polarization.Footnote 78 The white and black circles represent the average overall assessment of polarization by college graduates and non-college graduates, respectively, in a given year, and the gray lines show the linear trends over time.
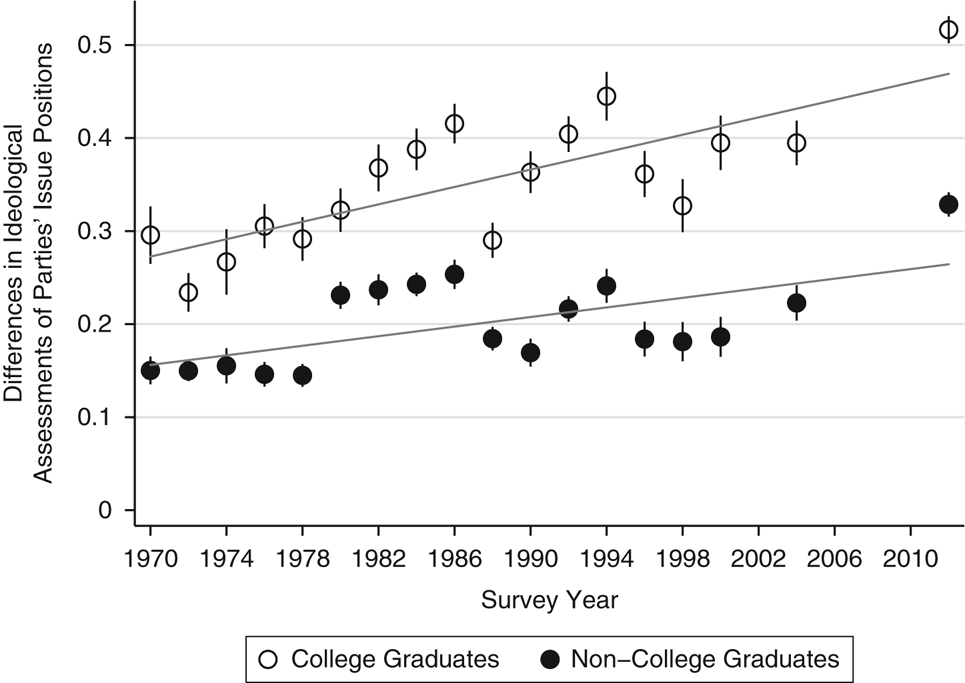
Figure 3. Assessments of polarization in the parties’ issue positions (ANES 1970–2000, 2004, 2012) Note: the dependent variable is the mean difference in respondents’ assessments of the average conservatism of Republican and Democratic Party positions on all available issues. A value of 0 corresponds to an assessment that the issue positions of both parties were equally conservative, while a value of 1 corresponds to an assessment that the Republican Party’s positions were maximally conservative and the Democratic Party’s positions were maximally liberal. Black vertical lines indicate the 95 per cent confidence interval on the point estimate in a given year. Gray lines indicate linear trends on point estimates over time.
Two patterns emerge in Figure 3. In every year, college graduates assess the parties to be further apart ideologically than those with less education do. Moreover, the gap between the college and non-college educated’s assessments of polarization increases over time.
This leads to Hypothesis 2, which has two parts. The first, Hypothesis 2a, predicts that these differences in perceptions of polarization will lead to differential sorting, which will cause the more educated to exhibit a larger partisan gender gap. The pooled Gallup dataset is useful for testing Hypothesis 2a because its large size allows us to more precisely examine differences in the gender gap between those with more and less education.
The top row of Figure 4 compares gender differences in the partisanship of college graduates (left) to non-college graduates (right). We restrict our analysis to in-person surveys in this subsection to ensure that the results are not driven by changes in survey mode. The slow and steady growth in the aggregate partisan gender gap displayed in Figure 1 masks large differences across education levels. Among college graduates, in the 1950s, male and female partisanship was similar. Yet men were more resistant than women to the pro-Democratic macropartisanship trends of the 1960s and 1970s, and women were almost entirely unmoved by the pro-Republican macropartisanship trend in the 1980s. However, for those without a college degree, there is no sign of a partisan gender gap before 1980. During the 1980s, both sexes were influenced by the overall pro-Republican macropartisanship trend. But men embraced it more, creating a significant gender gap, albeit one that was still smaller than among college graduates.

Figure 4. Partisanship by gender and education (Gallup)
The graph in the bottom-left quadrant of Figure 4 compares the size of the partisan gender gap for college graduates and non-college graduates. The right graph on the bottom row of Figure 4 plots the difference in the size of the partisan gender gap between these two groups. The solid black line shows the difference in the size of the estimated gap, with the dotted lines bounding the 95 per cent confidence interval on that estimate. Consistent with Hypothesis 2a, the partisan gender gap was significantly larger among college graduates than among non-college graduates from the early 1970s onward.
Figure 5 shows why the pooled Gallup dataset was necessary to detect differences in the size of the partisan gender gap across education levels over time. The solid black line shows the difference in the size of this gap between college and non-college educated individuals in the pooled Gallup dataset. The same difference in the ANES and GSS is shown with the dark and light dots, respectively, with the dashed lines showing the 95 per cent confidence intervals.Footnote 79 The smaller sample sizes in the ANES and GSS produce confidence intervals that are too large to detect this heterogeneity in the partisan gender gap. One can detect an educational difference by pooling many ANES surveys together, as we do later in this section, but the sample size is too small to show that these differences have been fairly consistent since the early 1970s.Footnote 80

Figure 5. Comparing differences in partisan gender gap by educational attainment in gallup, ANES, GSS surveys
While we contend that the partisan gender gap is larger among college graduates because of their greater awareness of elite polarization, there are many variables, such as race, age, region and economic circumstance, that are associated with being a college graduate. One of these other variables could be driving the relationship between education and the size of the partisan gender gap.Footnote 81 The sample size in the ANES and GSS is a problem here as well. Those surveys have insufficient statistical power to simultaneously control for other interactions with gender to see whether it is really education that produces a difference in the size of the partisan gender gap instead of another correlated attribute. Fortunately, our pooled Gallup dataset has a large enough sample size to include those controls.
To control for other variables associated with education, we estimate Equation 1. Our key parameter of interest is θ, which measures the difference in size of the partisan gender gap among those who have and have not graduated from college. We control for a vector of other characteristics that may influence the partisanship of respondent i on survey s, labeled X s,i, as well as the interaction between these covariates and a female indicator, labeled Female s,i and a college graduate indicator, College s,i. Finally, we include survey fixed effects, labeled α s, to account for features of the political environment that affect the overall partisanship of the population at time t s. If θ is capturing the effect of awareness of polarization, we expect our estimate of θ to be relatively unaffected by the inclusion of these controls.

Table 1 shows how estimates of educational differences in the partisan gender gap vary over time. Each cell entry presents an estimate of θ from a separate regression over the specified time period and including the specified controls. To give each regression more statistical power to accommodate the controls, we group the data into four-year periods.
Table 1. Effects of controls on educational heterogeneity in the partisan gender gap (Gallup)

Note: each cell reports the estimate and standard error of θ when estimating Equation 1 over the specified time period with the specified set of controls. Baseline controls are an African-American indicator, decade of birth indicators, and region of residence indicators. Income controls include indicators for being in the top 20th and 50th percentiles of household income in a survey’s sample. Employment and marital status controls include indicators for being married, being employed full time and being employed part time. Observations are weighted by their sample weight. Robust standard errors are reported in parentheses.
We face a trade-off between adding more controls and not discarding observations in the Gallup data. Because Gallup did not always ask questions that captured all of the demographics that we would like to use, we are forced to drop surveys as we increase the number of controls. The regressions reported in Column 1 include all surveys. In Columns 2 and 3, we use all surveys that contain a set of baseline controls that are available in nearly every Gallup poll: race, decade of birth and region. Columns 4–6 also control for income, which requires dropping surveys in which income was not asked, such as all those prior to the late 1950s. Finally, Columns 7–9 also include marital and employment status, which requires dropping surveys that did not ask about employment, which includes all those prior to the late 1970s.
Consistent with Hypothesis 2a, we generally find that educational differences in the size of the partisan gender gap attenuate only slightly when controls are included. Comparing Columns 2 and 3 shows that educational differences decline only slightly when we control for the respondent’s race, region of residence and decade of birth. Comparing Columns 5 and 6 shows that adding income as an additional control has little effect on the point estimates. Likewise, comparing Columns 8 and 9 shows that our estimates of θ are roughly the same when we control for employment and marital status. The robustness of our estimates of θ to controls is consistent with our claim that college graduation status proxies for awareness of polarization, rather than other attributes like income or labor market experience.Footnote 82
Next, we turn our attention to Hypothesis 2b, which predicts that, because the relationship between education and the gender gap flows through perceptions of polarization, that relationship should shrink when those perceptions are controlled for. To check this, we return to the ANES because it contains questions about perceptions of polarization. Table 2 shows a series of regression models using pooled ANES data from all the years in which it contained questions about the parties’ issue positions. The dependent variable in this analysis is partisan identification, with leaners coded as Independents in order to make these results as comparable as possible with the Gallup results.Footnote 83 To start, Column 1 simply shows, consistent with Hypothesis 2a, that the partisan gender gap is roughly twice as large among college graduates as among non-college graduates in the ANES over these years.
Table 2. Education, assessments of party polarization and partisan identification (ANES, 1970–2000, 2004, 2012)

Note: N=32,152 responses with a non-missing educational attainment and a respondent’s assessment of the parties’ issue positions on at least one policy domain. The dependent variable is partisan identification with Democrats coded as 0, Independents and Leaners coded as 1/2, and Republican coded as 1. Seven-point assessments of a respondent’s assessment of the party’s issue positions are recoded to range from 0 (‘Most Liberal’) to 1 (‘Most Conservative’). ‘Polarization Assessment’ is constructed by subtracting the respondent’s average placement of the Democratic Party’s issue positions from the respondent’s average placement of the Republican Party’s issue position. All regressions also include year fixed effects, and observations are weighted by their sample weight. Robust standard errors are reported in parentheses.
Consistent with our expectations, Column 2 of Table 2 shows that the partisan gender gap is also larger among those who perceive greater polarization. This is illustrated by the significant negative interaction between the female indicator and the respondent’s polarization assessment. Moving from the 25th to the 75th percentile in polarization assessments (0.000 to 0.458) almost doubles the partisan gender gap from −0.024 (std. err.=0.006) to −0.045 (std. err.=0.005).Footnote 84
The results in Column 3 of Table 2 show that the relationship between college education and the partisan gender gap attenuates, but does not entirely go away, once we account for a respondent’s polarization assessment. The coefficient on the interaction between being female and being a college graduate drops about 40 per cent from −0.036 to −0.022 when controls for polarization assessments are also included in the regression. The coefficient on the interaction between being female and polarization assessments also declines slightly from −0.093 to −0.078 when educational attainment is included in the regression, although the interaction between female and polarization assessments is still significant. Combined, these results are mostly, but not entirely, consistent with Hypothesis 2b. The partisan gender gap significantly increases as assessments of polarization increase and these polarization assessments are able to explain a significant portion, although not all, of the relationship between education and the partisan gender gap.
Preferences and Partisanship Come into Alignment When the Gender Gap Grows
Hypothesis 3 predicts that, as people become more aware of partisan polarization, both men and women should hold issue positions that better match their partisanship. This occurs because some people adopt the issue positions of their existing parties, while other people sort into parties that better match their preferences.Footnote 85 The second of these two processes led the partisan gender gap to emerge. We contend that it emerged earlier, and remained larger, among the college educated because college graduates were aware of increasing party polarization earlier than non-college graduates, and thus more likely to sort into parties that better matched their preferences. If this is correct, we expect to observe an increasing congruence between the issue positions and party affiliations of college graduates, relative to non-college graduates, over the time period that the partisan gender gap first emerges.
We test Hypothesis 3 using ANES data by examining how the association between party identification and issue preferences varies over time for college graduates and non-college graduates. The dependent variable in these analyses is a respondent’s partisan identification, with leaners coded as Independents. The independent variable is an index of the conservatism of a respondent’s issue positions. This index of issue positions is constructed with all available issue positions in the ANES cumulative file for each year, where each issue position is rescaled so that 0 is the most liberal response and 1 is the most conservative response. All of the available issue positions are averaged, and then standardized, so that a coefficient represents the change in the probability of identifying as a Republican from a one-standard-deviation increase in conservatism. We run separate regression models for college graduates and non-college graduates for every ANES survey between 1960 and 2012.Footnote 86
Consistent with our theory, Figure 6 shows a substantial increase in the association between issue preferences and partisanship among college graduates over the exact same time interval that the partisan gender gap first emerged. The white circles in Figure 6 show the association between issue preferences and college graduates’ partisanship in a given year, while the gray circles show the same association for non-college graduates. In 1960, for example, a one-standard-deviation increase in the conservatism of issue preferences corresponded to a five- and three-percentage-point increase in Republican identification among college and non-college graduates, respectively. The black and gray horizontal lines present the average of this association for college and non-college graduates, respectively, by decade. In the 1960s, for example, the average association for college graduates was 9 percentage points, compared to 5 percentage points for non-college graduates. This association increased for college graduates in the 1970s and 1980s much more so than for non-college graduates. This finding is consistent with Hypothesis 3 and our argument that college graduates were sorting more than non-college graduates over this time period.

Figure 6. Associations between issue positions and partisan identification over time and by educational attainment (ANES, 1960–2012) Note: this figure shows the differences in the estimated regression coefficient when a respondent’s partisan identification is regressed on an index of a respondent’s issue positions in different years. Partisan identification is coded as follows: Democrats=0, Independents and Leaners=1/2, and Republicans=1. The index of issue positions is constructed with all available issue positions in the ANES cumulative file for that given year, where each issue position is rescaled so that 0 is the most liberal response and 1 is the most conservative response. All of the available issue positions are averaged, and then standardized. Thus, a coefficient corresponds to the change in the probability of being Republican from a one-standard-deviation increase in the conservatism of a respondent’s issue positions.
We conclude this section by investigating on which issues people were sorting. We disaggregate the general issue position index that we used in the previous analysis into three distinct indices: social welfare preferences, gender role preferences and all other preferences.Footnote 87 This disaggregation is motivated, in part, by Kaufmann and Petrocik’s claim that the increased salience of social welfare attitudes, particularly among men, was one of the primary reasons why the partisan gender gap emerged, as well as Inglehart and Norris’s hypothesis that beliefs about gender equality became more important in structuring females’ partisan identification over time.Footnote 88 To test whether men and women put different weights on these dimensions, we regress party identification on these three indices plus these indices interacted with a female dummy variable.
Table 3 shows that the increased association between party and issue positions is largely driven by changes in the relationship between social welfare preferences and partisan identification over time. Comparing Columns 1 and 4 reveals that the association between social welfare preferences and party identification more than doubled between the 1970s and 2000s. While the association between other preferences and party identification also increased, it did so at a much slower rate. This finding is broadly consistent with Kaufmann and Petrocik’s conjecture that the increased salience of social welfare preferences in partisan identification made existing gender differences in social welfare preferences more consequential.Footnote 89 Contrary to Kaufmann and Petrocik’s argument, but consistent with ours, there is little difference in how issue preferences relate to men’s and women’s partisan identification. While we need to be cautious in drawing conclusions about causal direction from this type of analysis due to endogeneneity concerns, the similar associations between preferences and party identification among men and women is at least inconsistent with claims that men place greater weight on social welfare preferences.Footnote 90
Table 3. Associations between issue positions and partisan identification over time by issue position type and gender (ANES, 1972–2008)

Note: the dependent variable is partisan identification with Democrats coded as 0, Independents and Leaners coded as 1/2, and Republican coded as 1. All available issue positions in the ANES cumulative file are rescaled so that 0 is the most liberal response and 1 is the most conservative response. The average social welfare preference is the mean of the rescaled responses to VCF0805, VCF0806, VCF0808, VCF0809, VCF0830, VCF0839, VCF0886, VCF0887, VCF0889, VCF0890, VCF0893 and VCF0894. The gender roles preference comes from the rescaled response to VCF0834. The average preference on all other positions is the mean of the rescaled responses to all other issue position questions. All three of these measures are standardized. Thus a coefficient corresponds to the change in the probability that a respondent identifies as a Republican from a one-standard-deviation increase in the conservatism of their issue position on a given domain. All regressions also include year fixed effects and observations are weighted by their sample weight. Robust standard errors are reported in parentheses.
Table 3 also provides some support for the claim that beliefs about gender roles became more consequential for women’s partisanship over time. For males, there is no decade in which we estimate a statistically significant relationship between gender roles and partisanship. But in the 1980s, 1990s and 2000s, females with more conservative views about gender roles are significantly more likely to be Republican. Moreover, in the 1980s and 2000s, but not in the 1990s, the association between gender roles is the same for men and women at conventional levels of significance. This finding provides some support for theories, like the Developmental Theory of Gender Realignment, which posit that the salience of gender identity in partisanship has increased over time. However, it is also important to note that the magnitude of this relationship is relatively small. A one-standard-deviation increase in conservatism about gender roles is associated with about a two-percentage-point increase in identifying as a Republican. Given that we show in the next section that men’s and women’s preferences over gender roles are becoming more alike over this time period, this means that gender role preferences can explain only a small portion of the development of the partisan gender gap.
Ruling Out Alternative Explanations
Generational replacement
The previous section shows that issue preferences and partisan identification became better aligned over time, particularly among the college educated. We claim that having a college education serves as a proxy for greater awareness of elite polarization. But what if college education is serving as a proxy for other things instead? The nature of college (and its student population) changed during the twentieth century. About 25 per cent of people born in the mid-twentieth century graduated from college, compared to only about 5 per cent of people born near the start of it.Footnote 91 Educational opportunities especially grew for women, as many colleges became coeducational and/or made the curriculum they provided to women more equal to that of men. The Development Theory of Gender Realignment argues that the partisan gender gap results from the socialization women received after the transformation of sex roles, much of which may have happened at college.Footnote 92 Over time, women’s equality became a larger part of the curriculum and socialization that students received at many colleges. Is change in the types of people attending college, and in the socialization they received there, the reason why a partisan gender gap emerged first, and is consistently larger, among the college educated?
Cohort analysis is one way to differentiate the predictions of our theory from these alternative explanations.Footnote 93 If awareness of polarization is the reason why the partisan gender gap emerged first among the college educated, we should expect a partisan gender gap to emerge across all cohorts of college graduates. In contrast, if the changing nature of college is driving this effect, the partisan gender gap should emerge primarily within the younger cohorts of college graduates. An advantage of our Gallup dataset is that we have enough data to track the birth cohorts over time to test these rival predictions.
Figure 7 presents the partisan gender gap over time separately for those born in each decade from the 1880s to the 1960s for college graduates (top panel) and those with less education (bottom panel).Footnote 94 If the growth of the gap among the college educated was driven by generational replacement, in the top panel the lines would be flat and each younger generation’s line would be below the previous generation’s. But that is not what we see. Instead, the lines representing all generations slope down together over time. Except for those born in the 1890s, the partisan gender gap grew on a similar gradual trend among college graduates born in each decade. Even though those who attended college throughout the twentieth century were selected in very different ways, and had very different college experiences, the partisan gender gap was similarly sized and evolved in a similar manner among all these cohorts.

Figure 7. Partisan gender gap by birth cohort over time (Gallup)
Among the non-college graduates, there is some evidence of generational replacement. Between 1983–1992, Figure 7 reveals there was a small modern partisan gender gap among people born in the 1940s or after, which was not present among people born earlier. However, even this does not hold up if the time series is extended forward. Appendix Section 7.7 extends this analysis through 2012 using phone survey data, showing that the differences between these cohorts largely disappeared over time. By the 2000s, men without college degrees were roughly four points more Republican than women without college degrees, even in cohorts where no partisan gender gap was present in the 1980s and early 1990s.
The emergence of the partisan gender gap does not appear to be driven primarily by generational replacement. Rather, it emerged earlier, and is consistently larger, among the college educated of all cohorts. We argue that this is because the college educated were more likely to be aware of the growing elite ideological polarization of the parties, understand its significance, and sort into a party that better matched their policy preferences.
Growing gender differences in policy preferences
Another alternative explanation of the emergence of the partisan gender gap is a growing divergence in men’s and women’s policy preferences, not more sorting based on pre-existing and steady levels of gender policy differences. As discussed above, several existing explanations of the US gender gap make growing gender differences in policy preferences a key part of their theories. To examine this possibility, Appendix Section 7.6 presents a plot of the gender gap on all issue position questions contained in the cumulative ANES dataset over time. It reveals, consistent with the previous literature reviewed above, that there are substantial policy preference differences between men and women that pre-date the emergence of the modern partisan gender gap. If anything, the aggregate issue preference gender gap was smaller in the 1970s and 1980s, when the partisan gender gap first emerged, than in the 1960s, 1990s or 2000s. While one should interpret these results cautiously because the same issue position questions were not asked over time, the evidence seems most consistent with our story – that partisan sorting based on pre-existing gender policy differences that persisted throughout this period led to the gradual emergence of the partisan gender gap. Appendix Section 7.6 also looks at specific issue areas and perceptions of economic performance, as well as issue preferences separately among those with and without college educations. In none of these cases do we find evidence that the growth in the partisan gender gap corresponds to substantial growth in preference (or economic perception) gender differences.
Conclusion
Since the dawn of modern polling in the United States, men have consistently held more conservative views than women on social welfare, foreign policy and racial issues. These preference gaps have remained relatively consistent over time. Starting in the 1960s, Republican and Democratic Party elites increasingly diverged ideologically. As people gradually perceived this divergence, they slowly adjusted their party identification to better match their policy preferences. The pre-existing and persistent gender preference differences caused more men to become Republican and more women to become Democrats when they sorted into parties that matched their ideologies. This article tests three hypotheses implied by this argument and finds the evidence to be largely consistent with all three.
An important qualification to our explanation is that ideological sorting does not explain anywhere close to all the variation in macropartisanship over time. There are powerful overall trends that influence macropartisanship among all genders and education levels.Footnote 95 However, those overall trends do not preclude a secular gender divergence or our explanation of it. Also, while our theory is that ideological party sorting explains the gradual long-term growth of the partisan gender gap from the 1960s to the 1990s, it does not explain all historical variation within it. For instance, our theory does not explain how there came to be a small reverse partisan gender gap in the 1950s. In general, while ideological sorting caused most of the secular growth in the partisan gender gap during the late twentieth century, we do not claim that it is the only thing influencing the size of this gap in these or other decades.
How does our evidence fit with the literature’s other explanations of the partisan gender gap’s emergence? We identified three major groups of explanations of the gender gap’s rise: female economic vulnerability, female labor force participation and the increasing influence of feminism. Here, we return to each of these.
Much of the evidence that we uncover is inconsistent with the economic vulnerability explanation. The partisan gender gap first emerged because college-educated women became more Democratic in the 1970s. These women, on average, have the most human capital and are at less financial risk than other women from macroeconomic downturns, divorce or other hardships. Over this time period, we do not observe growing overall gender differences in social welfare preferences, nor do we observe larger gender differences in social welfare attitudes among college graduates than among non-college graduates. Gender differences in assessments of personal economic well-being also remained relatively constant.
Our analysis does not speak as directly to the question of whether increased female labor market participation and economic independence caused the partisan gender gap to grow. This is partially an issue of data availability. Gallup did not consistently ask about labor force participation or marital status until the late 1970s, after the modern partisan gender gap had emerged. However, controlling for labor force participation and marital status, once these variables are available, has little effect on the estimated difference in the partisan gender gap between the college educated and non-college educated. Thus, as best as we can tell with these data, it does not appear that differential labor market participation or marriage rates between the college educated and the non-college educated are what caused the partisan gender gap to emerge earlier, and remain larger, among the college educated.
Our evidence is only partially consistent with explanations based on the feminist socialization of younger generations of women, such as the Development Theory of Gender Realignment. Among college graduates, who are the leading drivers of the partisan gender gap, the gap does not emerge through generational replacement. Among non-college graduates, a small partisan gender gap emerged among younger, but not older, cohorts in the 1980s and 1990s, which could be consistent with Inglehart and Norris’s argument that changes in sex roles shape the political preferences of women socialized later. But the magnitude of this partisan gender gap is smaller than the gap that was present in just about all cohorts of college graduates over the same time periods.Footnote 96 And by the 2000s, the generational differences largely disappeared among non-college graduates. These findings call into question the importance of changes in socialization over time as a cause of the partisan gender gap’s emergence, at least in the United States.
There is also only limited evidence that liberal views on gender roles or post-materialist social issues caused the partisan gender gap. Among college graduates, men’s issue preferences on gender roles have been more conservative than women’s since these issue positions were first surveyed on the ANES in the 1970s. But the association between gender role preferences and party identification is small. And a gender gap in opinions about gender roles does not appear in the broader population until the 2000s, well after the modern partisan gender gap emerged.Footnote 97
Moving beyond these three existing groups of explanations, the contention by some activists in the early 1980s that the right turn in the policy positions of the national Republican Party created the partisan gender gap has substantial truth to it. However, a simple version of this story risks neglecting the fact that this right turn was a continuation of the gradual ideological polarization of the two parties that began in the 1960s and 1970s. As this polarization continued and grew in size, more people noticed it and the partisan gender gap became larger and somewhat more widespread. Also, it is important to remember that it was elite polarization and mass-level sorting based largely on issues less directly connected to gender that were the main drivers of this phenomenon, as those are the issues with large gender preference differences.
Our analysis helps to bridge the divide between the literature on the partisan gender gap and the most prominent general theories of public opinion and party identification. One of the most prominent scholarly claims about American public opinion is that people with different levels of political awareness comprehend politics and respond to new political information differently.Footnote 98 Another major claim is that, because party identification is a social identity, it changes gradually, even in the face of substantial new information.Footnote 99 The fact that party identification gradually responded to party polarization, and did so differently depending on education, is consistent with these two seminal arguments. New theories of mass political behavior are not required to explain the development of the modern partisan gender gap. Rather, its formation is an understandable consequence of men’s and women’s divergent policy preferences, the polarization of the party system, and differences in how those with different levels of political awareness learned about and responded to this changing political landscape.
Our results also illustrate how mass-level ideological sorting can have unintended consequences. Whenever there are pre-existing policy preference differences across demographic groups, ideological sorting can enlarge demographic differences between the parties. Relatedly, when national political parties demographically diverge, it could be caused by any major political issue, not necessarily by explicitly group-based political appeals.
Finally, our study, and the survey data we have assembled, open the door to more research on this topic. For instance, our examination of the interaction between gender, party identification and education with other demographic variables has so far been limited. In Table 1, we show that the relationship between education and the partisan gender gap persists even when controlling for a series of demographics. And as noted above, Appendix Section 7.8 shows how the gender gap grows over the years within a series of demographic categories in addition to education, such as age, race, religion marital status, union membership, household income, employment status and place of residence. While these tables corroborate Hypothesis 2a – that the biggest and most consistent demographic difference is between the more and less educated – they also suggest avenues for future work. Future research should further examine variation in the relationship between party identification, gender and education over time within certain other demographic categories, like African-Americans, Southerners, the unmarried, etc. While our work has examined the interplay of a series of variables – party identification, gender, education, issue preferences, perceptions of party polarization, time, age – we look forward to future work that more closely examines how the relationships we find depend on other attributes.
Supplementary material
Data replication sets are available in Harvard Dataverse at https://doi.org/10.7910/DVN/TIYCHO and online appendices at: https://doi.org/10.1017/S0007123418000285.
Acknowledgments
The authors are grateful to William Chen, Amy Cohen, Emily Farnell, Ryan Kelly, Natalie Peelish, Matthew Rogers, and Max Zeger for research assistance. In addition, the authors thank John Bullock, Julia Gray, Danny Hayes, Dan Hopkins, David Karol, Gabriel Lenz, Matt Levendusky, Hans Noel, Steve Rogers, Michele Swers, Christina Wolbrecht, and seminar participants at Boston University, Columbia University, Harvard University, Princeton University, University of California-Berkeley, University of Pittsburgh, University of Rochester, University of Wisconsin-Madison, Vanderbilt University and Yale University for helpful comments and discussions.