

There is growing empirical evidence that the United States is an ‘unequal democracy’ in which affluent citizens are more likely to have their preferences reflected in government policy decisions compared to disadvantaged citizens.Footnote 1 This representational inequality has arisen for a variety of possible reasons: compared to citizens with low incomes, wealthier citizens are more likely to vote in elections,Footnote 2 contribute to political campaigns,Footnote 3 have their opinions represented by organized interests and professional lobbyists,Footnote 4 and serve as elected officials in government.Footnote 5 In response, scholars and concerned citizens have begun to search for possible remedies for political inequality.
For most of the twentieth century, labor unions’ attempts to organize their workers for political action were viewed as an important counterweight to the political power amassed by business interests and the affluent.Footnote 6 It is no surprise, then, that among the growing number of studies that document the recent rise in both political and economic inequality in the United States, nearly all point to the steady decline of labor union membership and influence as a major cause.Footnote 7 However, this conclusion is premised on the assumption that stronger labor unions actually help promote greater political equality. Despite a deluge of conventional wisdom that this assumption is true, to date there has been no empirical investigation of the precise relationship between labor union strength and the equality of political representation.
To advance our understanding of the impact of organized labor in American politics, this article uses the variation in labor union membership and campaign contributions across US states to examine the relationship between labor union strength and the equality of political representation between rich and poor citizens. Using public opinion measures from the National Annenberg Election Surveys (NAES) and data on state policy outcomes, I uncover evidence that states with higher levels of union membership weigh citizens’ opinions more equally in the policy-making process. In contrast, there is no relationship between the volume of labor union contributions to political campaigns in a state and the equality of political representation. These findings suggest that labor unions promote greater political equality primarily by mobilizing their working-class members to political action, as opposed to influencing elected officials directly through contributions to political campaigns.
BACKGROUND AND THEORETICAL EXPECTATIONS
Political scientists and political observers more generally have long warned that political representation in the United States is tainted by an upper-class bias, such that wealthier citizens have more influence over government policy decisions than the poor.Footnote 8 But, as the American Political Science Association Taskforce on Inequality and American Democracy lamented, ‘Unfortunately, political scientists have done surprisingly little to investigate the extent of actual inequalities of government responsiveness to public opinion – that is, whether distinct segments of the country exert more influence than others.’Footnote 9 A series of recent studies has sought to correct this problem and more fully understand unequal political influence in the United States. Most notably, Bartels demonstrates that the opinions of affluent constituents strongly predict the voting behavior of their senators, while the opinions of those with low incomes display little or no relationship.Footnote 10 In addition, Gilens collects data from thousands of individual public opinion poll questions and finds that subsequent federal government policy decisions disproportionately reflect the views of the affluent, and that this is especially true when the preferences of the rich and poor diverge.Footnote 11 Investigations of unequal political representation at the state level have tended to come to similar conclusions.Footnote 12 In short, there is a growing body of empirical evidence that shows the stated opinions of citizens with low incomes tend to receive little attention in government policy decisions compared to their more affluent counterparts.
Labor unions, as an organizing instrument for working-class citizens, have the potential to act as a counterweight to the political power amassed by business interests and the affluent.Footnote 13 This potential arises, I argue, through two primary theoretical mechanisms. First, labor unions can help offset the pronounced socio-economic bias in voter turnout and political activity more generallyFootnote 14 if they are successful in mobilizing workers with lower socio-economic status to political action.Footnote 15 In one illustrative example of labor union mobilization efforts, the AFL-CIO (through its Committee on Political Education) routinely devotes considerable resources to voter information, registration and turnout drives.Footnote 16 Moreover, in many states, mandatory collective bargaining laws provide public sector unions with subsidized benefits that can help lower the costs of mobilizing their union members to political action.Footnote 17 It is not surprising, then, that previous research emphatically suggests that unions are successful at mobilizing their members to higher levels of political activity and engagement.Footnote 18 When combined with evidence that voters’ opinions tend to be better represented by the policy decisions of elected officials than non-voters’ opinions,Footnote 19 and proof that the views of low-income citizens tend to be better reflected in government policies when they turn out to vote at higher rates,Footnote 20 jurisdictions with higher levels of union membership (and, by extension, higher levels of union political mobilization) are likely to display more egalitarian patterns of political representation.
Secondly, labor union organizations routinely insert themselves into political campaigns by contributing money directly to candidates running for officeFootnote 21 who support union-friendly policies (such as a higher minimum wage, more generous government health care and retirement support, and a more progressive taxation system) that low-income and working-class citizens, in general, also tend to support.Footnote 22 Although political scientists have uncovered little evidence that campaign contributions directly influence legislators’ roll-call votes, there is ample evidence suggesting that contributions can exert sway behind the scenes by influencing who legislators agree to meet with, what issues they focus on and how they allocate their scarce time while in office.Footnote 23 As a result of these efforts, there is likely to be a more equal weighting of citizens’ political opinions in government policy decisions in jurisdictions where union organizations are more actively involved in contributing to candidates for elected office who support labor-endorsed policy positions.Footnote 24
Despite the potentially important role that labor unions can play in promoting more equal consideration of citizens’ political opinions in government policy decisions, to date this question has received scarce empirical attention. Although related studies suggest that states with higher levels of union membership are more likely to implement liberal public policies,Footnote 25 less likely to implement business-friendly policies,Footnote 26 and tend to have lower levels of poverty and income inequality,Footnote 27 our understanding of the specific effect of labor unions on the opinion–policy linkage between citizens and their government remains limited. Therefore, in what follows, I take advantage of the variation in labor union membership and campaign contributions across the American states to empirically evaluate the relationship between labor union strength and the degree to which the political opinions of the wealthy and poor are equally reflected in the policy decisions made by elected officials.
MEASURING THE EQUALITY OF POLITICAL REPRESENTATION IN US STATES
In this study, political representation is measured using a proximity technique that places public opinion and policy on the same linear scale and compares the distance between the two.Footnote 28 Using this method, as the ideological distance between a citizen’s opinion and policy grows (that is, policy is ideologically ‘further’ from a citizen’s preferences), that citizen is not well represented.Footnote 29 In practical terms, this proximity technique allows a researcher to evaluate whether a conservative (liberal) citizen lives in a state that, compared to other states, implements conservative (liberal) policies and is ‘well’ represented, implements liberal (conservative) policies and is ‘poorly’ represented, or gradations in between.
Measuring ideological proximity requires two pieces of data: (1) a measure of citizens’ opinions and (2) a measure of state policy. To measure public opinion, I combine data from the 2000, 2004 and 2008 NAES, three random-digit-dialing rolling cross-sectional surveys conducted in the months leading up to that year’s presidential election. The major advantage of pooling these three NAES surveys is their sheer sample size, which allows a large enough sample without having to aggregate across a long time period or simulate state opinion.Footnote 30 This large sample size is especially important because this article later evaluates the relationship between income and ideological proximity within individual states.Footnote 31
Citizens’ general political ideology is measured using the following item from the NAES: ‘Generally speaking, would you describe your political views as very conservative, conservative, moderate, liberal, or very liberal?’ The measure is coded from −2 (very conservative) to +2 (very liberal). Data on citizens’ self-reported political ideology have been commonly used to measure public opinion in previous studies of political representation,Footnote 32 and there is reason to be confident that self-reported ideology is an accurate measure of citizens’ aggregated policy-specific opinions.Footnote 33
To measure public policy, I require a general measure of the ‘liberalism’Footnote 34 of state policy outputs that comports with the survey item that asks citizens their general political ideology. In their seminal book on state opinion and policy, Erikson, Wright and McIver developed a composite index of state policy liberalism using eight policy areas on which liberals and conservatives typically disagree.Footnote 35 Gray et al. updated this policy liberalism measure for 2000 using the following five policy items: (1) state regulation of firearms as measured by state gun laws; (2) scorecard of state abortion laws in 2000; (3) an index of welfare stringency that accounts for Temporary Assistance to Needy Families rules of eligibility and work requirements for 1997–99; (4) a dummy measure of state right-to-work laws in 2001 and (5) a measure of tax progressivity calculated as a ratio of the average tax burden of the highest 5 per cent of a state’s earners to that of the lowest 40 per cent of a state’s earners.Footnote 36 These five components are then standardized and summed in an additive index such that more liberal state policies are coded higher. I use this index as my first measure of the general ideological tone of state policy.
Secondly, a recent article by Sorens, Muedini and Ruger provides a rich source of data on state policies in twenty different areas ranging from public assistance spending to gun control to health insurance regulations.Footnote 37 In addition to specific statutes and spending data, the authors provide a summary index of policy liberalism for each state that they derive by factor analyzing their entire range of policies. I use this composite score as a second measure of general policy liberalism.Footnote 38 Together, the two policy liberalism measures represent the unidimensional liberal/conservative ideology of state policy decisions that correspond well to the measure of citizens’ general political ideologies described above.
Measuring ideological proximity requires a method of placing citizens’ opinions and state policy on a common scale for comparison. Drawing on previous studies that have also used a proximity technique to measure political representation,Footnote 39 this article approaches this task in three different ways. If all three measurement techniques point to the same conclusion, then we can be more confident in the robustness of the results.Footnote 40
First, all ideological opinions are standardized to a mean of 0 and a standard deviation of one, and the two recent measures of general state policy liberalism described aboveFootnote 41 are then standardized as well. After standardizing both opinion and policy, they are now on a common (standardized) metric, similar to the strategy originally used by Wright and more recently by Ellis.Footnote 42 Proximity is measured as the absolute value of the difference between a respondent’s ideology score and the policy liberalism score for his/her state using both measures of policy. This creates the first measure of ideological distance for each respondent in the NAES sample, which is labeled the Standardized measure.
Secondly, the two measures of state policy are rescaled to the same scale (−2 to +2) as citizens’ self-reported ideology. This technique is similar to that used in early studies of congressional representation,Footnote 43 and is still advocated by representation scholars today.Footnote 44 The absolute value of the distance between a respondent’s ideology score and the policy liberalism score for his/her state is again computed and labeled the Same Scale measure.
Thirdly, policy is rescaled to a tighter range (−1 to +1) than citizens’ ideologies, as suggested and implemented by Powell in her studies of congressional representation.Footnote 45 This procedure is used because we can expect citizens’ ideological opinions to have a wider range and take on more extreme values compared to actual state policy outputs. Again, the absolute value of the distance between a respondent’s ideology score and the state policy liberalism score for his/her state is computed and labeled the Restricted Scale measure.
Together, there are three different measurement techniques and two different measurements of state policy liberalism, for a total of six different measures of ideological proximity between citizens’ opinions and state policy. I am then interested in whether there are systematic differences in proximity between opinion and policy across citizens; specifically, whether there is a link between a citizen’s income and the ideological distance between opinion and policy. Because I am interested in unequal political representation within each state and state populations can vary widely in terms of their income distribution, it would be unwise to simply compare the incomes of citizens in one state to those in another state. Simply put, we might expect someone making $100,000 per year living in West Virginia to exert comparatively greater political influence than someone making $100,000 per year living in Connecticut. To account for differences in income distribution across states, I generate a measure of state relative income that compares a respondent’s income with the average income for a resident in his or her state.Footnote 46
With this measure of state relative income, I then assess whether there is a systematic relationship between citizens’ incomes and the ideological distance between their opinion and state policy by regressing the measure of ideological distance on income for every respondent in the sample using the six different measures of ideological proximity described above.Footnote 47 The results of these six regression estimations reveal strong evidence of unequal political representation. Specifically, all six coefficients for income are negative and bounded below 0, which indicates that as a respondent’s income increases, the distance between their ideology and state policy decreases and they are better represented. Put another away, the lower a respondent’s income, the greater the distance between opinion and policy and the worse that respondent’s general political ideology is represented in the general liberalism of his or her state’s public policies.
Substantively, the larger opinion–policy distance for a respondent at the 10th percentile for income compared to a respondent at the 90th percentile is about the same as the difference between a respondent at the 10th percentile for (state relative) level of education compared to the 90th percentileFootnote 48 and larger than the difference between an African-American respondent and a white respondent.Footnote 49 These findings comport with the small (but growing) set of studies that has found that citizens with low incomes are systematically under-represented in the policy-making process in US states.Footnote 50
The primary rationale for examining unequal political representation at the state level is to understand and explain variation in political equality across states. To assess in which states political influence is strongly tied to income compared to those that weight opinions more equally, I run a separate regression for each state and compare the coefficient for (state relative) income. Similar to the nationwide regression discussed above, a more steeply negative slope coefficient indicates a stronger relationship between income and ideological distance and, accordingly, less political equality. For example, consider the two hypothetical states presented in Figure 1. For each state, the line represents the slope of the relationship between income and ideological distance. As the figure illustrates, the relationship between income and distance is rather weak in State A, indicating that citizens’ opinions are weighted roughly equally regardless of their income. In contrast, the slope of the relationship between income and ideological distance is quite steeply negative for State B, indicating that there is a strong degree of political inequality in state policy making.
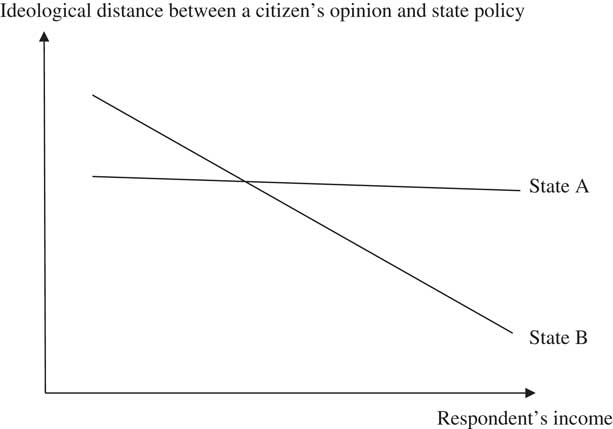
Fig. 1 Computing the relationship for income and ideological distance, by state Note: State A has more equal political representation than State B because the relationship (regression slope coefficient) between income and opinion–policy distance is weaker in State A compared to State B.
A separate regression is run for each state using each of the six different measures of ideological proximity described above (three measurement techniques × two measures of state policy liberalism).Footnote 51 When the six regression coefficients (for state relative income) are compared across the states, they have a Cronbach’s alpha of 0.96, indicating that all six measures appear to be measuring the same concept. To create a single summary score of political equality that is directly comparable across states, I conduct a principal components analysis on the six slope coefficients and generate a single factor score for each state.Footnote 52 Because a more steeply negative slope coefficient indicates more unequal representation (that is, a stronger relationship between income and ideological distance), a more positive factor score indicates greater political equality (that is, a more equal weighting of citizens’ opinions). I label this new measure the Equality of Political Representation Index.
The factor scores generated using this procedure are reported in Table 1, where the states are ranked from the most to least equal in terms of political representation. It is important to note that the index is not simply an alternative measure of the general liberalism of state policy (with the expectation that lower-income citizens support more liberal policies). The Equality of Political Representation Index correlates with the Gray et al. policy liberalism measure at 0.46 and with the Sorens, Muedini and Ruger policy liberalism measure at only 0.36.Footnote 53 Most importantly, however, is the fact that there is significant variation in political equality across states. In the following section, I use this variation to evaluate whether states with stronger labor unions tend to display more egalitarian patterns of political representation.Footnote 54
Table 1 Ranking the States by the Equality of Political Representation

Note: cell entries are factor scores from combining six coefficients for state specific regressions. Larger positive values indicate greater political equality (a weaker relationship between income and ideological proximity).
STATE LABOR UNION STRENGTH AND THE EQUALITY OF POLITICAL REPRESENTATION
Above, I theorized that labor unions can promote greater political equality through two primary theoretical mechanisms: (1) mobilizing union members to political action and (2) contributing to candidates for elected office. To evaluate the individual effect of each mechanism, I measure the strength of labor unions in a state in two different ways. First, to measure the potency of labor mobilization in a state, I take the average percentage of nonagricultural wage and salary employees (including employees in the public sector) who are union members for 2000–06 using data from the Current Population Survey.Footnote 55 Secondly, to measure labor union involvement in political campaigns in a state, I take the amount of campaign contributions to candidates for state office (governor, state senate and state house) for 2000–06 that come from labor unionsFootnote 56 and divide by the total contributions from all sectors including agriculture, communications and electronics, construction, defense, energy and natural resources, finance, insurance, real estate, general business, health care, lawyers and lobbyists, and transportation.Footnote 57 This calculation produces the percentage of all campaign contributions (that are catalogued by industry) that come from labor unions. Across states, these two measures of labor union strength correlate at 0.65.
In the analysis presented below, the Equality of Political Representation Index is regressed on a state’s labor union membership and labor union campaign contributions to evaluate whether states with stronger labor unions have more egalitarian patterns of political representation.Footnote 58 Along with the two measures of labor union strength, I also include in the model a measure of the partisan composition of state government, the composition of a state’s interest group community, and a state’s median income and level of income inequality. The partisan composition of state government is measured as the average percentage of Democrats in the state legislature for 2000–06, and is included to account for the potential alternative explanation that states with a higher percentage of Democratic legislators are both more likely to implement union-friendly policies (that help strengthen labor unions) and more likely to equally represent the political opinions of citizens with low incomes in state policy decisions. The composition of a state’s interest group environment is measured as the percentage of organized groups in 1997 that represented for-profit interests (measure devised by Gray and Lowery and updated by Gray et al.Footnote 59 ) and is included because previous research indicates that a greater proportion of for-profit interest groups attenuates the link between public opinion and state government policy decisions.Footnote 60 Finally, a state’s median income and level of income inequality (using the Gini coefficient) for 2000 from the US Census Bureau are included because previous research on unequal political influence at the state level suggests that political representation is the least egalitarian in poorer states and in states with higher levels of income inequality.Footnote 61
The analysis proceeds by including each of the two union strength variables in a regression model separately before including both in the same model and allowing them to compete for statistical influence. Column 1 of Table 2 reports the estimates with labor union membership as the measure of union strength and reveals that the coefficient for membership is positive and statistically different from 0. This finding indicates that states with a greater percentage of workers who are labor union members tend to weigh citizens’ opinions more equally in the policy-making process. By contrast, Column 2 reports the estimates with labor union campaign contributions as the measure of union strength and reveals that the coefficient for contributions is not statistically different from 0, indicating that there is no relationship between the proportion of campaign contributions that comes from labor unions in a state and the equality of political representation. Finally, Column 3 reports estimates with both measures of union strength included in the model and, again, the coefficient for labor union membership is statistically different from 0 while the coefficient for labor union campaign contributions is not. In addition, the other covariates in the model reveal that (as previous studies have found) states with higher levels of income inequality tend to be less politically equal. Somewhat surprisingly, the coefficient for the percentage of Democrats in the state legislature is not statistically different from 0, indicating that there is little evidence that the partisan composition of state government is associated with the equality of a state’s political representation.Footnote 62
Table 2 Labor Union Strength and the Equality of Political Representation
Note: dependent variable is the Equality of Political Representation Index (higher value indicates a more equal weighting of citizens’ political opinions). Cell entries are ordinary least squares regression coefficients with standard errors reported beneath in brackets. Column 4 reports the standardized coefficients for the model in Column 3 (the predicted change in terms of standard deviations of the Equality of Political Representation Index when the independent variable in question is increased one standard deviation). *p<0.10, **p<0.05, ***p<0.01 (two-tailed test)
From a substantive standpoint, the magnitude of the relationship between labor union membership and the equality of political representation is quite large. Column 4 of Table 2 reports the standardized coefficients (the predicted change in terms of standard deviations of the Equality of Political Representation Index when the independent variable in question is increased one standard deviation) from the regression estimated in Column 3. As illustrated in the table, labor union membership has the largest substantive relationship with the equality of political representation of any predictor in the model. Specifically, a one-standard-deviation increase in the percentage of a state’s workers who are union members corresponds to more than half (0.53) a standard deviation increase in the Equality of Political Representation Index. In summary, the data indicate that labor union membership is an important predictor of representational equality in US states.
One potential concern about the findings reported in Table 2 is that the ability of labor unions to mobilize their members to political action or influence policy making through contributions to political campaigns are not optimally operationalized. To investigate this concern, I estimate a set of additional regression models with different measures of both union membership/mobilization and union campaign contribution activity. To measure how successful labor unions are at mobilizing their members to political action, I use validated voter turnout data from the 2008 Cooperative Congressional Election Study to calculate the share of the electorate in each state that is from a union member household. To measure how active labor unions are in contributing to political candidates compared to other organized interests, I calculate the ratio of labor union contributions to business contributions in each state for 2000–06.Footnote 63 Using these two alternative measures of labor union strength and the same empirical strategy and model specification as above, the results of the additional estimations are reported in Table 3. The coefficients for these estimations are consistent with those reported in Table 2. Namely, labor union mobilization is a significant predictor of greater representational equality in a state, while labor union campaign contributions are not. Again, the analysis points to the conclusion that labor unions’ ability to promote more egalitarian patterns of political representation lies in their effectiveness in organizing and then mobilizing union members to political action as opposed to contributing directly to state political campaigns.Footnote 64
Table 3 Robustness Check Using Alternative Measures of Labor Union Strength
Note: dependent variable is the Equality of Political Representation Index (higher value indicates a more equal weighting of citizens’ political opinions). Cell entries are ordinary least squares regression coefficients with standard errors reported beneath in brackets. Column 4 reports the standardized coefficients for the model in Column 3 (the predicted change in terms of standard deviations of the Equality of Political Representation Index when the independent variable in question is increased one standard deviation). *p<0.10, **p<0.05, ***p<0.01 (two-tailed test)
CONCLUSION
Political equality is a cornerstone of democracy. As Sidney Verba declares, ‘One of the bedrock principles in a democracy is the equal consideration of the preferences and interests of all citizens.’Footnote 65 However, recent studies at both the nationalFootnote 66 and state levelsFootnote 67 report that, across a wide array of issue areas, affluent citizens are more likely to have their preferences reflected in government policy decisions compared to disadvantaged citizens. In response to these revelations, scholars and concerned citizens alike have begun to turn their attention to searching for possible remedies for political inequality. For example, Flavin finds that patterns of political representation are more egalitarian in states with stricter lobbying regulations and suggests tighter restrictions on the registration and conduct of professional lobbyists as one viable avenue of promoting more equal consideration of citizens’ political opinions.Footnote 68 Carnes also shows that citizens from working-class and low-income backgrounds are strikingly under-represented in state legislatures across the nation and, in response, recommends specific programs to recruit more blue-collar workers to run for elected office and advocate the opinions of disadvantaged citizens within government.Footnote 69
This article uses variation in labor union membership and campaign contributions across US states to examine the relationship between labor union strength and the equality of political representation between rich and poor citizens, and uncovers evidence that states with higher levels of union membership (and where union households make up a greater share of the electorate) weigh citizens’ opinions more equally in the policy-making process. In contrast, there is no statistical relationship between the volume of labor union contributions to political campaigns in a state and the equality of political representation. Taken together, these findings suggest that labor unions promote greater political equality primarily by mobilizing their working-class members to political action as opposed to influencing elected officials directly through contributions to political campaigns.
As illustrated by recent high-profile battles over ‘right-to-work’ legislation in several states that have traditionally supported labor-friendly policies such as Indiana, Michigan and Wisconsin, the ability to organize and join a labor union has increasingly become a politically contentious issue. Even in states without right-to-work laws, local governments (such as cities and counties in Illinois and Kentucky) are attempting to bypass state labor policies by creating right-to-work enclaves within their jurisdictions. The ultimate aim (and effect) of these efforts is to lower union membership rates and substantially reduce the influence of labor unions in both the workplace and the political arena. Given the empirical findings reported in this article, this increasingly adversarial climate for organized labor will likely only exacerbate existing inequalities in political influence between the rich and the poor. Therefore, citizens who are concerned about rising levels of economic and political inequality should focus greater attention on the important role that organized labor can still play in shaping the distribution of power in American politics.
More broadly, this article suggests a fruitful avenue for future study of the relationship between organized labor and the equality of political representation. Recent research examines the correspondence between public opinion and party positions/government policies in twenty-one parliamentary democracies and reports evidence that, similar to the United States, affluent citizens are more likely than disadvantaged citizens to have their opinions represented.Footnote 70 Power Resources Theory posits that one of the most effective ways for lower- and working-class citizens to exert greater political influence and secure public policies favorable to them is by organizing and affiliating with a labor union.Footnote 71 However, to date, there has been no empirical evaluation of whether countries with stronger and more politically active labor unions display more egalitarian opinion–policy linkages. Therefore future research should take advantage of the sizable cross-national variation in union strength and activity to explicitly examine whether the important role that labor unions play in promoting political equality in the United States applies internationally as well.


