Scholars have spent decades developing and testing models that explain why legislators vote the way they do. Great advances have been made by demonstrating the variety of factors that determine legislators’ votes, including cues,Footnote 1 ideology and party,Footnote 2 constituencyFootnote 3 and political ambition,Footnote 4 among others. This literature has more or less stalled, however, since party and ideology explain upwards of 90–95 per cent of the variance in individual-level voting in a legislature like the US Congress, offering parsimonious explanations; predictive accuracy above this threshold is extremely challenging. However, pursuit of further explanations of voting behaviour may be worthwhile for at least two reasons. First, theories that explain the most difficult-to-explain variation in voting, as well as the ‘easy’ votes, offer true advancement in our understanding of the most consequential legislative behaviour. Second, understanding the behaviour of elected officials when they are not strictly following their party line may provide the best window into the quality of representation provided by democratic institutions. A parsimonious theory that explains deviant cases without contradicting conventional wisdom provides a great advancement of scientific knowledge.
We argue that legislators’ voting behaviour is highly interdependent – that is, legislators decide how they will vote on policies based on their relationships with their colleagues and their colleagues’ ideology, which creates expectations about how legislators are likely to vote. Understanding voting as interdependent has at least two important implications that differentiate this work from prior studies in this area. First, if we assume that legislative voting is interdependent, then it is not appropriate to examine it at the individual-level unit of analysis. Rather, we must examine relationships between legislators as the analytical unit. The ‘smallest’ unit of this type is the dyad. Analysing all dyadic combinations of legislators and their relationships with one another allows us to evaluate the extent to which legislators are indeed interdependent in their voting behaviour. Secondly, in contrast to the existing literature in this area, we are explicit about our assumption that legislators are not independent of one another. Rather, we develop a theoretical and empirical model in which legislators are interdependent.
To that end, we posit that legislators’ social connections are positively related to their voting patterns, and that voting patterns are conditional on legislators’ expectations about their colleagues’ voting intentions. Put more plainly, if a legislator anticipates that he is likely to agree with a colleague, their actual rate of voting agreement increases as their level of social connectedness increases. But if a legislator anticipates that she is unlikely to agree with a colleague, their rate of voting agreement decreases as their level of social connectedness increases. This is because, for legislators who tend to agree, social connectivity offers an increased level of confidence in the signals they send to one another about how they intend to vote. In this way, it may be useful to keep your friends close. But for political adversaries, or legislators who do not expect to agree with each other, social connectedness provides a counterintuitive inverse relationship with agreement in which more highly connected pairs agree less often than less connected pairs. This is the case because legislators have incentives to establish social connections with at least some adversaries with whom they expect not to agree. Legislators benefit from establishing social ties with those with whom they expect to disagree because these discussant partners provide valuable cues about policies that help individual legislators update their own beliefs about their policy preferences. The stronger your expectations are about your level of agreement (disagreement) with a legislative colleague, the clearer the signal is about a policy and its implications. Moreover, legislators have meaningful shortcuts available to them that let them easily and accurately identify the legislators with whom they anticipate agreement (disagreement): ideology and party. To use an example from American politics, not only will liberals expect to support their Democratic friends, they will expect to stand in opposition to staunch conservative Republicans. Liberals may also expect to oppose moderate Republicans, but that expectation is weaker. In this way, it may be useful to keep your enemies closer, so to speak.
This logic builds on the proposition that legislators solicit information about the policy positions of their social contacts in an effort to check the appropriateness of their own policy predispositions. They then compare the policy positions of their counterparts to the positions they expect them to take before making a vote choice. If the information they expect to receive matches the actual information provided, their predispositions are confirmed; in contrast, if the source provides information that deviates from their expectations, it is likely to trigger a re-evaluation of their own initial policy positions.Footnote 5 A precondition for this dynamic is that the policy positions of legislators’ social contacts are predictable. If their allies sometimes disagree and their adversaries sometimes agree with them, their positions are less predictable than if they always agree or always disagree, respectively. Both cases allow legislators who are uncertain about their policy positions to make more informed vote choices.
To test these propositions, we develop an innovative research design that first identifies and maps the social network of legislators in the Committee on Environment, Public Health and Food Safety of the European Parliament (EP), using contacts between the personal staffs of members of the EP (MEPs) as a measure of social connections between legislative offices.Footnote 6 We then employ a multilevel model to estimate the relationship between voting tendencies and social connectedness.
The contributions of this project are threefold. First, we make a general argument about legislative voting behaviour and its tendency to be interdependent. We demonstrate that it is important to examine the extent to which legislators vote the same way (that is, voting agreement, or co-voting) and to use a dyadic unit of analysis, which is rare in legislative studies. Such an approach is not only the appropriate unit of analysis for the theoretical question at hand, but has the added advantage that it allows us to model a legislature as a social network, thus opening the door to a variety of theoretical and methodological tools that are not often applied in the legislative arena. If legislators are indeed interdependent in their voting behaviour, then using dyadic analysis and studying voting agreement is precisely the appropriate framework to use. Our theoretical approach also allows us to contribute to the existing research on the relationship between disagreement and political behaviour – we show that this relationship depends on actors’ level of connectivity and their ideology.
Secondly, our empirical approach appropriately models the interdependence that inevitably arises from social network data. Standard econometric techniques assume independence between observations, an assumption that is neither desirable nor even applicable in social network analysis. Here, since we are specifically interested in how the legislators’ social networks help inform their legislative activity, we use modelling techniques that capture the interdependence within the network, rather than assume it away. Our analysis not only emphasizes the importance of social networks to the flow of information in legislatures, it also suggests that the connections legislators establish with each other reflect strategic considerations, as they seem to establish social contacts that maximize the utility of the information they trade.
Finally, the type of data we use for our analysis is unusual and difficult to acquire, as political actors are understandably reluctant to reveal their personal connections due to the political sensitivity of this information. We successfully conducted a survey of legislative staffers, however, allowing us to measure connections between legislative offices. Such measures have the advantage of being based upon actual social connections, in contrast to other studies that rely upon proxies, such as co-sponsorship, that do not cleanly capture social interaction (as distinct from strategic legislative signals). This profoundly increases the confidence we can have in our measures and findings.
Social networks and information exchange in legislatures
Despite recent stirrings of interest, social networks among legislators remain an understudied phenomenon. It stands to reason, however, that social connections among individuals and the networks they form have the potential to considerably affect preferences, decision-making behaviour and policy outcomes in the dense institutional environment of legislative politics. Recent research has begun to contribute to our understanding of social networks in legislatures by studying, for example, the utility of cosponsorship networks,Footnote 7 caucus networks,Footnote 8 committee assignments as a networkFootnote 9 and seating assignments as a contributor to networks in legislatures.Footnote 10
It is well established that legislators make choices based on electoral considerations – they seek to maximize the probability of being re-elected and therefore strive to satisfy their constituents.Footnote 11 Moreover, it has been demonstrated that legislators’ vote choices can generally be summarized in a one- or two-dimensional policy space, whereby legislators vote for policies that are nearest to their ideal outcome.Footnote 12 However, significant scholarship has shown the spatial model to be an incomplete, and sometimes unsatisfactory, explanation for legislative voting. For example, legislators are known to engage in strategic (as opposed to sincere) voting, which violates a key assumption of the spatial model.Footnote 13 In addition, there may be methodological reasons to be suspect of the primary empirical realization of the spatial model, NOMINATE scores.Footnote 14
Further, considerable evidence demonstrates that legislators’ vote choices are affected by factors not taken into account by spatial models, yet are still consistent with the model of electoral motivations. Most important for our purposes, while the spatial model assumes legislators to be atomistic actors, much evidence suggests that they seek cues and signals from one another before deciding how to voteFootnote 15 or which bills to cosponsor.Footnote 16 Researchers have also offered evidence of the influence of social connections – formed as roommates in boarding houses,Footnote 17 physical proximity on the chamber floorFootnote 18 or caucus membership.Footnote 19 Given this evidence, we seek to test how legislators’ social interactions – conditional on ideology – affect their voting decisions.
The literature on social networks in legislative politics indicates that legislators use networks for information exchange.Footnote 20 This is, of course, a critical function, as lawmakers require extensive information to engage in legislative activity and formulate policy.Footnote 21 If we assume that information flows through a lawmaking body (at least in part) via social networks, what should we expect these networks to look like, and how should they relate to voting? Building on the literature on decision-making networks in the electorate or among organized interests, one might assume that decision makers tend to exchange information only with those with whom they are predisposed to agree. After all, research on social networks shows that people tend to choose like-minded political conversation partners.Footnote 22 Additionally, lobbyists tend to reach out to legislators who share their policy positions.Footnote 23 On the basis of these studies, we might expect legislative information networks to be homogenous and for political actors to avoid disagreement, for example because they can rationally reduce the costs of obtaining information by developing relationships only with those who are well informed and like-mindedFootnote 24 or because of the disabling consequences of disagreement in discussion groups.Footnote 25
We suspect, however, that the social networks of legislators include both political friends and political enemies. At the most basic level, this is because we do not typically observe homogenous political networks empirically, even among citizens with low levels of interest in politics.Footnote 26 What is more, legislators have strong incentives to seek information from both sources known to have opposing interests and those with similar interests. Unlike other political actors, such as lobbyists or voters, legislators cannot afford to suppress all dissonance-producing information by choosing to interact only with those with whom they are predisposed to agree. In fact, having information that is ‘wholly and completely an extension of individually based political preferences’ would put a legislator at a great strategic disadvantage compared to her colleagues.Footnote 27 In order to succeed in their strategic interactions with a relatively small number of other actors, legislators must maximize the information they have on the content and expected consequences of the policy proposals they seek agreement on, as well as the positions, strategies and goals of their counterparts. If they limited their search for information to individuals with similar interests they would put themselves in a weak strategic position, as heterogeneous political networks have the great benefit of producing a deeper sense of awareness of opposing viewpoints among network members.Footnote 28 In addition, lawmakers are unlikely to experience psychological distress or social withdrawal in the face of political disagreement, as is the case for individual citizens.Footnote 29
In this article we focus on one critical aspect of information exchange via social networks in legislative politics: the utility of exchanging cues with political allies as well as political adversaries.Footnote 30 We maintain that legislators establish social connections with political friends and enemies that allow them to check their policy predispositions against those of other lawmakers. This, in turn, bolsters the confidence they have in their own positions and allows them to make more informed choices when voting. The logic behind this idea is straightforward when the two legislators exchanging information are political allies, as the following example suggests. Let us assume that Legislator A seeks to establish her position regarding policy alternatives X and Y. She is predisposed to favour alternative X, but some uncertainty remains about this policy choice. To minimize this uncertainty, she seeks information from a political ally with whom she agrees most of the time, Legislator B. Because she usually agrees with B, A expects that B will confirm that alternative X is the correct policy choice. If B meets this expectation and favours alternative X, Legislator A has greater confidence in her choice of alternative X. If, however, B unexpectedly supports alternative Y, it may cause A to re-evaluate her prior beliefs about alternatives X and Y, which may in turn affect her vote choice.
A similar logic applies to information exchange between political opponents, which again points to the value of establishing social connections with legislative enemies as well as friends.Footnote 31 Assume that Legislator A seeks information from Legislator C, with whom she tends to disagree. Since she is predisposed toward alternative X and expects C to oppose her position, she anticipates that C will favour alternative Y. If this is indeed the case, A's inclination to choose alternative X will be confirmed. However, if C unexpectedly indicates his support for alternative X, it may prompt A to reconsider her disposition toward policy X. Again, these considerations may ultimately affect her vote choice. Notice that in this simplified example, the primary difference between A's relationship with B and A's relationship with C is A's expectation about agreement with her counterparts. We contend that the relationship between legislators’ connectivity and their tendency to vote the same way is conditioned on their expectations about agreement, which is grounded in partisanship and political ideology.
This logic is based on the assumption that the information legislators receive from their social contacts is sincere, rather than a deliberate effort to misrepresent actual positions for strategic reasons. For legislators who are political opponents this risk seems particularly pronounced, because adversaries have a greater incentive to mislead their counterparts. Nevertheless, we assume that the information exchanged between legislators A and C is sincere for two related reasons: because the exchange of information is mutual, and because the process is iterative. First, the interaction of A and C is not a one-way street. While A was presented as the recipient of information provided by C in our example, in reality we would anticipate a mutual exchange of information. As a result, C has an interest in an honest interaction with A because he values the information he receives from A and would risk losing a precious contact if he were caught cheating. This is due to the second reason why we assume sincerity: the interaction between legislators who are highly connected is an iterative process. Within a single interaction, political adversaries may have strong incentives to misrepresent their true positions, yet in an iterative context, cheating is no longer costless because legislators’ trustworthiness is at stake. This trustworthiness is the basis for many behavioural norms in legislatures,Footnote 32 however, and legislators face penalties for disingenuous behaviour.Footnote 33
Calvert presents a formal model that outlines the first of these two examples, in which a political actor receives information from a source with similar preferences.Footnote 34 He makes the case that decision makers who rely on sources of information with predispositions in line with their own (or sources that are ‘biased’, as he calls it) make more accurate decisions than those who use sources that are objective or neutral in their evaluation of different policy alternatives. Yet Calvert does not consider that this conclusion may also apply when the source of information is a political adversary with opposing preferences. In other words, Calvert makes the implicit assumption that actors seek information from sources with whom they are predisposed to agree. Our second example demonstrates, however, that legislators, when trying to establish their policy positions, can receive cues from political opponents that are of equal value to those received from political allies.
An important precondition for the information-exchange dynamic we describe is that the receiver of the cue has an exogenous expectation of what the cue she receives from her colleagues ought to be.Footnote 35 Only if their positions are predictable can she compare the information she receives to her preconception of what her counterparts’ positions should be and therefore make a more informed vote choice. If her expectation is met, the appropriateness of her tentative policy position is confirmed. Yet if her colleagues provide information that contradicts her expectations, it increases the likelihood that she will re-evaluate her tentative policy position. Whether this source is a political ally with whom the legislator expects to agree or a political opponent with whom she expects to disagree, it is preferable that the probability of agreement or disagreement is particularly high, because this is what makes their positions predictable. Hence social contacts that serve as avenues of information exchange between pairs of legislators who are political allies (for example, who are from the same party or coalition of parties, or who have similar policy preferences) have greater value for legislators who are trying to establish their policy positions the more the two allies agree on policy issues; in contrast, contacts between political adversaries (for example, legislators from opposing parties or coalitions, or who have opposite policy preferences) have greater value the more the two adversaries disagree on policy issues. In both cases, the cues received from the information source are more predictable and therefore offer greater informational utility.
To summarize, it is worthwhile to focus attention on the tendency of legislators to agree, or vote the same way, because such an approach provides the smallest unit of analysis that allows the interactive and interdependent nature of legislators’ behaviour to be assessed.Footnote 36 Voting agreement is conditional on two key characteristics of legislators’ relationships: how connected they are to one another, and their individual expectations about whether or not they are likely to agree. When legislators are expected to agree, we expect that greater social connectedness leads to greater voting agreement. However, for legislators who are expected not to agree, we expect that greater social connectedness leads to less voting agreement. Figure 1 provides a depiction of these relationships (although we do not necessarily expect them to be linear).

Fig. 1 Hypothetical relationship between voting agreement and social connectivity, based on anticipated agreement
As Figure 1 shows, for legislators who generally expect to agree with one another (the solid line), the more socially connected they are, the more likely they are to vote the same way. This is an intuitive expectation. Less intuitive, however, is our expectation that there is a negative relationship between connectivity and voting agreement for legislators who expect not to agree with one another (the dotted line). For political opponents, we expect those who are most socially connected to one another to be least likely to agree, because this is what makes their relationship informationally valuable – the greater the opposition, the more useful the interaction. Appendix B provides a more formal treatment of why this might be so, and how it leads to our hypotheses below.
Of course, the diagram oversimplifies the idea, because legislators’ tendency to agree with one another is not typically a dichotomous position. Rather, if the expectation about agreement is continuous, then the intensity with which legislators hold these beliefs would affect the slope of the lines in the diagram, where being very certain about one's predisposition to agree (disagree) results in a steeper slope, but being less certain about the tendency to agree (disagree) results in a shallower slope. In this way, legislators’ voting agreement rates are conditional on their level of social connectivity and their ex ante beliefs about whether or not they are likely to agree with one another, based on their ideology and partisanship.
Hypothesis 1: The more socially connected two political adversaries are to each other, the less likely they are to vote the same way.
Hypothesis 2: The more socially connected two political allies are to each other, the more likely they are to vote the same way.
Before we turn to a research design that will allow us to test these hypotheses, it is worth noting that the dynamics we anticipate, if accurately depicted, will exhibit a certain degree of endogeneity (to be specific, simultaneity). We maintain that legislators establish social connections in an effort to receive cues from political friends and enemies that will in turn allow them to make more informed voting choices. In order to do this, they have to identify allies who are particularly likely to agree with them and opponents who are likely to disagree, as revealed by their voting behaviour. Fundamentally, we consider this to be an iterative process for which it is difficult, if not impossible, to determine what comes first: revealed preferences or social connections. Indeed, the ordering may vary from case to case. The causal relationship is further muddled by our expectation that voting agreement is in part dependent on expected voting agreement, which is itself endogenous. In fact, one may imagine a continuous feedback loop, and since this level of endogeneity rules out strict causal inference, we limit our claims to symmetric association. We conceptualize voting as our dependent variable, however, because the ultimate purpose of establishing social connections is to aid informed voting choices, not vice versa. That is, a legislator establishes connections with colleagues who can provide cues that will allow him to confirm or dismiss his policy predisposition and thus aid his voting choices. In the next section, we address how our empirical analysis deals with this difficult theoretical problem.
Research design
To test our hypotheses, we require information about the level of social connectedness between legislators. We gathered this information by collecting data on the social relationships of legislative staff in the EP's Committee on Environment, Public Health and Food Safety (hereafter Environment Committee).Footnote 37
Research on the EP has shown that politics in this first-ever international, genuine lawmaking body is not structured along national lines, but is primarily party based. In fact, the party system in the EP has become more consolidated and more competitive as the EP's powers have increased over time.Footnote 38 Comprehensive roll-call vote analyses show an increase in ideology-based party competition in the EP on the basis of the traditional left-right ideological divide. These analyses demonstrate that MEPs vote primarily in accordance with their party affiliations, rather than with their national affiliations; that the distance between parties on the left-right dimension is the strongest predictor of voting patterns; and that EP party groups are remarkably cohesive.Footnote 39 The power of transnational parties in the EP has thus risen ‘via increased internal party cohesion and inter-party competition’.Footnote 40
In this sense, parties are at the heart of politics in the EP. Nonetheless, the EP differs in important ways from a conventional parliamentary body, most significantly in that there is no government-opposition dynamic, where the executive is tied to a majority coalition in the EU's legislative chamber. Hence the EU's institutional framework exhibits features of a separation of power system,Footnote 41 in which political actors in the EP are less constrained than in traditional parliamentary systems because they are not simply expected to rubber stamp decisions made at the executive level. The EP is capable of actually creating legislation, ‘a classical parliamentary function almost forgotten by some national parliaments’.Footnote 42
In this system, individual legislators play a more important role than in a parliamentary system, in which party positions are enforced by strong party organizations and backbenchers are coerced into voting the party line. Policy positions in the EP are endogenous to the political decision-making process, and individual legislators take the lead in creating these positions within specialized committees.Footnote 43 It is thus not surprising that most of the detailed parliamentary work is conducted in and by committees, and that the majority of substantive changes and compromises are constructed inside these committees.Footnote 44
The existing literature on EP politics has largely focused on the aggregate level and has neglected to examine the individual dimension. Yet recent research emphasizes the central role of individuals and the significance of their interaction in EP decision making,Footnote 45 which is enhanced by the importance of informal channels in the political process.Footnote 46 If individuals in fact shape policy positions, it is critical to examine who talks to whom, which actors interact on a regular basis and how information flows through these networks of individual legislative actors.
Legislative Staff
Legislative staffs, or parliamentary assistants in this case, can be viewed as extensions of the legislators themselves, as they are key actors in the legislative offices of MEPs. We treat the social networks of staffers as a proxy for the corresponding social network of legislative offices. This conceptualization is supported by the existing research on legislative staff, which is focused primarily on the US Congress. DeGregorio, for example, argues that staffers are not entrepreneurial individualists, but ‘influence extenders’ of their bosses,Footnote 47 and that staff are largely constrained from pursuing individual ambitions.Footnote 48 Other scholars have found that elected officials tend to hire staff that share their ideological and policy views.Footnote 49 Existing evidence also suggests that one should expect to find a significant relationship between the networks of legislative staffers and the behaviour of legislators. Whiteman describes how ‘congressional enterprises’, or offices made up of legislators and staffers, exchange highly diverse and specialized information with one another.Footnote 50 In addition, Romzek and Utter emphasize that networking is one of the primary norms that legislative staffers follow. They argue that staffers use networks to gather information, develop coalitions and affect legislation.Footnote 51
The members of the 2004–2009 EP employed 1,416 full-time assistants in their offices in Brussels and Strasbourg.Footnote 52 On average, each MEP is assisted by two staffers, which bolsters our case that staff contacts are a suitable proxy for the social network of MEPs, because legislative assistants in the EP necessarily work closely with their members. These staffers’ tasks and responsibilities range from secretary to gatekeeper to political advisor. For this reason, a recent feature article on the EP's website described MEP assistants as ‘a sort of secretary-advisor-press-officer-tour guide’.Footnote 53 Their realm of responsibility is usually confined to one of the committees of which their MEP is a member. Assistants prepare position briefs or even draft amendments for their MEPs, and balance this legislative part of their work with other organizational and public relations-related functions.
Network Data
To collect information on social networks among legislative offices, we invited MEPs’ assistants to complete a web-based questionnaire in which they revealed the MEP offices of the assistants with whom they have contact on a regular basis.Footnote 54 Participants were given the option of completing the survey in English, German or French.Footnote 55 We contacted non-respondents with requests for in-person interviews to offer an alternative to the impersonal survey format. Interviews were less structured than the questionnaire but designed to obtain equivalent information.
The analysis in this article is focused on a limited policy area, namely environmental policy and consumer protection. Hence this analysis seeks to map the network of EP assistants who work for MEPs who were members of the Environment Committee during the 2004–2009 EP term. One concern with this research design may relate to the small subset of legislative offices our analysis focuses on. Why should we care about empirical findings that are drawn from a small group of lawmakers in only one policy area? There are three primary reasons why.
The first relates to the uniqueness of our data, because our analyses are based on actual social connections between legislative offices, as reported by their legislative staff. This means that we are measuring what we set out to measure, rather than using a relational variable as a proxy for social connectedness. We can thus have great confidence in any finding that social connectedness has a significant effect on legislative outcomes. However, collecting these data is unusually difficult due to their highly sensitive nature, since we asked respondents in legislative offices to reveal the other offices with which they have regular contact.Footnote 56 Therefore, we were only able to target a small number of respondents.
Second, given how sensitive network analysis is to missing observations and non-response, it is preferable to focus on a complete sub-network of legislators in one policy area than to adopt standard approaches that simply aim for as many observations as possible.Footnote 57 In other words, it is better to have the highest possible response rate for only the environmental policy network, which we do in this article, than to maximize the number of cases across all policy areas, even if it means fewer total observations. For example, our response rate for the environmental policy network, composed of all members of the Environment Committee, is 47 per cent (thirty-two of sixty-five). If we had five times as many respondents across all policy areas (a rather unrealistic number of 160) drawn from the sample of all MEPs (785 at the end of the 2004–2009 legislative term), our response rate would be only 20 per cent and thus much more problematic from a network analysis point of view.
Third, the legislative reports and draft resolutions that are prepared in the responsible committees are not only submitted to the EP plenary in an almost ‘take-it-or-leave-it’ form,Footnote 58 they provide the basis for the positions taken on the EP floor. In fact, the policy positions of the members of the responsible EP committee are highly predictive of the voting patterns of their colleagues on the EP floor, as most MEPs simply adopt the positions of their committee representatives when casting their votes.Footnote 59 This aggregation of committee positions to the EP plenary means that our analysis of the voting patterns in the Environment Committee bears considerable significance with regard to EP policymaking more generally, since what happens in committee largely determines what happens on the EP floor.
Our network data are not collected from the entire population of MEPs, but neither are they taken from a sample in the traditional sense. Assistants from all members of the Environment Committee were invited to participate in the study,Footnote 60 so we were in effect attempting a census for the associated sub-network. Thus limitations on any inferences we draw will be a result of non-response, rather than sampling design. Non-response threatens the validity of any survey-based research; the difficulties are compounded in the case of social networks. There has been some recent progress on missing data problems in network sampling,Footnote 61 but no clear strategy is currently available. For the time being, we must assume that non-respondents are missing at random, in the sense that whatever mechanism is responsible for certain staff members responding and others not responding is unrelated to their social and voting habits. Fortunately, we have complete data on votes, so we can at least verify that non-respondents are not notably different from respondents with respect to the dependent variable. Ideologically, our respondents are strikingly similar to non-respondents, as evident in Figure 2.Footnote 62 Notice that all spatial clusters are represented by respondents; even the four somewhat isolated pairs – three on the right and one on the left – each contain one respondent. Likewise, there is no evidence that certain geographical regions are underrepresented. As shown in Table 1, countries have been grouped roughly by region, and a chi-square test finds no statistical evidence of a relationship between non-response and region. Similarly Table 2 indicates no self-selection bias among MEPs from older or newer member states of the EU (pre- and post-2004, respectively).

Fig. 2 No evidence of response bias by ideological position
Table 1 No Evidence of Response Bias by Region
Pearson chi-square (3) = 0.935; Pr = 0.817
Table 2 No Evidence of Response Bias by Date of Joining EU
Pearson chi-square (1) = 0.3752; Pr = 0.540
For a conventional dataset, these patterns of non-response would give us great confidence in our inferences; for social network data, though, we must be cautious with anything less than a 100 per cent response rate, given the current limitations on our knowledge of how the effects of missingness can be expected to propagate through a network. We sought to capture the entire population of people that worked on the issue area of interest by contacting EP assistants who worked for each member of the Environment Committee at the time the study was conducted. We structured the survey and interviews to allow respondents to provide open-ended responses to questions about whom they talk to on a regular basis. We did not ask them to name a fixed number of social contacts, nor did we ask them to restrict their attention to other committee members; we simply asked whom they talk to and left it up to the respondents to provide a list as they saw fit. This approach is supported by social network literature that suggests open-ended questions are less likely to produce non-random sampling bias than methods that give respondents a fixed list.Footnote 63
We invited the assistants of all sixty-five members of the Environment Committee to complete the questionnaire.Footnote 64 Of these, we received thirty-two responses (twenty-four interviews and eight completed questionnaires), for a response rate of 47 per cent.Footnote 65 The Environment Committee inter-office network in its entirety would thus include communication among all sixty-five offices, involving 4,160 dyads (or 2,080 if communication is considered symmetric). If we focus just on those dyads that connect survey respondents, we will have only 870, or about 21 per cent of the full dyad census. However, we do have information on communication between respondents and non-respondents, since the former were given an opportunity to identify the latter. Taking this information into account yields a dyadic response rate of 46 per cent (direct reports of 1,920 of 4,160 dyads). If we take respondents’ reports on their contact with non-respondents’ offices as an indicator of the symmetric relationship of contact between offices, then the only dyads that are completely missing from the study are those consisting of two non-respondents; we have no information on whether either of these two non-respondents communicated with one another. From this point of view, we have a (somewhat unbalanced) dyadic response rate of 71.4 per cent.Footnote 66
In the questionnaire and the personal interviews, respondents indicated the frequency with which they contacted each person in their network. We converted this frequency information into a dichotomous measure, coding contacts that occur at least once a month as one (that is, the actors are connected) and less frequent or non-existing contacts as zero (the actors are not connected).
The relationship captured by the underlying social network we wish to observe, inter-office communication, is inherently undirected; we are not asking staffers about directed relations such as trust or advice – or even who initiated contact with whom – but simply whether, and with what frequency, incidents of contact take place for each pair of MEP offices. Thus we would like to treat the ties measured through responses to our survey as undirected, defining a tie as existing between Member A and Member B whenever a staffer from A's office names B's office as a contact or vice versa. To do so, however, would leave us more likely to detect contact between two offices of survey respondents than between any two offices, only one of which contains a respondent. One solution would be to restrict our attention exclusively to the respondents-only network, however this approach would forfeit a lot of data and drastically increase the chance that non-response bias would invalidate our results. We will thus instead treat social contact as constituting a directed relation, reported contact from respondent to recipient: if two offices contain respondents, both responses will constitute observations, implicitly weighting corroborated reports of contact most heavily.Footnote 67
Typically, it is useful to report on a network's density for descriptive purposes. In social network terms, the density is the percentage of all pairs in a network that is tied to one another. In our case it is not straightforward to report the density, because not all dyads have been observed in our network. We are unable to consider pairs of non-respondents in our calculation, as we have had no opportunity to observe social contact, or a lack thereof, between their offices. If we focus solely on the sub-network among dyads in which both the respondent and alter provided us with information, the density is 5.7 per cent (9.7 per cent if we treat the network as symmetric by defining a tie as present whenever either member of a pair reports inter-office contact). If we instead use all the information obtained and analyse the asymmetric sub-network of respondents in which at least one member of the dyad provided us with information, the density is 6.1 per cent (118 out of 1,920 possible ties).
Operationalization
In order to evaluate our theoretical propositions about patterns of social connectedness in legislative politics, we collected information on all bills that received a final plenary vote in the EP that fell under the jurisdiction of the Environment Committee during the sixth parliamentary term between July 2004 and July 2008, as well as all votes on amendments to these bills. This method provides a total of forty votes for this analysis. Following from our hypotheses, we need to operationalize three key concepts in the context of Environment Committee members and bills studied: policy disagreement, political allies and adversaries, and social connectedness.
Policy disagreement, the dependent variable in our analysis, is the rate of co-voting; that is, the proportion of votes each pair casts in agreement (either both ‘yea’ or both ‘nay’), given that both members of the dyad voted on a given roll call. An alternative approach would be to treat each roll-call vote as a dichotomous variable, predicting agreement on each given bill. To do this convincingly would require information about each bill, as well as addressing the non-independence of the bills. If we were interested in estimating the particular locations of bills with respect to MEPs’ ideal points, we would have no other choice. Our intention here, however, is to gauge the degree to which a pair's overall propensity to cast votes in common depends upon social connectedness between the MEPs’ offices, controlling for party and national affiliations. Note that only one predictor variable (point connectivity, see below), is explicitly social network-based. However the response variable is also relational (dyadic) and subject to many of the same estimation challenges found in social networks, although it does not, strictly speaking, represent social interaction. Figure 3 shows the frequency of co-voting between all pairs and indicates that about one-third of all pairs vote together 100 per cent of the time.

Fig. 3 Co-voting rates for each reported committee member pair
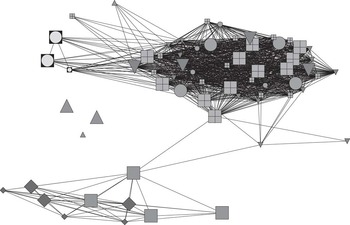
To establish which pairs of legislators qualify as political allies or adversaries, a conventional approach would either use shared party affiliation as an indicator of alliance or use ideological proximity with respect to a continuous measure, such as a party's NOMINATE score. The former may be too restrictive, as multiple parties are involved and may be expected to cluster on votes. The latter, however, would be too general, as it reflects the full spectrum of issues rather than the particular business of the Environment Committee. Thus we will use both party identification and voting bloc membership to indicate which dyads of legislators are friends or enemies, where the voting blocs are inferred from the voting record. Specifically, on the basis of our data, the Group of the United European Left/Nordic Green Left (GUE/NGL) and the Greens/European Free Alliance (Greens/EFA) vote together on committee bills and are thus considered a bloc. Ideologically, they are the furthest to the left according to their NOMINATE 1st dim scores (−0.52 and −0.37, respectively). The centre-left and centre-right parties – the Party of the European Socialists (PES), the Alliance of Liberals and Democrats for Europe (ALDE), the Union for Europe of the Nations (UEN) and the European People's Party (EPP-ED) (−0.11, 0.03, 0.16 and 0.20 NOMINATE 1st dim, respectively) hang together – and in opposition to the other two most left-leaning parties – on roll calls associated with Environment Committee bills.Footnote 68 There are four members who do not vote reliably with either voting bloc and so are not considered members of either.Footnote 69 In Figure 4, each node represents a unique MEP, and shapes indicate their parties. The line segments connecting the nodes (‘edges’ in social network terminology) represent reported social contact between MEP offices.Footnote 70 The distance between the nodes in Figure 4 indicates the degree of voting correspondence. The fact that all nodes for the two left-most parties cluster tightly together, as do the four centre-left and centre-right parties, lends visual support for treating these as party clusters, or blocs.

Fig. 4 Voting blocs among all sixty-five members of the Environment Committee on Environment Committee bills
Note: Edges (represented here as line segments connecting certain pairs of nodes) are visible for pairs voting together more than 90 per cent of the time. Nodes of the same shape belong to the same party, and large nodes represent survey respondents. The graph shows two voting blocs and cohesion among like-party members.
It might seem strange to include party bloc as an explanatory variable, as it is based upon observation of the voting pattern itself, the very behaviour we are attempting to explain. Note, however, that we are not attempting to explain votes by voting bloc per se. That is, we do not simply look for clusters of MEPs voting together often and label them a bloc; rather, this concept of party bloc simply extends the notion of party as predictor. We are agnostic as to whether the clustering of parties is coordinated or based on shared preferences. We recognize that a large amount of variance is explained by party membership and, by extension, membership in certain clusters of parties. The point then is to control for common party and shared membership in parties that seem to generally stick together on environmental votes. The two identified blocs correspond to a clean split on their one-dimensional NOMINATE scores,Footnote 71 with independents and non-affiliated members not included in either bloc. As evident in Figure 4, with the exception of only two dyads, all instances of 90 per cent or greater co-voting are intra-bloc dyads. By accounting for the strongest (and most obvious) predictors of shared votes, we will have the chance to detect the softer signals that would otherwise be ignored as noise.
Additionally, notice that we use the voting bloc identifiers to indicate legislators’ expected rate of voting together. Including this expected rate of co-voting on the right-hand side also helps us with the endogenous causality problem, because although our model suggests that social connectedness ‘causes’ co-voting, it may also be the case that the expectation of co-voting leads MEPs to socially connect to one another. We can account for this reverse specification by controlling for anticipated co-voting. By controlling for legislators’ ex ante tendency to vote together, we are both appropriately modelling our theory and accounting for the possibility that anticipated co-voting drives social connectivity.
For the purpose of measuring the social connectedness of actors in the network, we start with a dichotomous measure of whether or not there is contact between two members of the network. We use this information to generate a network measure called point connectivity.Footnote 72 Point connectivity (‘connectivity’ for short) calculates the number of members that would have to be removed from the network in order for one actor to no longer be able to ‘reach’ another one. The logic behind this measure is that if there are numerous possible pathways between two actors, they are highly connected with each other.Footnote 73 It also allows a more nuanced view of social connection, which is based on the overall network structure rather than dyads in isolation. Two offices that have not reported contact with one another but have several contacts in common have a number of channels through which information can flow. Such a measure will also be less sensitive to the effects of missing data; two offices for which direct contact exists that has gone unreported are more likely to have social partners in common than if there were truly no interaction between them, and this will be reflected in their connectivity score. The mean connectivity between two actors in our network is 2.2 (median of 2), which indicates that for a typical dyad, it would take the removal of two nodes from the network to eliminate all (observed) paths connecting the two offices. The modal dyad has connectivity of just 1; 39.5 per cent of office pairs would be cut off from one another by removing a single node in the network. A full 12.4 per cent of dyads exhibit zero connectivity; no direct or indirect paths connect these pairs of offices. The maximum connectivity score is 12 and applies to only one pair of MPs: a Spanish member of the European People's Party and a British Conservative. Figure 5 depicts the relative frequencies of the point connectivity values.As one might expect, the majority of reported contact takes place between members of the same party. This is evident in Figure 6, which depicts the social contacts between all sixty-five members of the Environment Committee. In this graph, nodes represent MEPs on the Environment Committee and edges indicate social contact between the staffs in MEP offices. The shape of the nodes indicates members of the same party, whereas the size of a node indicates offices that responded to our inquiries (large nodes) and those that did not (small nodes). The network graph of the Environment Committee shows frequent contact between the staffs in offices of MEPs of the same party (indicated by the short distance between the nodes), but also a fair amount of cross-party contact. Though it is not indicated in the graph, the data also suggest strong connections among staff members from the same country.Footnote 74

Fig. 5 Relative frequencies of point connectivity scores for all reported dyads.

Fig. 6 Reported inter-office social contacts among staff of all sixty-five members of the Environment Committee
Note: Nodes of the same shape represent members belonging to the same party. Size of node differentiates respondents (large) from non-respondents (small). The graph shows frequent contact between same-party MEPs and a fair amount of cross-party contact.
Statistical Analysis
In attempting to choose and fit a model, we encounter two principal challenges. The first is the fundamental problem of social network autocorrelation, which is well known to those who work with social network data. This problem arises whenever dyads (pairs of individuals) are the units of observation, regardless of whether or not they are drawn from a social network per se. Typical regression-style inference assumes independent observations, but of course observations on pairs of actors within a single network are highly dependent. At a bare minimum, observations on any two dyads that have an actor in common cannot be considered unrelated. Incorrectly assuming that an observation on dyad (i,j) is independent of an observation on dyad (i,k) leads to biased, inconsistent estimators and the underestimation of standard errors.
The second challenge involves a feature of these particular data. Of the 1,920 observations, 594 are on dyads voting together 100 per cent of the time (on the forty Environment Committee bills). Of these, a full 97 per cent (574) are identified as pairs belonging to a common voting bloc. There are in fact two distinct patterns to the voting. One-third of the observations exhibit virtually no variation beyond that predicted by voting bloc membership. The remaining observations exhibit a great degree of variation, which has the potential to be explained by a factor other than voting bloc membership.
Before introducing the model, let us briefly explain our approach to addressing these two challenges. The fundamental problem of social network autocorrelation is the more serious of the two. A number of strategies has been suggested and improved upon in recent years, but even the most sophisticated of current inference methods does not fully address the problem. Nonetheless, the available methods represent a great improvement over the alternative of ignoring the issue altogether. The crux of the problem is that the autocorrelation structure of relational data may be quite complicated, which makes it difficult to correctly specify a model, express the likelihood and estimate the corresponding parameters of interest. The greatest progress has been made in the special case of dichotomous variables, in which the relationship of interest is either present (1) or absent (0).Footnote 75 The best existing approaches for continuous or effectively continuous dyadic variables fall into the category of multilevel (sometimes called mixed-effects) models. The basic idea is to employ random effects to capture much of the network-type clustering of the observed data, thus greatly reducing the degree to which estimators will be biased and standard errors underestimated. The most obvious type of interdependence is also the source of the most egregious mistakes in estimation: observations on pairs consisting of at least one individual in common cannot conceivably be expected to exhibit independence. This is obvious when the response variable is truly social in nature; if, for instance, yij measures expressed trust for individual j, this is bound to depend in part on the former's general tendency to trust and on the latter's trustworthiness. Although our actual response variable, the co-voting ratio, is symmetric and not truly a social measure, the same potential for autocorrelated errors is nonetheless present, meaning the usual methods of inference will not be applicable. We thus condition on the particular individuals who make up the dyad by including what are known as crossed effects in the multilevel modelling literature.Footnote 76 Rather than assuming these idiosyncratic individual contributions to be fixed parameters (estimated with dummy variables), it is convenient to instead assume these to be drawn from a distribution (typically bivariate normal). It may be helpful to think of this approach as partitioning the usual error into components associated with each individual actor, leaving any remaining error to be free of the principal source of autocorrelation.
The second challenge becomes apparent if we attempt to fit the ordinary least squares (OLS) version of the linear model (Equation 1 below). The misspecification is apparent when we analyse the residuals, which exhibit a distinct pattern and are not normally distributed. Part of the problem is that we are dealing with a limited dependent variable, constrained to lie between 0 and 1. The standard linear regression approach may be applied in the case of a proportional response, but it works best when the observed responses lie far from either endpoint. We will transform the dependent variable by taking the log-odds ratio. This means discarding all the observations of 100 per cent and 0 per cent vote agreement (there are only five of the latter). While this might seem troubling, we argue that there is virtually no information contained in the discarded data, so including those observations would not change any substantive results. Also, by removing the unanimous votes, the estimation provides a more conservative test of our expectations. Finally, removing unanimous votes is consistent with other methods of spatial voting analysis, such as Poole and Rosenthal's NOMINATE scores.Footnote 77 As mentioned earlier, those who vote together on all forty roll calls are members of the same voting bloc. We might surmise that these individuals’ votes on Environment Committee bills are the result of their conscious intra-bloc cohesion; in any case, when predicting their decisions we can do no better than to use their membership in the two voting blocs. We include results for the (misspecified) linear version, which uses all the data as well as the log-odds-transformation fit to the subset of data.
To test our hypotheses we conduct a series of analyses. Our objective is to determine whether more socially connected political adversaries (MEPs from opposite voting blocs) are less likely to vote together (Hypothesis 1), and whether more socially connected political allies (MEPs from the same voting bloc) are more likely to vote together (Hypothesis 2). We start with the OLS version of our model, both for simplicity and in order to note how estimates may be affected as we address the misspecification.
 $$ no{ E({\rm{co{\hbox -} voting}} \ {\rm{rat}}{{{\rm{e}}}_{ij}}|{{{\bf {{x}}}}_{ij}}{\bf {{)}}} = & {{\beta }_0}\, + \,{{\beta }_1} \ {\rm{same}} \ {\rm{part}}{{{\rm{y}}}_{ij}}\, + \,{{\beta }_2}\ {\rm{same}} \ {\rm{coalitio}}{{{\rm{n}}}_{ij}}\, + \,{{\beta }_3} \ {\rm{same}} \ {\rm{nationalit}}{{{\rm{y}}}_{ij}} \cr & \, + \,{{\beta }_4} \ {\rm{absolute}} \ {\rm{difference}} \ {\rm{in}} \ {\rm{seniorit}}{{{\rm{y}}}_{ij}}\, + \,{{\beta }_5}\ {\rm{po}}{\rm int} \ {\rm{connectivit}}{{{\rm{y}}}_{ij}} \cr & \, + \,{{\beta }_6} \ ({\rm{point}} \ {\rm{connectivit}}{{{\rm{y}}}_{ij}}\,\times \,{\rm{same}} \ {\rm{coalitio}}{{{\rm{n}}}_{ij}}) $$
The dependent variable is the co-voting rate between two legislators; that is, the fraction of roll calls on which two MEPs vote in agreement, given that both members of the dyad cast a vote on any given roll call. The independent variables for joint party membership (Same Party), common membership in an observed party bloc (Same Coalition) and joint nationality (Same Nationality) are set to 1 if the pair belongs to the same party, bloc or nation, respectively. We also include the Absolute Difference in Seniority of any two MEPs as an independent variable.Footnote 78 Finally, we include the Point Connectivity of the given pair, as well as the interaction between point connectivity and membership in the same voting bloc, to test the hypothesis that social proximity will predict a lower rate of co-voting among political adversaries from opposite voting blocs. Adding this interaction term will provide a key insight that allows us to test our primary questions of interest:
 $$ no{ E{\bf {{(}}}{\rm{co {\hbox-} voting}} \ {\rm{rat}}{{{\rm{e}}}_{ij}}|{{{\bf {{x}}}}_{ij}},{{a}_i},{{b}_j}{\bf {{)}}}\, = \, {{\beta }_0}\, + \,{{\beta }_1}\ {\rm{same}} \ {\rm{part}}{{{\rm{y}}}_{ij}}\, + \,{{\beta }_2} \ {\rm{same}} \ {\rm{coalitio}}{{{\rm{n}}}_{ij}}\, \cr \quad+ \,{{\beta }_3} \ {\rm{same}} \ {\rm{nationalit}}{{{\rm{y}}}_{ij}} \, + \,{{\beta }_4} \ {\rm{absolute}} \ {\rm{difference}} \ {\rm{in}} \ {\rm{seniorit}}{{{\rm{y}}}_{ij}} \cr \quad+ {{\beta }_5} \ {\rm{po}}{\rm int} \ {\rm{connectivit}}{{{\rm{y}}}_{ij}} \, + \,{{\beta }_6} \ ({\rm{point}} \ {\rm{connectivit}}{{{\rm{y}}}_{ij}} \cr \quad\times {\rm{same}} \ {\rm{coalitio}}{{{\rm{n}}}_{ij}}) + {{a}_i}+{{b}_j} \cr ({{a}_i},{{b}_i}) \sim MVN(0,\rSigma ),\rSigma \, = \,\left[ {\matrix{ {\sigma _{a}^{2} } & {\rho {{\sigma }_a}{{\sigma }_b}} \cr {\rho {{\sigma }_a}{{\sigma }_b}} & {\sigma _{b}^{2} } }} \right] $$
where xij represents covariates (x) between legislator i and legislator j, and ai and bi represent random effects associated with the respondent and the alter, respectively.
This linear mixed-effects (multilevel) model (2) was fit via restricted maximum likelihood (‘lmer’ function in R) using all the observations, but the assumption of linearity in the expected co-voting rate is incorrect, as is apparent from the residual analysis of the OLS model (1).Footnote 79 The misspecification that results in non-normal residuals for OLS also translates into non-normal random effects in this first attempt at a multilevel model. The random effects correspond, respectively, to idiosyncratic errors associated with the survey respondent and the member office with which she is reporting possible contact. In this way, we take into account the tendency for observations on dyads with an individual in common to be correlated. For instance, those tending to vote with the winning voting bloc will in general have high co-voting rates with more colleagues than those who tend to vote on the losing side. This variability can now be associated with the individual rather than with the dyads to which she belongs. Note that we are not interested in the estimated parameters for the normal distribution that is presumed to generate these random effects; this device is used purely to induce network-type dependence in order to allow the remaining errors to be more nearly conditionally independent.
Finally, we transform the dependent variable by taking the expected log-odds of co-voting to be a linear function of dyadic covariates and dropping dyads with 0 per cent or 100 per cent vote agreement. Again we used ‘lmer’ in R, this time employing the Laplace approximation to fit the resulting generalized linear (logit) mixed-effects model:Footnote 80
 $$no{ E\left[ {\log \left( {\frac{{CVRAT{{E}_{ij}}}}{{1{\rm{ - }}CVRAT{{E}_{ij}}}}\bigg| {{{{\bf {{x}}}}_{ij}},{{a}_i},{{b}_j}} \right.} \right)} \right]\, = \, {{\beta }_0}\, + \,{{\beta }_1} \ {\rm{same}} \ {\rm{part}}{{{\rm{y}}}_{ij}}\, + \,{{\beta }_2} \ {\rm{same}} \ {\rm{coalitio}}{{{\rm{n}}}_{ij}}\, \cr \quad + \,{{\beta }_3} \ {\rm{same}} \ {\rm{nationalit}}{{{\rm{y}}}_{ij}} \cr \quad + \,{{\beta }_4} \ {\rm{absolute}} \ {\rm{difference}} \ {\rm{in}} \ {\rm{seniorit}}{{{\rm{y}}}_{ij}}\, \cr \quad + \,{{\beta }_5} \ {\rm{po}}{\rm int} \ {\rm{connectivit}}{{{\rm{y}}}_{ij}} \, + \,{{\beta }_6} \ ({\rm{point}} \ {\rm{connectivit}}{{{\rm{y}}}_{ij}}\, \cr \quad \times \,{\rm{same}} \ {\rm{coalitio}}{{{\rm{n}}}_{ij}})\, + \,{{a}_i}\, + \,{{b}_j} \right $$
Results
Our primary finding is that the more closely connected a pair of legislators from opposite voting blocs is, the less often they vote together. The coefficient on point connectivity is negative and statistically distinguishable in all three model specifications, even when controlling for party and voting bloc affiliation (see Table 3). This finding confirms our key hypothesis (Hypothesis 1), the counterintuitive claim that socially connected MEPs from opposing voting blocs are less likely to vote together.
Table 3 Regression Results for Restricted Sample

Note: The dependent variable in each model is the proportion of roll-call votes on which each dyad of legislators voted the same way. Models 1 and 2 are admittedly misspecified, and are presented for purposes of comparison. Model 1 is straight OLS. Model 2 is fit with all observations and includes a random effects estimator, but assumes a linear relationship that is unrealistic, at least for extreme values of the response variable. Model 3 excludes observations with perfect co-voting and transforms the dependent variable. Numbers in parentheses are standard errors.
Unfortunately, our data prevent us from fully evaluating Hypothesis 2, the intuitive claim that socially connected political allies will tend to vote together. This is because there is virtually no variability in voting patterns among same-coalition members that cannot be explained by coalition membership alone. Of 594 same-coalition dyads, a full 574 voted together on 100 per cent of the Environment Committee bills. This means that our findings concerning this proposition are inconclusive: there is not enough variance in these particular data to allow us to either confirm or dismiss Hypothesis 2.
Notice that joint nationality and difference in seniority are not statistically significant in any of the models, and that membership in the same party is not significant when controlling for membership in the same voting bloc; being in the same party does not predict any additional propensity to cast identical votes beyond what is predicted by virtue of being in the same cluster of parties taken to be a voting bloc. On the bills analysed here, parties show no additional cohesion beyond that displayed by the voting blocs as a whole. The complete results of our estimations are shown in Table 3.
Intuitively, the coefficients in the final model (3) can be thought of as an expected percentage change in the odds of voting together, which corresponds to a unit change in the predictor when controlling for the covariates. Thus a coefficient of around 3 on membership in the same voting bloc means that the odds of voting together will be expected to increase by 300 per cent if a pair shares a voting bloc; if the other covariate values yield a prediction of even odds (1:1 or probability of 0.5) of voting together when legislators are from opposite voting blocs, the odds would jump to 4:1 (or probability of 0.8) if they are in the same voting bloc.
Regarding our primary variable of interest, a unit increase in point connectivity leads to an expected drop of 10 per cent in odds (or 7–13 per cent) with 95 per cent confidence for non-voting bloc pairs. On the probability scale, if the expected rate of co-voting is 50 per cent (as is the case for two MEPs who do not share a voting bloc), a one-unit increase in point connectivity centred on its median (for example from 1.5 to 2.5, where 2 is the median) would correspond to a drop of 3 per cent (50 per cent down to 47 per cent) in expected co-voting. Increasing from a standard deviation below the mean point connectivity to a standard deviation above, from 0.6 to 3.8, results in a decrease in expected co-voting rate from 52 per cent to 44 per cent. Figure 7 graphically depicts this effect. The solid line shows that as dyads from opposite ideological voting blocs increase their social connectivity, their predicted rate of co-voting declines. Without information about social connectivity, we would expect opposing voting bloc members to vote together about 50 per cent of the time – the empirical mean among such dyads.

Fig. 7 Predicted probability of voting together across coalitions, as a function of connectivity
Note: The dark solid line represents the predicted rates of co-voting under the log-odds multilevel model for pairs NOT in the same voting bloc and varying rates of connectedness. The graph shows that political ‘enemies’ tend to vote together less often as they become more connected. The predicted change appears nearly linear on the probability scale in the neighbourhood of 50 per cent co-voting, but this is not the case for less typical values.
It is worth noting that we estimated a series of alternative specifications in an attempt to tease out the causality problem described above, but the small number of observations renders our data sensitive to specification changes.Footnote 81 This lack of robustness gives us some pause about the general findings here, but our data do support our hypothesis about the negative relationship between social connectivity and voting agreement among political adversaries. The survey we implemented was very specialized, thus precluding immediate data additions, but we hope that future data collection efforts will allow us to confirm this hypothesis.
Conclusion
In this article, we use social network analysis to demonstrate that legislators establish social networks that include both political allies and political enemies, and that they appear to use these information networks to engage in sophisticated cueing. We also illustrate the utility of social network analysis for the study of legislative politics. Indeed, it is only by using a social network approach that we can convincingly operationalize our theoretical propositions, and only by modelling network interactions in a principled manner (for example by including appropriate mixed effects) that we can examine the empirical evidence for such a theory.
This article makes theoretical, methodological and empirical contributions to the literature on legislative politics, specifically, and has applications for social network analysis more broadly. Our argument about information exchange and social ties in legislative politics suggests that legislators establish relationships with political friends and enemies in an effort to evaluate the appropriateness of the positions they are predisposed to take concerning particular issues. A legislator can test her predisposition by soliciting information about the positions of the colleagues she is socially connected to. If these colleagues provide cues about their policy positions that match her expectations, her predisposition is confirmed; if they deviate from expectations, it is likely to trigger a re-evaluation of her initial position and potentially a different vote choice. However, the legislator must have a clear expectation of what the positions of her social contacts ought to be; this is only the case if they either consistently agree or consistently disagree with her. There is an interactive relationship between social ties and anticipated agreement with respect to voting. Therefore social contacts between political allies have greater value the more the two allies agree on policy issues, while social contacts between political adversaries have greater value the more the two adversaries disagree. Following this logic, we expected social ties between legislators to be positively associated with co-voting for ideologically similar legislators (a proposition that the nature of our particular dataset prevents us from evaluating) and negatively associated with co-voting for those who are ideologically opposed, which our data confirm.
The primary contributions of this article are in theory and method. Theoretically, we have more fully developed the socially derived determinants of legislative voting. We offer an explanation for legislators’ tendency to seek ‘strange bedfellows’ for strategic reasons and demonstrate the utility of the informational cueing that occurs between legislators. We also contribute to the existing contradictory literature on the relationship between political disagreement and political behaviour. We show that for legislators, this relationship is conditional on social connectivity and ideology. The empirical tests of this theory are compromised because of an intractable causality problem – which is not at all unusual in political science – and because our attempt to collect true social network data from EP staffers resulted in a small number of observations, missing data and a lack of variance on some key terms of interest. These problems limit the inferences we can draw from our analyses, but we are, at least, encouraged that we found some support for our claims in the statistical approaches presented here.
Methodologically, this article makes an important contribution by illustrating a way to appropriately incorporate social network measures into traditional statistical models used to test inferences that are of interest to political scientists. We have demonstrated that regression models that include social network measures must be treated with care because of interdependence between observations. Our investigation successfully employed a mixed-model approach that includes random effects for each member of each dyad, and hence corrects for the dependence between observations.