

Gender differences in various types of political attitudes and behavior have been well documented. Previous studies have investigated topics such as gender differences in the saliency of issues,Footnote 1 turnout,Footnote 2 political engagementFootnote 3 and political ambition.Footnote 4 A gender gap has also been reported in patterns of party choice. Before the 1970s, the US Republican Party attracted more female than male voters; since then, women have been more likely to vote for the Democratic Party. Most other industrialized countries have also experienced the emergence of a ‘modern gender gap’ in which women are more often left leaning than men.Footnote 5 Among the explanations for these developments are socio-structural changes in women’s participation in higher education and the workforce.Footnote 6 Gender gaps are also likely to reflect gender differences in the distribution of policy preferences and saliency. Studies show that such differences indeed exist, although they are marginal for many issues.Footnote 7
While these insights contribute to our understanding of patterns of over-representation of men or women among the electorates of different parties, a great deal of variation in the gender balance remains unexplained, both within and between party families, as well as between elections. A telling example comes from research on arguably the most consistent gender gap in the European context – the one in support for the Far Right. Extant research shows that differences between men and women in socio-structural positions and policy preferences do not provide a general explanation for this gender gap.Footnote 8 In short, even though these factors explain the gender gap in support for some parties, they fail to explain it for others.
This suggests, first of all, that gender gaps are to some extent the product of local and time-specific contingencies, which call for case-by-case investigation. However, we argue that there is reason to continue the search for additional general explanations, which we do in this study. We take as our starting point two – average – differences between men and women that have been reported repeatedly in the literature. A first difference, predicted by gender socialization theory, is that women are generally socialized into stronger feelings of connection to others than men, which makes men less concerned about social harmony than women.Footnote 9 The second – albeit somewhat related – difference is that men have been found to be less sensitive to social cues than women.Footnote 10 On the basis of these two differences between men and women – the importance of social harmony and social cues – we expect that stigmatized, smaller and extreme parties are likely to attract more male than female voters. Our explanation thus focuses in particular on a (sizeable) subset of parties with a systematic over-representation of male supporters. As we demonstrate below, previous theories have not provided convincing explanations for the gender balance in support for these parties.
Our hypotheses are tested on Comparative Study of Electoral Systems (CSES) data about the electorates of 340 party-year combinations in twenty-eight countries in elections held between 1996 and 2011, based on cross-level interactions between gender (at the individual level) and party characteristics (at the party level). We show that, even when controlling for ideology and socio-economic background characteristics, parties with a social stigma – that is, those that are disliked by large majorities of the public – indeed attract systematically more male than female voters. This is in line with the literature on social cues. We find confirmation of this mechanism in a follow-up study, which we conducted in Sweden – a society that is arguably the least likely to show gender differences in vote choices based on gendered responsiveness to social cues. Furthermore, in line with the social harmony expectation, we find that extreme parties attract more male voters. At the same time, we found no evidence for the hypothesis that women are generally more likely to vote for larger (and thus ‘socially endorsed’) parties.
In a last step, we estimate how well our models explain the gender gap in support for parties from different party families. We find that our models provide good explanations for the over-representation of men among – especially, but not only – the electorates of communist and radical right parties. We show that earlier explanations such as ideological distance or socio-economic background cannot account for these gaps. Nor can the variables proposed in this article explain the over-representation of women among the electorates of environmentalist parties, or the over-representation of men among farmers’ parties. We therefore argue that our proposed mechanism substantially improves our understanding of gender gaps in voting, but that research into this topic should continue.
In short, this study increases our understanding of the role of gender in shaping voting patterns,Footnote 11 as well as the way in which vote choices in general are influenced by the presence of social signals.Footnote 12 In addition to this theoretical contribution, we believe that our conclusions are also politically relevant. Given that gender can be seen as the ‘fault line of maximum political cleavage’,Footnote 13 even small differences in vote choices between men and women can determine the outcomes of elections.
THEORY AND HYPOTHESES
Existing research on the gender gap in voting has focused mainly on demand-side explanations: differences between men and women in their social positions and in their politically relevant attitudes.Footnote 14 It has also provided valuable insights in more specific factors contributing to gender gaps for specific party families.Footnote 15 Few studies have been able, however, to apply such general models to explain gender gaps in voting for a wide range of parties in various contexts. While acknowledging the importance of election-specific factors for the emergence of electoral gender imbalances, we aim to add an explanation that we think contributes universally and consistently to the gender gap.
Obviously, political choice making is a complex process, and the differences within each of the groups are much larger than the differences between men and women.Footnote 16 Hence, we would like to emphasize at the onset that we do not believe in any kind of stereotypical image of differences between the genders. When we argue that men have been found to be on average less responsive to social cues than women, and that men are less concerned about social harmony than women, we realize that this tells us little about individuals. Still, given that men and women have been found to differ on average on such characteristics, we argue that these help us explain the aggregate-level gender gaps in voting. Below, we hypothesize about how several party characteristics are expected to influence the gender gap. Because these party characteristics are correlated, we finish this section by discussing their interrelatedness.
In the rest of this section, we first propose two hypotheses that follow from reported differences in the extent to which men and women were found to be sensitive to social cues. We then propose our third hypothesis, which follows from differences between men and women in the importance they attach to social harmony. Finally, we briefly discuss how these explanations relate to existing explanations of parties’ gender gaps.
SOCIAL CUES
Men and women have repeatedly been shown to differ in the extent to which they are sensitive and responsive to signals from others.Footnote 17 For instance, in an experiment by Carlsson et al. about consumers’ preferences for ecological coffee, some respondents were provided with the information that many other people had bought this product.Footnote 18 Mentioning this fact did not raise the intention to purchase ecological coffee among men, while it did do so among women. In an extensive overview of experimental evidence in different settings, Croson and Gneezy conclude that ‘men’s decisions are less context-specific than women’s’.Footnote 19 On the basis of self-reported measures, Goldsmith et al. find that ‘women [have] higher scores on conformity than men’.Footnote 20 This is in line with classic research that has found men to be less likely to conform to majority opinionsFootnote 21 and less responsive to social cues in the environment compared to other stimuli.Footnote 22 Such findings lead us to expect that men are less likely to be influenced by social cues regarding parties.
Indeed, when it comes to voting, citizens have been found to be far from immune to social influences.Footnote 23 Fellow citizens’ evaluations of parties – communicated through polls, elections and everyday discussions, as well as more indirectly through media and ‘public opinion’ – provide a heuristic that constrains voters’ ‘choice set’ of parties. A party’s reputation, as expressed by fellow citizens, may influence voters’ choices through multiple mechanisms.Footnote 24 The first builds on fears of negative social evaluations: disclosing a favorable position toward a party that others deem unacceptable involves potential social costs. This obviously does not have to affect a private act such as voting. However, for many, social evaluations may function as a broader cue about a party. Wide disapproval of a party signals that this apparently is a party ‘one does not vote for’, and should thus be avoided. Voters will often abstain from developing favorable positions toward such suspicious parties in the first place. In other words, voters (particularly those who are sensitive to social cues) will tend to internalize these negative social evaluations. Since the evidence cited above shows that women are more sensitive to these cues than men, we expect a party that is considered socially unacceptable – or stigmatized – to attract relatively more male than female voters. We also expect the reverse to be true: a party that receives wide electoral support – and is thus broadly ‘endorsed’ – can be especially attractive to voters who are sensitive to social cues. Women can thus be expected to be slightly over-represented among the electorates of these parties.
On the basis of these considerations, we expect the gender balance among party supporters to be affected by their stigma and size. Goffman defines stigma as ‘an attribute that is deeply discrediting’.Footnote 25 He stresses that the characteristic responsible for the stigma is neither creditable nor discreditable in itself; rather, it is the reaction of others that ‘spoils’ the stigmatized person’s identity. As such, stigma is socially defined. While Goffman mainly refers to individuals, stigma can also be considered an attribute of entities such as parties. From a voter’s point of view, a party is stigmatized if a large proportion of his or her peers regard it as unacceptable.
Although the degree of stigma associated with a given party might vary between different subgroups in society, we argue that stigma is often constructed at the level of the polity. For example, many Radical Right parties are treated as political outcasts or ‘lepers’.Footnote 26 Some even face criminal prosecution and party bans for inciting racial hatred, or are provided a cordon sanitaire by other parties.Footnote 27 Therefore, there is likely to be a social taboo associated with some of these parties. The same may apply to parties of the Radical Left, as well as centrist parties that face scandals or corruption charges. We expect the presence of a stigma to function as a strong social heuristic for many voters. Stigmatizing by fellow citizens is dissuasive for many voters, male as well as female. Yet the evidence presented above leads us to expect stigma to have less of an influence on men, because men have been shown to be less sensitive than women to social cues. Stigmatized parties are thus expected to have relatively few female voters.
Hypothesis 1: Men are more likely than women to vote for stigmatized parties, ceteris paribus.
If the proposed mechanisms holds, we would also expect a reverse mechanism: parties that are widely endorsed should attract relatively more female than male voters, ceteris paribus. The reasoning behind this expectation is related to, but not the same as, the reasoning underlying the effect of stigma. Theoretically and empirically, most small parties are not necessarily stigmatized. While we expect stigma to be the stronger social cue, we hypothesize that a party’s electoral success also provides a heuristic for voters. While this outcome is not yet known at the time of an election, voters can estimate a party’s level of support through election polls and earlier electoral performance. If a large share of the electorate supports a party, this signals its acceptability. Apparently, such a party has managed to bring together a broad range of citizens, which is appealing to voters who are sensitive to ‘social consensus’ information (a term coined in the context of ‘viability’ heuristics).Footnote 28 However, a vote for a party that is hardly supported by other voters is unattractive to people who are sensitive to social cues. Again, we expect male voters to be less likely to be influenced by this cue than female voters.
Hypothesis 2: Men are more likely than women to vote for smaller parties, ceteris paribus.
We allow for the possibility that the effect of size is non-linear. When parties are ‘large enough’, additional growth might become less important for the image of social acceptability.
SOCIAL HARMONY
Our first two hypotheses are grounded in the often-reported differences between men and women in their sensitivity to social cues. We now turn to another, albeit related, difference between men and women, which follows from gender socialization theory. Women are generally socialized into stronger feelings of connection to others, as well as more communal behavior,Footnote 29 and more often define themselves in terms of relations to others.Footnote 30 Studies have also found (in twenty-five of the twenty-six cultures studied) gender differences in agreeableness, which reflects a general concern for social harmony.Footnote 31 This line of reasoning leads us to expect that a party’s extremity presents another heuristic in the decision-making process, which will affect the gender balance in a party’s support base. A political party can be considered extreme to the extent that it aims to fundamentally revise the societal and political system – for instance, by overturning class relations (extreme Left) or pitching against minorities (extreme Right). We argue that parties proposing such a disruption are inherently discordant in nature. Not only are their programs ideologically highly distinct from those of most other parties and voters, they also tend to contend that there are more or less incompatible cleavages between ethnic groups or economic classes. Obviously, such attitudes will deter voters who are concerned about social harmony. Since we know that this is, on average, of greater concern for women than for men, extreme parties will attract fewer female voters.
Relatedly, extreme parties have (historically) been connected to (verbal or physical) aggression. A certain amount of aggressive or revolutionary discourse is inherent to many parties that wish to profoundly change the status quo. So, even though most parties at the extreme right or extreme left reject the use of physical violence, their discourse is often quite aggressive. In the context of the gender gap in Radical Right voting, Cas Mudde made exactly this point when he noted that ‘men and women hold fairly similar views on all aspects of the populist radical right except extremism and violence, which are rejected far more by women than by men’.Footnote 32 Mayer and Sineau, too, argue that the ‘extreme image’ of France’s National Front deters female voters.Footnote 33 If this is true, we should observe a gap among extreme parties of both the Right and Left. After all, Extreme Left parties have also been associated with revolutionary language and political violence.Footnote 34
Hypothesis 3: Men are more likely than women to vote for extreme parties, ceteris paribus.
Relations between the Variables
In this study, we primarily focus on the main effects of these three party characteristics – particularly whether they exert a different effect on the likelihood of men and women to vote for a party. However, given that the three characteristics are likely to be related in various ways, we will also investigate mediation, spuriousness and moderation. With regard to mediation, we expect that extreme parties are more often stigmatized, and for that reason (even) more likely to draw relatively more male voters. However, it is also possible that any effect of stigma is spurious due to the fact that extreme parties would be more likely to be stigmatized. Furthermore, extreme parties are often rather small, so the effect of ‘extremity’ could also be due to party size. We therefore investigate whether the direct effects of stigma, size and extremity are also found in a multivariate model. Finally, interactions between the variables might also be present. While we refrain from formulating specific hypotheses regarding such interactions, we will investigate them after testing the direct and indirect effects.
Alternative Explanations?
As discussed earlier, this is not the first study to investigate why – in general – some parties are more popular among men, while others attract more women. To assess whether stigma, size and extremity make an independent and substantial contribution, we need to control for confounding factors as much as possible. The most important one is general ideological position. Research has shown that in most countries, women across the board are somewhat more to the Left of the political spectrum.Footnote 35 As discussed in more detail below, we control for this by means of respondents’ perceived ideological distance to a party on a Left–Right dimension. Any effect we find thus holds regardless of men’s and women’s Left–Right positions.
Gender differences regarding more concrete issue positions might also be relevant for parties’ gender gaps. A special case in this respect is the Far Right, which has outspoken views on immigration and law and order, as well as a sizeable gender gap. Crucially, such parties are also among the most ideologically extreme and stigmatized. To the extent that men agree more often with nativist and authoritarian policies, this might potentially confound any relationship we find. Unfortunately, no data on the issue positions of parties and voters are available that can be compared across all 340 party × year combinations. For two reasons, we do not think this poses a threat to the validity of our findings. First, research on the gender gap for the Far Right consistently shows that gender differences in nativism and authoritarianism are minor or absent, and do not explain the Radical Right’s gender gap.Footnote 36 Moreover, there are many stigmatized and extremist parties in our dataset that do not have a strong nativist position, such as communist parties (extremist and often stigmatized) or the Italian Christian Democratic Party in 1994 (stigmatized). So, if it were possible to measure parties’ positions on these kinds of issues, the relationship with these issue positions and social stigma is bound to be very weak.
Secondly, party political conflicts tend to become integrated in an overarching ‘Left–Right dimension’,Footnote 37 debates on various ‘new issues’ such as environmentalism and gender equality have become absorbed in ‘Left–Right semantics’,Footnote 38 and electoral research has repeatedly demonstrated that Left–Right distances capture many voter concerns on the most salient issues.Footnote 39 So, many issue positions are to some extent captured by controlling for Left–Right distances.
Still, to rule out these and other potential alternative explanations, we (1) test the extent to which the effects hold for left-wing and right-wing parties separately, as well as for several individual party families; (2) control for a range of background characteristics (as well as, as noted above, respondents’ Left–Right position) and (3) conduct an additional test based on survey data from Sweden in which we assess the impact of a core variable – social stigma – separately and in more detail.
Data, Research Design and Operationalization
To test our hypotheses, we employ CSES modules 1, 2 and 3, which were collected in 1996–2001, 2001–2004 and 2006–2011, respectively, during post-election surveys in dozens of countries.Footnote 40 Because gender identities are largely the product of socialization, we acknowledge that their role differs between cultural contexts. We therefore limit our analyses to the sphere of ‘Western’ countries, which is the source of the research on gender differences cited above. This selection also ensures that the left–right scale, which forms the basis of one of our predictors and also functions as a control variable, is meaningful.Footnote 41 Furthermore, we only include countries that are considered ‘free’ according to the Freedom House categorization. Finally, to ensure a focus on parties rather than candidates, we restrict the analyses to parliamentary rather than presidential elections. On the basis of this selection, we are able to investigate the gender gap in twenty-eight countries.Footnote 42 The data cover sixty-five elections and represent the views of 86,811 respondents. Descriptive statistics of the core variables, as well as an overview of the voters’ support by party family (according to the CSES classification) in each country can be found in Appendix A.
Because of the nature of our data, a conditional logit regression is not a feasible way to model respondents’ vote choices. In a conditional logit model, one models the likelihood of supporting a specific party vis-à-vis another party (which would be the base category). However, since the dependent variable is a different nominal variable in each election and country, we would have a different ‘base category’ in each country. As a consequence, the parameters would not be comparable across countries. Therefore, we will employ a different research design.
In this design, the ‘voter–party dyad’ – that is, voters’ evaluations of each individual party – is the unit of analysis. We then use logistic regressions to model whether the respondent voted for each individual party. To test the hypotheses, we investigate cross-level interaction effects between gender and party characteristics. This is the most thorough test of our hypotheses, because it allows us to control for individual-level characteristics that may be correlated with gender. To test the robustness of our findings, we also investigate (aggregated) data at the party level. This allows us to assess the macro-level outcome of these individual-level processes: which types of parties are dominated more by male and which by female voters? This party-level analysis is presented in Appendix D and briefly discussed in the Robustness section.
We transpose the dataset to a long format to create voter–party dyads (n=392,906). These dyads are modeled as nested in respondents, who are in turn nested in party–election dyads. We use logistic regressions with the vote choice for each individual party (0=‘did not vote for the party’, 1=‘voted for the party’) as the dependent variable. To test our three hypotheses, we estimate the interaction effects between a gender dummy (0=female, 1=male) and the party characteristics. The observations are nested in respondents and party–election dyads, with a random intercept.
Since we aim to assess the extent to which our proposed theories can explain parts of the gender gap that persist after taking into account factors proposed by earlier research, we need a well-specified model. Socio-economic control variables in the individual-level analysis are income (measured in quintiles) and a high level of education (defined as higher than secondary education). To take men’s and women’s ideological positions into account, we control for the ideological distance between the respondent and the party (calculated as the absolute distance between the position of the respondent and that of the party on a 0 to 10 left–right scale). Including the latter variable means that any effect we find holds regardless of men’s and women’s appreciation of a party’s ideology. Unfortunately, no indicator of religiosity was available in several countries, so we did not include this control variable in our main models. However, we briefly investigate its role in the last section.
While left–right distance can be expected to be negatively related to a vote for all parties, the effect of income and education is obviously alternative specific. For instance, higher education is associated with a higher probability to vote for some parties, but a lower probability to vote for others. So, for each combination of parties and years (n=340), two interaction effects would need to be included (one for each alternative-specific control variable). Since the inclusion of 680 interaction variables yields estimation problems, we employ an approach suggested by Van der Eijk et al.Footnote 43 that involves three steps. First, the vote for each party is regressed on the control variables by means of linear regression. Secondly, the predicted values are saved and centered around their means. These ‘centered y hats’ are simply linear transformations of the independent variables. The values reflect the extent to which respondents are predicted to be more or less likely to vote for a party on the basis of the control variables. In the third step, these values are included in the long (or stacked) dataset and used as a control variable in the analyses.Footnote 44
In roughly 20 per cent of the party–voter dyads, the respondent did not locate the party on a left–right scale. In these cases, we calculate the distance to the interpolated median placement of the party by the rest of the respondents. Where there are missing values for the other control variables, we use the mean score of these variables within that country (and year). As a robustness check, we replicated the main models using list-wise deletion. This resulted in highly similar conclusions in terms of significance, effect size and coefficient size.
Operationalization of Party Characteristics
Parties’ social stigma is measured by the proportion of voters that ‘strongly dislikes’ the party (a score of 0 on an eleven-point like/dislike scale, which ranges from 0 to 10). While assigning a low score (such as 2 or 3) indicates a party’s low likeability, we argue that the extreme low point (0) points to an aversion that is qualitatively different from mere non-support. While a lack of support will indeed result in a low average score on the like/dislike measure, this does not automatically result in a large number of extreme ‘strongly dislike’ responses. In fact, the correlation (at the party level) between party size and social stigma is –0.31, meaning that the two variables share only 9 per cent of their variance (see Appendix F). The relationship between social stigma and extremity is also rather weak (0.39, or a 15 per cent shared variance). A more detailed look at some of the parties explains why this is the case. There are several examples of ‘extremist parties’ that have been described in the literature as being stigmatized, for which more than half of the respondents provided the lowest score on the like/dislike scale, such as the National Front in France and the Communist Refoundation Party in Italy. However, some Radical Right parties that are seen as ‘extreme’ are not stigmatized to the same extent, especially those that were founded on a platform other than anti-immigration.Footnote 45 This group includes the True Finns (10 per cent extreme dislikes) and the Progress Party in Norway (13 per cent). Furthermore, non-extreme parties can also score high on social stigma, such as Italy’s scandal-ridden Christian Democrats (49 per cent). While it is obvious that stigmatized parties generally have fewer voters, it does not inherently follow that stigma would affect the gender balance. This would only be the case if there were a strong gender bias in the proportion of people that strongly disliked a party. For instance, if a disproportionate part of those who ‘extremely dislike’ a party is female, and they would therefore (obviously) not support this party, our reasoning could be circular. To ascertain that this is not the case, we will – as a robustness check – also test our models by measuring social stigma on the basis of male respondents only, and on the basis of female respondents only (see Appendix H). Furthermore, to make sure our stigma measure does not pick up a mere lack of popularity, we will also estimate full models in which parties’ size – the most direct measure of popularity – is included.
To measure parties’ extremity, we also rely on voters’ placement of parties on a left–right scale if only the extremes are labeled ‘Left’ (at 0) and ‘Right’ (at 10). We rely on this ‘wisdom of the crowds’ because aggregated placement by voters has been shown to provide valid measurements of party positions.Footnote 46 Furthermore, our arguments focus on parties’ extreme images, which can best be captured by asking the voters themselves. We use the interpolated median rather than the mean placement to reduce the sensitivity of the measurement to respondents with outlying perceptions of the parties.Footnote 47 We consider a party to be more extreme to the extent that it is located further away from the middle of the scale (5). Capturing both left- and right-wing extremism, our extremity measure consists of the absolute difference between 5 and the interpolated median.
Party size is measured by the fraction of the respondents that voted for a party. While this information is not available at the time of voting, it could be argued that voters are aware, through a combination of earlier elections and polls, which parties are likely to be well supported and which are not. An alternative operationalization would be to use parties’ share of the votes at the previous election. However, much can change between elections. More importantly, this measure is not available for the new parties in the data, or for many parties formed by mergers of (or split-offs from) existing parties, or for parties that changed their name. Moreover, voters’ perceptions will most likely combine information of past performance and current polls, and because the CSES data were collected around elections, the latter will usually be readily available.
We show some descriptive statistics of party characteristics in Appendix A and report their distributions (and pairwise correlations) in Appendix F.
We test our hypotheses in multiple steps. We first model the interactions between party characteristics and gender to assess whether the party characteristics discussed above affect men’s and women’s vote choices differently. Secondly, we investigate whether the conclusions hold in a multivariate analysis, controlling for the other party characteristics. Subsequently, we examine whether the party characteristics interact. Finally, we test whether these results can be replicated at the party level.
At this point it is important to point out that, even if our hypotheses hold, we do not expect very strong relationships. Many country- and election-specific factors contribute to the gender balance of parties’ electorates in individual elections, which cannot be captured by an analysis across sixty-five elections. Still, we argue that, precisely because the factors described above are difficult to isolate in individual cases, it is very important to search for trends underlying a large number of parties and elections, which we do in the next section.
RESULTS
We test our hypotheses by interacting the party-level characteristics with gender, controlling for left–right distance as well as socio-economic background. When examining size, for which we hypothesized the effects would be non-linear, we add a squared term for the party characteristic. As large tables with higher-level interactions are difficult to interpret, we present the results visually in Figures 1a to 1c. A significant interaction (p<0.05) between the party characteristic and the dummy for gender is indicated by an asterisk next to the figure title. In each figure, the y-axis represents the marginal effect of the male dummy. Positive values indicate that men are over-represented, and negative values that women are. If our hypotheses hold, we should find that women are over-represented at one side of the spectrum (for instance, among non-extreme parties) and men at the other (that is, extreme parties). The full regression tables are presented in Appendix B.

Fig. 1 a-c Interactions between gender and party characteristics Source: CSES
The figures provide ample evidence to support our hypotheses. Figure 1a shows that stigma affects men and women to different extents. Parties that score high on the stigma measure are male dominated, whereas non-stigmatized parties draw more female voters. Male voters thus seem less discouraged by stigma than female voters, as expected in Hypothesis 1. This interaction is significant and substantive: additional calculations show that for highly stigmatized parties, the predicted voting probability among men is more than 25 per cent higher than among women. Furthermore, an additional analysis in which stigma was operationalized by measuring it among male respondents only (see Appendix H) confirms this pattern. This demonstrates that the finding is not a mere artifact of endogeneity.
The second predictor of the gender gap, a party’s size, also has a significant interaction with gender (Figure 1b). Men are more likely to vote for smaller parties; larger parties are generally more popular among women. While male over-representation seems to apply to only a small range of the scale, it is important to note that more than a third of the parties obtained fewer than 10 per cent of the votes. Hypothesis 2 is thus also supported.
Figure 1c suggests that extremity, like stigma, serves as less of a deterrent to male than to female voters. Men are more likely to vote for parties that score high on the extremity measure; female voters dominate more centrist parties. The turning point is situated around an extremity score of 2, which reflects a position on the left–right scale either between 0 and 3 (Left) or between 7 and 10 (Right). So, even when controlling for left–right distances between voters and parties, men are more likely than women to support radical parties. An additional analysis shows that both the left and the right side of the spectrum demonstrate an effect of extremity. On the basis of these bivariate relationships, Hypothesis 3 is thus also supported.
We also further explored whether there were any interactions between the party-level variables and left–right distance, and whether there were third-level interactions between these interactions and gender. The theoretical idea is that if a party is ideologically very distant from a voter’s position, s/he will not vote for this party no matter what: it does not really matter whether it is socially stigmatized, small or large, moderate or extremist. Yet when a party is ideologically closer, these party characteristics become more important. These considerations would lead us to expect interactions between party characteristics and left–right distance. To the extent that interaction effects have a stronger impact on women than on men, the resulting gender gap could depend on one’s closeness to a party. However, since neither the two-way interactions nor the three-way interactions were statistically significant, we do not present the results here.Footnote 48
Full Model
So far, we have found evidence that men are over-represented in the electorates of stigmatized, extreme and smaller parties. Of course, these party characteristics are themselves related to each other. Most obviously, extreme parties are generally small and more likely to be stigmatized than center parties. We therefore turn to a full model that includes all party-level characteristics and their interactions with gender. The full table is very large and difficult to interpret. We therefore present it in Appendix B, and display the results visually in Figure 2. For each party characteristic, the figure shows the 95 per cent confidence intervals of the size of its interaction with gender, both with and without full controls for the other party characteristics. The party characteristics were standardized, which makes a comparison of the size of the interactions meaningful. A positive interaction indicates that the effect of a characteristic is more positive among men than women; a negative interaction indicates that the effect is more negative among men than women.Footnote 49

Fig. 2 Size of the interaction between gender and standardized party characteristics Source: CSES Note: in the case of size, the interaction with the squared term is insignificant and left out of the graph.
Figure 2 shows that, after controlling for the other party characteristics, stigma and extremity continue to interact with gender. The interaction with extremity is reduced substantially (and significantly) when controlling for the other characteristics. Additional analysis shows that this reduction is fully attributable to the inclusion of stigma. This means that the effect of extremity is strongly mediated by stigma: extreme parties are more often stigmatized, which is in turn less attractive to relatively many female voters. Extreme parties thus discourage female voters more strongly than men due to their extreme stance, but also due to the social undesirability of voting for an extreme party. In terms of effect size, social stigma remains the strongest factor interacting with gender. The effect of stigma is thus independent and not attributable to the extremity of many stigmatized parties. Finally, Figure 2 shows that in a full model, the effect of party size is somewhat reduced and now only significant at the 10 per cent level.
To ensure that our findings are not driven by patterns on the right-wing side of the political spectrum, we also estimated our models on the Left and Right separately (based on the interpolated median position to the Left or Right of the middle of the scale; for the results, see Appendix G). This estimation confirmed that social stigma has an effect on the gender balance for both sides of the political spectrum: if anything, its effect is slightly stronger on the Left than on the Right. The effect of party size is insignificant in both regressions, which fits the full model reported above. The effect of extremity is significant on the Right, but not on the Left. However, its effect was already borderline significant in the full model with all cases, so it is not surprising that it fails to achieve significance in a model with half as many cases. In total, we feel confident to uphold our conclusions above.
Finally, we test all three possible interactions between our predictors. We find that none of these interactions is statistically significant at the 5 or 10 per cent level (results presented in Appendix E).
The Mechanism behind Stigma
Our results have demonstrated that social stigma is the strongest predictor of the gender gap. We interpret it as evidence of a social cueing mechanism. However, stigma is measured indirectly, based on the aggregated views of respondents. We therefore designed survey questions to directly measure the perception of the extent to which a vote for various parties is socially acceptable (by friends and family, and in general)Footnote 50 and investigate its effect on voting. These questions were asked in a sample of 2,301 Swedish respondents as part of the Swedish Citizen Panel.Footnote 51 Because Sweden is probably the most gender-neutral society of our selection of countries, we believe it makes for a least-likely case to find effects of gendered social sensitivity on voting patterns. If we find evidence for our hypotheses in Sweden, it is likely that they also apply in countries with more traditional gender patterns. We asked the perceived acceptability question about ten Swedish parties, and subsequently asked which of these parties the respondents would vote for. While it is self-evident that the acceptability measure correlates positively with respondents’ vote choice, we are above all interested in its interaction with gender. If our hypothesized mechanism holds, we should observe that perceived acceptability is a stronger determinant of voting for a party among women than among men.
The details of this analysis are presented in Appendix C, and Figure 3 presents the main results. Acceptability ‘among friends and family’ and ‘in general’ are strongly but not perfectly correlated (r=0.68), suggesting that these two perceptions are distinct but often go together. The predicted probabilities of Figure 3 show that a party’s perceived acceptability ‘among friends and family’ is a stronger predictor of actual vote choices among women than among men (p=0.00). Apparently, perceived social cues originating in the local environment affect women’s vote choices more strongly than men’s. Among respondents who viewed a party as acceptable, no gender gap emerges at all. With regard to perceived acceptability among the general public, the effect is descriptively in the same direction, though significant only at the 10 per cent level (p=0.08). We therefore conclude that, even in the least-likely case of Sweden, differences in sensitivity to social cues seem to underlie gender gaps in vote choices. This strengthens our confidence in the internal validity of the conclusions of the cross-national analysis. It also shows that further research could benefit from investigating the gendered role of social cues in citizens’ intimate surroundings.
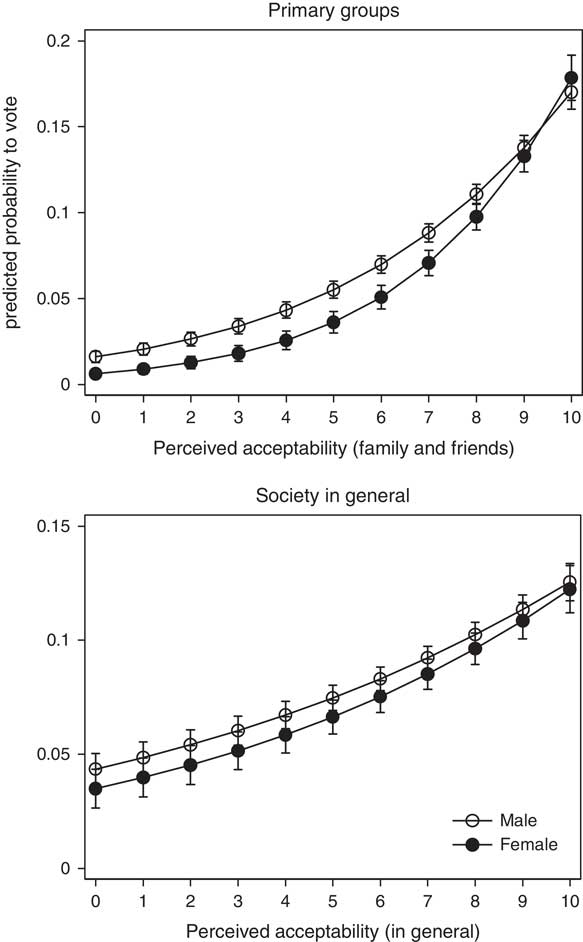
Fig. 3 Effects of perceived acceptability on voting for a party, among men and women
ROBUSTNESS CHECKS
Party Level
Our starting point was exploring why some parties have more male than female voters, and vice versa. In this section we therefore analyze whether the results are similar at the party (rather than the individual voter) level. The dependent variable in the party-level analysis is the share of male voters as a percentage of all voters for each party. Appendix D shows the full tables of these analyses, as well as more details on the methodology. The results are very similar to those at the individual level. Stigma and extremity have a significant effect on the gender balance: both are associated with an under-representation of women. Again, the effect of stigma on the gender balance is particularly strong. The third social cue indicator, party size, is also related to a female-dominated electorate, but not significantly so. Overall, the hypotheses based on gender differences in social cuing and in the importance of social harmony are supported, even though the influence of party size is not robust.
Looking at the party level also allows us to assess the relative explanatory power of our indicators. A party’s extremity explains roughly 2.5 per cent, whereas stigma explains almost 10 per cent of the variance in the gender balance of parties. While these percentages are not large, the explained variance of stigma is particularly impressive if considered in light of the variation due to country- and party-specific circumstances.
Influential Cases
To rule out the possibility that our results are biased due to overly high leverage of individual countries, we re-estimated the main individual-level model 30 times, each time leaving out a different country. All interactions between gender and party characteristics remained significant in all regressions, except for – again – party size (which was not significant in regressions without either Austria, Denmark or Finland). Again, we conclude that gender differences in the effects of stigma and extremity are robust.
IMPACT OF THE VARIABLES
Now that we have established that stigma – and, to a lesser extent, extremity – has a substantial, independent and robust effect, we conclude our investigation with a sketch of the relative weight of its impact compared to other factors that influence the gender gap for parties. Obviously, one can expect our variables to mostly explain the gender balance of consistently extreme and stigmatized party families, though they might provide some explanatory leverage for other party families too.
To determine how well we explain the gender gaps, we rely on a party family classification, by CSES experts, of a sizeable subsample of the parties in the CSES data.Footnote 52 Table 1 lists these party families in the first column. The second column describes the average size of the gender gap of parties that are members of these party families. The number shows the relative over-representation of men, expressed as the difference in percentage points from a 50 per cent balance. A gap of ‘5 per cent’ thus means 55 per cent men, 45 per cent women. The remaining size of the gender gaps for the same parties is then calculated using multivariate regressions on the party-level data after controlling for individual- or party-level characteristics. The average difference between these two estimates describes how well the gender gap for each party family is explained, expressed as a percentage reduction. In this way, it is possible to assess whether stigma, extremity and size explain less, more or just as much as classic ideological-demographic explanations of gender gaps.
Table 1 Analysis per Party Family

Note: the nominal gap shows the over-representation of men, expressed as the difference in percentage points from a 50 per cent balance. For instance, a 5 per cent gap for communist parties indicates that on average, 55 per cent of the voters are male and 45 per cent are female. Gray numbers indicate that the gap is not (or no longer) significant at the 10 per cent level. No explanation is provided for nominal gaps of 2 per cent or smaller due to unreliability of estimates.
Table 1 shows that the largest gender gaps can be found among ecological (green), communist, Radical Right and agrarian parties. The latter three are male dominated, while women are over-represented among the supporters of green parties. This is in line with the literature on the greens.Footnote 53 Socialist, social democratic and Christian democratic parties also attract more female voters. The table shows that the Radical Right is not the only party family experiencing a substantial gender gap, though it is the largest one for a party family of its size (compared to agrarian or communist parties); others are less universally and consistently present.
The next column shows the extent to which each gap can be explained by individual-level characteristics: left–right distance, self-perceived class, level of education and age.Footnote 54 It shows that such variables can account for a sizeable part of most gaps, but far from all of it. Much remains unexplained of the largest gaps, above all, of the gap in voting for communists and Christian democrats.Footnote 55
The remaining columns show how well the three party-level factors discussed in this article explain the gaps. They were calculated using the same method of calculating gaps and reductions, but this time on the basis of the party-level data. Social stigma explains about a third of the gap in voting for both communist and Radical Right parties. Extremity explains part of these gaps, too. In combination with size, the party-level variables explain 59 and 33 of the over-representation of men in the electorate of communist and Radical Right parties, respectively. That is remarkably sizeable, and larger than the explanation provided by a range of individual-level variables. Stigma and the other factors explain the gap in voting for other party families to a lesser extent, but their explanation is not restricted to communist and Radical Right parties. The explanatory power of stigma and extremity is thus non-trivial for several party families and very large for some. In addition, the three variables can still explain the gender balance of individual parties even when they do not do so at the aggregated gap level. This is especially likely for more heterogeneous party groups.
Still, a number of gaps remain unexplained with the proposed factors, or earlier explanations – especially the one related to voting for agrarian and green parties. Clearly, a different type of explanation – and further theorizing – is needed.
CONCLUSIONS
In this article, we aimed to broaden our understanding of the variation in the gender balance of parties’ electorates. So far, research has mostly provided explanations for individual parties and party families, or mapped very broad trends such as women’s general move toward the political left in industrialized countries. We propose a novel additional explanation that should apply to parties in different countries and account for variation between elections and within party families. We take as the starting point two findings in the literature on gender differences, and apply this to voting behavior. The finding that men are less likely to incorporate cues from their social context when making a decisionFootnote 56 leads us to hypothesize that they are more likely to vote for stigmatized and smaller parties. The finding that women assign more weight to social harmonyFootnote 57 leads us to expect that they are less likely to vote for extreme parties.
An analysis of 340 party-election combinations in twenty-eight countries provides strong evidence of a social cue mechanism. Even when controlling for ideological distance and background variables, the level of social stigma attached to a party deters female voters much more strongly than male ones. We find that the more other citizens strongly dislike a party, the smaller its relative share of female voters. The hypothesized mechanism behind these findings – that men are less likely to base their vote on social cues – is confirmed in a follow-up study in Sweden. This study showed that, even in this relatively gender-neutral society, perceptions of social acceptability are a stronger predictor of women’s vote choices than men’s. The explanatory power of social stigma reminds us that a vote choice is part of a social process. This has consequences for our models of vote choice, which are often modeled as if they take place in isolation.
We also find some evidence that smaller parties are less attractive to female voters, although this result is less robust. Future research with more fine-grained measures would be valuable to test stigma’s ‘other side of the same coin’: the extent to which an inclusive image strengthens a party’s relative appeal among women. Furthermore, and in line with the social harmony mechanism, we find that extreme parties – both of the left and the right – draw more male voters than moderate parties do, also when controlling for voters’ left–right positions. At the same time, this effect is largely moderated by the stigma of these extreme parties. The explanation for the relatively low attractiveness of extreme parties for women is thus partly the low social desirability of an extreme vote – a social fact. This conclusion is in line with existing evidence that gender differences in authoritarian and xenophobic attitudes cannot account for the gender gap in Radical Right voting.Footnote 58
These findings have implications for future research. Gender gaps in parties’ electorates are usually explained as a function of differences in the economic positions and gender roles of men and women, and the way these influence politically relevant interests and attitudes. Most importantly, women’s ‘disposition’ toward issues such as health care and welfare policies, contrasted with an alleged male focus on economy and justice, has acquired center stage in theories of gender gaps for individual parties. While this remains an important avenue of research, our study shows that we can gain further insight into electoral processes by moving beyond (or before) ideology by approaching vote choices from a socio-psychological angle. Our analyses show that, even across a very broad sample of over a hundred parties in dozens of countries, parties’ stigma and extremity can predict a sizeable part of the variance in the gender balance of their voters.
Yet we should acknowledge that our very general models by no means explain all of the variance in men’s and women’s vote choices. This suggests that other mechanisms – as well as party- and country-specific factors – may shape the gender balance. While we have theoretical reasons to believe that gendered responses to social cues and social harmony underlie the observed patterns, our data do not allow us to fully test these mechanism at the individual level. We therefore hope to inspire further research into the social aspects of voting.
Nevertheless, our theoretical mechanisms leave gaps for various types of parties unexplained. The mere absence of stigma, or the lack of a prejudiced reputation, can only to a limited extent explain why, for example, green parties attract so many more female voters. Future research could focus on investigating whether and how ‘Frauenparteien’Footnote 59 share an outlook and conduct that is alluring to preferences for social harmony, as opposed to endorsing social hierarchies.Footnote 60
Still, we believe our study makes an important contribution to our understanding of voting by proposing new mechanisms and showing their relevance for voters. Conceivably, sensitivity to social cues and social harmony is also associated with class, age, cultural background and many other characteristics related to voting. As a result, it is likely to shape parties’ electorates in other ways.


