

One of the greatest questions in the social sciences is the origins of and variation in the strength of nationalism, which itself is predicated on the twin notions that people identify with a collective group known as a nation, and that this nation should have a state of its own. While the latter of these two ideas, which can be characterized as the ideology of nationalism, has received a lot of attention within various disciplines, less attention has been paid to the former idea about national identification, especially people’s decisions to identify with the nation versus a sub-national or ethnic identity. Indeed, the empirical literature on this topic has been quite slim, in part because large-scale survey data that asked individuals to choose between their ethnic and national identities has only been collected in recent years. More specifically, in large cross-national surveys this question has only been asked to respondents in the Afrobarometer project in Africa and the World Values Survey more widely, with researchers finding various individual-, regional- and country-level correlates of national identification, such as education and income at the individual level and GDP/capita at the regional and country levels.Footnote 1 The literature also suggests that the size of one’s ethnic group has either a positiveFootnote 2 or negativeFootnote 3 relationship with national identification, and that there is a positive relationship between national identification and whether or not an ethnic group was partitioned by a colonial power.Footnote 4
However, an ethnic group’s relationship with the nation-state may depend on more than its size and the degree of colonial partition. The literature on nationalism has long discussed the fact that some ethnic groups have historically constituted the core ethnic group of the state, such that they have been termed a Staatsvolk or state-people by various authors.Footnote 5 In countries such as Denmark, France, the Netherlands, Spain, Sweden and the UK in Europe and Cambodia, China, Korea, Thailand, Vietnam and Japan in East Asia, members of the ethnic core historically controlled the state and redefined their ethnic group as the new national community in the modern era, thereby encouraging everyone in peripheral groups to assimilate into the nation.Footnote 6 The classic example of this process took place in France as documented extensively by Eugen Weber,Footnote 7 who showed how economic growth, the extension of public services and military conscription all led to the incorporation of ethno-linguistic minorities into the French nation during the nineteenth and early twentieth centuries. There is of course debate in all of these cases about the degree to which this process involved incorporating peripheral groups into a pre-existing group or accommodating minority ethnic cultures within a new national community,Footnote 8 but there is general consensus that the ethnic core has had main elements of its culture redefined as the cultural components of the new nation.
I examine the relationship between membership in the ethnic core and national identification. I argue that this relationship is determined by whether or not the ethnic core controls the state, as proxied by the ethnic identity of the president or head of government, such that ethnic cores in power will tend to identify more with the nation while those out of power identify more with their ethnic group. I use evidence from sub-Saharan Africa (henceforth Africa) because, unlike most of the rest of the world, the relatively small average size of core ethnic groups means that there is sufficient variation in the degree to which they hold power. Indeed, whereas throughout Europe, North America and East Asia it is very unusual for ethnic cores to not hold power, in Africa it is quite common since they rarely comprise a majority of the population.Footnote 9
I use two methodological approaches to provide evidence for my argument. First, I provide a detailed examination of the case of the Buganda core ethnic group within Uganda, which shows how being out of power can lead to disillusionment with the nation and even calls for secession among members of the core group. Secondly, I use data on twenty-two African countries from round five of the Afrobarometer project, whereby thirteen ethnic cores were in power and nine were out of power at the time of the survey. I use multi-level hierarchical modelling to show that members of ethnic cores in states where the core is in power are more likely to identify with the nation than with their ethnic group, but that this relationship is reversed when the core is out of power. I show that this result is robust to controlling for a wide variety of individual-, ethnic group- and country-level controls, the use of sub-samples and the use of a smaller sample of countries from round four of the Afrobarometer project. Finally, I utilize multiple rounds of the Afrobarometer project to create a panel and show that having an ethnic core in power increases the percentage of people that identifies with the nation by 12 per cent on average, thereby cancelling out the average negative effect of British colonialism on national identification.
The rest of the article is organized as follows. In the next section I describe the ethnic cores in Africa, as measured by the location of capital cities, the cores’ political dominance and their history of assimilating ethnic minorities when in power. I then develop my hypothesis about how state power is the crucial determinant of whether or not members of ethnic cores will identify more with the nation or their ethnic group. Next I discuss the case study of the Baganda in Uganda, and examine the quantitative results using data from the Afrobarometer project. The final section concludes.
ETHNIC CORES AND NATIONAL IDENTITY IN AFRICA
Ethnic cores have been identified in Europe, East Asia and the settler colonies of North America and Oceania without a similar discussion of their existence in the post-colonial world, especially sub-Saharan Africa. Certainly much of the reason why scholars of nationalism like Anthony Smith have explicitly denied the existence of ethnic cores in Africa revolves around the fact that many of the cultural trappings of modern national identities, specifically language and religion, derive in the post-colonial world not from the ethnic core but rather from the former colonial ruler.Footnote 10 Indeed, due to colonialism a majority of countries in Africa have Christianity as the majority religion while a majority continue to use the colonial lingua franca as their official language.Footnote 11 Similarly, for many countries in Europe and East Asia the ethnic core held political power and expanded its control over neighbouring territories, the populations of which it assimilated over time; in contrast, the borders of African states derive from colonial decisions taken by Europeans in the late nineteenth and early twentieth centuries.Footnote 12
Yet if we define ethnic cores as merely the core communities around which modern national identities are constructed, then there is strong evidence that ethnic cores do exist in Africa in the same way they do elsewhere. Ethnic cores exist in Africa in the context of three characteristics, each leading from the previous one: the placement of the national capital, the core’s political dominance, and a history of assimilation into – and out of – the dominant core group. I examine each of these in turn.
First, the location of capital cities around the world usually indicates the existence of ethnic cores, especially where they are far from the state’s geographic centre. London, Paris and Stockholm were all capitals of the geographical homelands of ethnic coresFootnote 13 that, upon the geographic and demographic expansion of the ethnic core into the modern nation-state, continued to be capital cities despite their distance from the geographical centroid of the new state. In the same way, European colonizers chose the capital cities of Burkina Faso (Ouagadougou), Madagascar (Antananarivo) and Uganda (Kampala) despite the fact that the new colonies encompassed many additional ethnic groups. In other cases such as Nigeria (Lagos), Niger (Zinder), Tanzania (Bagamoyo and then Dar es Salaam) and Mozambique (Island of Mozambique), the colonialists initially chose capital cities in the homelands of the ethnic core groups which were then later moved closer to the centroid of the modern state.Footnote 14
Secondly, in part due to the location of the capital city in their geographic homelands, ethnic cores have dominated politics in modern nation-states, often disproportionately to their actual numbers. Examples abound: of the forty-five presidents of the United States, forty-four have been white and forty-four have been Protestant, despite the fact that whites and Protestants only comprised 64 per cent and 47 per cent of the population in the most recent US census, respectively. In many countries ethnic cores similarly dominate politics to the exclusion of ethnic minorities: in the UK, for example, only one prime minister out of seventy-five dating back to the early eighteenth century has been from Wales (David Lloyd George), despite the fact that the Welsh have comprised roughly 5–7 per cent of the total UK population over the past 200 years. Similarly, in Eastern Europe no ethnic minority has ever become the head of government in modern Bulgaria (although ethnic minorities comprise 10 per cent of the population) or Romania (also 10 per cent), or in post-Soviet Estonia (31 per cent), Lithuania (16 per cent) or Russia (19 per cent), among others. In East Asia there has never been an ethnic minority head of state in the modern history of Vietnam (14 per cent minority) or in modern China (8 per cent). In Africa there are several countries where ethnic cores are a minority of the population but have held the presidency for most of the post-independence period, specifically Cameroon (with the Beti-Pahuin as the ethnic core), Côte d’Ivoire (Akan), Malawi (Chewa), Mali (Bambara) and Senegal (Wolof). Indeed, in some of these cases the ethnic core has dominated the presidency despite their small numbers: in Guinea, for instance, the Mandinka or Malinke represent only 25 per cent of the population but have held the presidency for 34 out of 59 years since independence, while the Kikuyu in Kenya are only 20–22 per cent of the population but have held the presidency for 30 out of 54 years since independence.
Thirdly and finally, ethnic cores tend to be the largest ethnic groups in their respective countries, albeit with notable exceptions as noted below. As a result, some authors have merely assumed that the ethnic core is the largest ethnic group by definition,Footnote 15 thereby implicitly assuming that its size is exogenous to its status as the ethnic core. Yet there is a great deal of evidence of assimilation into ethnic cores around the world as members of minority groups decide to join the core group for better access to political, economic or social power. Indeed, one of the main reasons why ethnic cores tend to be the largest ethnic group in their respective countries is because of a long history of assimilating smaller ethnic groups, especially when they hold state power. Perhaps the most famous example again comes from France, where many Alsatians, Basques and Bretons re-identified as French in the century prior to World War I,Footnote 16 but other European examples of assimilation into the ethnic core include the Cornish of the UK, Laz of Turkey and Sorbs of Germany, among many others.Footnote 17 The same process has been quite common in Africa, where there is abundant evidence of minority assimilation into ethnic cores from the pre-colonial, colonial and post-colonial eras in Gambia,Footnote 18 Liberia,Footnote 19 Sudan,Footnote 20 TogoFootnote 21 and Zambia,Footnote 22 among other cases.
It is important to note that these African examples of assimilation all derive either from periods in which the ethnic core was in power at the national level or during the colonial era, when indirect rule policies generated strong incentives for Africans to assimilate into the dominant ethnic core in their region of residence. In contrast, when ethnic cores are not in power, formerly assimilated members have in many instances revived their older identities and thus ‘de-assimilated’, which can lead to resentment among members of the ethnic core who have seen their numbers diminish. This phenomenon was most obvious during the Soviet and post-Soviet periods, when various ethnic republics were created and governments altered policies favouring titular ethnic core groups, which had the effect of either promoting or discouraging assimilation.Footnote 23 In Africa a comparable example comes from Ethiopia, where the Amhara dominated the state for centuries under the Solomonic dynasty, leading to the imposition of the Amharic language and the Ethiopian Orthodox church as the state language and religion, respectively. As such, many Ethiopians from minority ethnic groups assimilated into the Amhara ethnic group over time in order to access power in the feudal hierarchy.Footnote 24 This situation, however, came to an end when rebel leader Meles Zenawi, from the minority Tigrayan ethnic group, took power in 1991 and subsequently allowed Eritrea to secede and created a system of ethnic federalism for the remaining provinces in Ethiopia that greatly diminished the incentives for identification as Amhara among formerly oppressed minority groups such as the Oromo. As a result the Amhara have experienced a noticeable demographic decline over the past quarter-century relative to other ethnic groups: while in the 1984 Ethiopian census they were 0.7 per cent smaller than the largest ethnic group in Ethiopia, the Oromo (28.3 per cent vs. 29.0 per cent), by the 1994 census they had become 2.0 per cent smaller than the Oromo and were 7.6 per cent smaller than the Oromo in the 2007 census.
ETHNIC CORES AND STATE POWER
The literature on ethnic cores and nationalism has generally focused on the history of how these cores expanded to encompass the modern nation to which they gave their name; little attention has been paid to exploring how ethnic cores have fared within these new modern nations.Footnote 25 Indeed, while modern nations may have taken on the name and many of the trappings of their ethnic cores, this does not mean that the ethnic cores have completely disappeared or become irrelevant. Instead, what arguably matters for members of these core groups is whether or not they hold power in the modern states. In the ‘older’ nation-states of Europe and East Asia, where the ethnic core has assimilated ethnic minorities over centuries, these ethnic cores tend to represent a clear demographic majority and thus usually hold power for long periods of time (as noted above).
However, when these ethnic cores are a minority of the population, their hold on power tends to be much more tenuous and sporadic. Losing state power is always traumatic for any group, but, due to their history of dominance, members of the ethnic core might have more to lose than other groups when they fall from power. A substantial literature on ethnic or regional favouritism in AfricaFootnote 26 and elsewhereFootnote 27 suggests that ethnic groups with a co-ethnic in power benefit from greater access to state resources than other ethnic groups, with the same logic applying to people who reside in the president’s home region. These privileges can, of course, be revoked once the co-ethnic or co-regional president loses power, and thus one proposed mechanism here would be that those who receive patronage resources from the state are more likely to identify with the nation.
However, there could be another, more psychological, potential mechanism at work here, which is built upon the idea that core ethnic groups that have a long history of controlling the state might come to consider themselves naturally deserving of their special status, which they would feel angry about losing. This sense of ownership of the state among members of the ethnic core and their unhappiness about giving up power fits in well with the two related concepts of loss aversion and the endowment effect from behavioural economics, which posit that individuals attach more importance to losing an object than they do to acquiring it, and place more value on maintaining their possessions than on acquiring something new, respectively.Footnote 28 Indeed, there is abundant evidence of bitterness among core groups that lose power and therefore turn to ethnic and often xenophobic nationalism as a result. For instance, in the United States the election of Barack Obama led to resentment among many white Americans about their perceived lost status, and fuelled the rise of the Tea Party movement and a revival of white nationalism more generally.Footnote 29 From Africa one clear example of this process involves the Akan of Côte d’Ivoire, who held the presidency from 1960 to 1999 and thereby not only reaped numerous political and economic privileges but began to develop myths of superiority over other ethnic groups in the country.Footnote 30 Thus when faced with political pressures from other ethnic groups to give up power in the 1990s, various Akan elites developed the xenophobic concept of ‘Ivoirité’ as a mechanism to ‘preserve the position of the Akan in the political arena’ (and more specifically to exclude the non-Akan politician Alassane Ouattara from power).Footnote 31
This evidence leads me to generate four related hypotheses regarding the relationship between the ethnic core and the nation. First, when the ethnic core is in power, its members should identify more with the nation than with their ethnic identity – that is, have a higher salience for their national identity over their ethnic identity – but when the core group is out of power, these members should instead identify more with their ethnic identity than the nation. Secondly, if the psychological mechanism is at work here, then there should be no relationship between national identification and either access to public resources or residence in the president’s home region as a proxy for access to patronage resources. Thirdly and relatedly, inasmuch as only members of the core group view themselves as synonymous with the nation, we should observe a positive relationship between national identification and being in power for members of the core ethnic group but not for other groups. Fourthly and finally, being out of power should have a larger effect on national identification for members of core groups than for the effect of being in power. To test these hypotheses and examine the causal mechanisms at work, I turn in the next section to case study evidence from Uganda and then to cross-national evidence from Africa.
CASE STUDY EVIDENCE FROM UGANDA
The Baganda, who are the largest ethnic group in Uganda but only comprise some 16–20 per cent of the country’s current total population, exemplify the complicated relationship between ethnic cores, national identity and the state. They are members of a kingdom that dates back 400–600 years, which originated when one prince broke away from the then-dominant Bunyoro-Kitara kingdom centred around the eastern shores of Lake Albert, and founded his own kingdom in a core geographical area on the northern shores of Lake Victoria. The Buganda kingdom grew in size and prominence over centuries, to the point where it conquered neighbouring peoples and assimilated them as members of Baganda clans and the Baganda ethnic group. For example, the inhabitants of the Buddu and Kooki regions on the western shores of Lake Victoria (north of what is now the Ugandan-Tanzanian border) were conquered in the nineteenth century and were fully incorporated as Baganda over the past 200 years.Footnote 32
When the British arrived in what is now Uganda in the 1870s and 1880s they first approached the kabaka (king) of Buganda, with whom they signed a treaty of agreement; thus the British established their colonial capital in Entebbe, close to the Buganda Kingdom capital city of Kampala, and named the new protectorate Uganda, after the Swahili word for Buganda. The British used Baganda agents to help conquer the rest of what was to become Uganda, who governed as administrators over various parts of Uganda until the British replaced them with local chiefs in the 1920s; moreover, the British implemented the Buganda kingdom’s multi-tiered system of local government across colonial Uganda. This strong influence of Buganda over the rest of the country led some historians to talk of Baganda ‘sub-imperialism’ over the rest of Uganda,Footnote 33 which itself led to anti-Buganda sentiments in non-Baganda areas that still persist. Nonetheless, the colonial period continued to be characterized by the assimilation of ethnic minorities into the Baganda ethnic group within Buganda, in particular some of the indigenous Banyoro inhabitants in northern Buganda as well as Banyarwanda immigrants from Rwanda.Footnote 34
In the 1950s members of the Baganda elite were at the forefront of the anti-colonial movement and established the first two nation-wide political parties in Uganda. The Baganda politician Benedicto Kiwanuka led one of these parties to victory in Uganda’s first popular election in 1961 and became the country’s first self-governing ruler in the run-up to independence, although he lost office in the following year’s election. Upon independence in 1962, Buganda became the only federal state in the country, with other kingdoms given quasi-federal status and the rest of the country ruled under a unitary system. When Uganda was declared a republic in 1963, Kabaka Mutesa II became the first president of Uganda, and Milton Obote, a Langi politician from northern Uganda, became prime minister. However, in response to accusations of criminal involvement in a gold-smuggling plot in 1966, Obote suspended the constitution, assumed the presidency and abolished all kingdoms in Uganda and their federal or semi-federal privileges. The Buganda kingdom government responded to this coup d’etat by effectively declaring independence from Uganda, to which Obote responded by storming the kingdom’s offices and forcing the kabaka into exile.
The country was then run by Obote and his successor Idi Amin, an army officer from the northern Kakwa ethnic group, until Amin was deposed in 1979. A series of three Baganda presidents then took office between 1979 and 1980, and Obote resumed the presidency in December 1980 before he was deposed by an army officer from northern Uganda in 1985. Yoweri Museveni, a member of the Banyankole ethnic group from western Uganda, led a rebel army to victory over the Ugandan army in a civil war and became president in 1986, gradually returning the country to a state of calm and stability after some twenty years of chaos and conflict. While popular in Buganda and elsewhere, Museveni nonetheless faced constant pressure to restore the Buganda kingdoms, which he finally agreed to in 1993 on the provision that it (and the other three restored kingdoms of Bunyoro, Busoga and Toro) would abstain from party politics and function as cultural institutions only.
Over the past thirty years Museveni has attempted to placate the Baganda by over-representing them in his cabinet,Footnote 35 including giving them the posts of vice-president and prime minister for most years since 1986. Despite these efforts there remains large-scale dissatisfaction in Buganda over Museveni’s continued stay in power and his failure to return full federal autonomy to Buganda (known in the Luganda language as ebyaffe, or ‘our things’), which led to deadly riots in 2009 as well as further clashes in 2010 after the site of the tombs of past kabakas in western Kampala burned down in an act of arson. In the former case the conflict originated in a rural area conquered by Buganda in the 1890s where residents had formerly identified as Baganda during colonial rule but had more recently declared themselves members of the Banyala ethnic group and had protested attempts by the Buganda kingdom government to claim sovereignty over the area. The Ugandan Government halted attempts by the kabaka to visit the Banyala homeland, thereby sparking off anti-Museveni riots in Kampala that left several dead and led the government to close the kingdom’s CBS radio station. The Banyala, along with other minority ethnic groups in Buganda formerly considered assimilated like the Baruli and the Bakooki,Footnote 36 have thus been able to assert a non-Baganda ethnic identity largely due to the lack of Baganda political control in Kampala.
Ultimately the source of the tension between Museveni and the Baganda lies in the fact that, except for a brief interregnum in 1979–80, the Baganda have now been out of power in Uganda for over fifty years despite their history as the country’s core ethnic group. The Buganda case study highlights the degree to which the causal chain goes from losing power to the declining salience of national identity rather than the other way around, given that the first and subsequent musings about secession from Uganda only started after the Baganda lost control over the presidency in 1966, and that this loss of power had less to do with Baganda commitment to the nation than it did with corruption allegations against Milton Obote. Indeed, the degree to which commitment among the Baganda to Ugandan national identity continues to be weaker than their commitment to their ethnic identity can be seen in a variety of ways, including various calls by numerous Baganda members of parliament for the kingdom to secede from Uganda in recent years,Footnote 37 as well as a stated desire by numerous expatriate Baganda to only play the Buganda national anthem (and not the Ugandan national anthem) at a conference for US resident Baganda in Boston in 2013.Footnote 38 Restoring Buganda’s federal status may dampen the region’s secessionist tendencies, or it may increase them, as has happened in Catalonia and Scotland in recent years. However, there is no doubt that the lack of a Baganda president is at the source of much of the ongoing tension between Buganda and the Ugandan Government.Footnote 39
DATA ANALYSIS
Dataset
I now turn to quantitative evidence from round five of the Afrobarometer survey data, which is the most recent round of the Afrobarometer project to have all of its data released to the public. The survey asked two related questions about ethnic and national identity between late 2011 and early 2013. In the first question it asked respondents about their ethnic identity; they could choose from a list of ethnic groups or refuse to answer, or answer ‘other’, ‘don’t know’, or that he/she only has a national identity and ‘doesn’t think of oneself in these terms’. This question was asked of respondents in all surveyed countries in this way except Cape Verde, Swaziland and the North African countries of Algeria, Egypt, Morocco, Sudan and Tunisia.Footnote 40
Those who gave an ethnic identity were then asked the following:
Let us suppose that you had to choose between being a [Botswanan/Kenyan/etc.] and being a [Respondent’s Ethnic Group]. Which of the following best expresses your feelings?
1=I feel only [Respondent’s ethnic group]
2=I feel more [Respondent’s ethnic group] than [Botswanan/Kenyan/etc.]
3=I feel equally [Botswanan/Kenyan/etc.] and [Respondent’s ethnic group]
4=I feel more [Botswanan/Kenyan/etc.] than [Respondent’s ethnic group]
5=I feel only [Botswanan/Kenyan/etc.]
This question, which is known as the Moreno question after the Spanish political scientist who pioneered its use, helps accurately assess the degree to which individuals identify with the nation over their ethnic identity. Indeed, previous attempts at analysing the strength of national identity have instead relied upon such questions as ‘how proud are you of [nationality]’,Footnote 41 which yields no information on how respondents’ rank their ethnic and national identities and thus are not suitable for testing my hypothesis. In Figure 1 I plot the percentage of respondents in each country that responded 4 (more national) or 5 (only national) to the Moreno question, not including the two outliers of Burundi and Tanzania (as discussed below).

Fig. 1. Proportion choosing national over ethnic identification by country. Source: Afrobarometer Data Round 5
Of the respondents who did not give a listed ethnic identity, in round three many identified with the ‘other’ category, most notably 44.2 per cent in Tanzania; in rounds four and five the addition of more ethnic categories from which respondents could choose brought these numbers down such that the percentage of ‘others’ across the entire dataset dropped from 4.2 per cent in round three to 1.3 per cent in round five, with a high of 13.8 per cent in Cameroon. The percentage of individuals that claimed they only had a national identity and did not think of themselves in ethnic terms was notable only in South Africa (8.3 per cent). Those who refused to answer the question or did not know their ethnic identity were in almost all cases negligible, at 0.2 per cent and 0.7 per cent, respectively.
Five countries are problematic in my analysis. In Ghana, the Afrobarometer gave respondents the option to identify as Akan rather than sub-groups of the Akan such as the Asante and Fante, which are identified as ethnic groups in other sources such as the Soviet Atlas Narodov Mira.Footnote 42 If they are considered a single group, then the Akan are certainly the largest ethnic group in the country and could be considered the ethnic core of Ghana. However, it is probably more accurate to consider the Fante as the ethnic core given their demographic dominance in the core areas of the nineteenth-century colonial state, especially the former colonial capital of Cape Coast and the subsequent/current capital of Accra. (In contrast, the capital city of the Asante region, Kumasi, remains a provincial city.) Due to the lack of any way to identify sub-Akan groups in the Afrobarometer survey data, I exclude Ghana from my analysis here,Footnote 43 although I do include it in my cross-country panel data results below.
In two other countries the core is either not represented in the Afrobarometer sample or there is no core ethnic group. In the former case the Americo-Liberian settlers clearly comprise a core ethnic group in Liberia as regards their association with the state and history of political dominance, just as black settlers did across the border in Sierra Leone. However, perhaps due in part to a late-twentieth century move towards assimilating into native ethnic groups after their catastrophic loss of power in 1980 – which itself fits into my broader theory about the relationship between state power and membership in ethnic cores – the Americo-Liberians are not represented in the Afrobarometer dataset. In the latter case there is no distinct core ethnic group in Lesotho because everyone is a member of the core Basotho group, and thus there is no variation to examine.
Finally, the use of the Dfbeta outlier test identified both Burundi and Tanzania as clear outliers,Footnote 44 which is not surprising in either case. Burundi has the highest average level of national identification for round five at 0.87, or 13 per cent higher than the next-highest country, Guinea; it also has the largest ethnic group as a percentage of the population and the lowest ethno-linguistic fractionalization (ELF) score of any country in the sample (Hutus, at 82.4 per cent, and 0.328, respectively). Along with Rwanda it is also unusual since it has ethnic groups that are much more akin to caste groups inasmuch as they are not territorial in nature,Footnote 45 a difference that has done much to induce unusually violent ethnic relations in both countries in the post-colonial era.
Tanzania has long been considered an outlier in the analysis of national identification in Africa, due to the fact that its relatively high levels of national identification cannot be explained by the same variables that explain variation elsewhere. Indeed, the qualitative literature on Tanzania has suggested various idiosyncratic factors explaining its cohesive sense of national identity, especially the personality of its former president, Julius Nyerere.Footnote 46 It is thus not surprising that Robinson identified Tanzania as a statistical outlier as regards country-level regressions of national identification on GDP per capita, ethnic diversity and British colonialism from round three of the Afrobarometer.Footnote 47
Thus I exclude Burundi, Ghana, Lesotho, Liberia and Tanzania from my analysis, although I can include both Ghana and Liberia in my cross-country panel data results below. The descriptive statistics for the dataset are listed in Table A1.3.
Analysis
To test my hypothesis that state power determines the degree to which ethnic core groups identify with the nation or their ethnic group, I use a multi-level hierarchical model with random intercepts estimated at the ethnic group and country levels. The use of this model, rather than an ordinary least squares (OLS) model with country-ethnic-group level fixed effects, allows me to control for unchanging country-level characteristics such as GDP per capita, ELF and British colonialism, which have previously been shown to be correlated with national identification.Footnote 48 The individual-level characteristics included in the model are age, age squared, geodesic distance from home region to the capital city (to capture the inability of African states to project their power to peripheral areas),Footnote 49 and dummy variables for education (where 0=those with no secondary schooling), gender, urban residence, full-time employment, Muslim identification (to account for a potentially decreased attachment to the nation among Muslims),Footnote 50 and radio ownership, TV ownership and access to the internet (with the last three variables controlling for Anderson’s hypothesis about the role of the media in promoting national identification).Footnote 51 Ethnic group variables include the percentage of the population (as computed from the Afrobarometer data),Footnote 52 and dummies for partitioned and culturally peripheral groups (as measured by speaking a language from a language family different from the ethnic core group). Finally, state-level controls include log of GDP per capita, ELF (as measured by Fearon)Footnote 53 and a dummy for British colonialism. Of these variables, the only ones that are consistently statistically significant in the eleven specifications reported below include gender (male) and log GDP per capita, both of which are always negative. The former result corresponds with previous findings from Robinson,Footnote 54 while the latter is the exact opposite of her findings (this result is discussed further below).
For my main independent variable I create a dummy variable capturing whether or not an ethnic group is a core ethnic group in a given country, and then split the sample into two groups of countries: one where the ethnic cores are in power, as determined by the ethnic identity of the president, and one where they are not.Footnote 55 (The coding for all ethnic cores and the presidents’ ethnic identities is detailed in Appendix two.) The sample yields thirteen countries with the ethnic core in power and nine where it is out of power. I list all twenty-two countries in Table 1, with data on each country’s ethnic core, the president’s ethnic group during the period of the survey (if different from the ethnic core), the largest ethnic group (if different from the ethnic core), and whether or not the country was included in Afrobarometer round four. If my hypothesis is correct, we should observe a positive and statistically significant correlation between ethnic core membership and national identification for countries in which the ethnic core is in power, and a negative and statistically significant correlation for countries in which the ethnic core is out of power. The basic models thus take the form:
 $$\eqalignno{ & Y_{{ijk}} \,{\equals}\,\beta _{{0jk}} {\plus}{\rm \beta }_{{1jk}} {\mib{W}} _{{{\mib{ijk}} }} {\plus}{\rm }{\epsilon}_{{ijk}} \cr & \beta _{{0jk}} \,{\equals}\,\gamma _{{00k}} {\plus}\gamma _{{01k}} Core Ethnic Group_{{0jk}} {\plus}{\rm }\gamma _{{02k}} {\mib{X}} _{{0{\mib{jk}} }} {\plus}r_{{0jk}} \cr & \gamma _{{00k}} \,{\equals}\,\theta _{{000}} {\plus}\theta _{{00k}} {\mib{Z}} _{{00{\mib{k}} }} {\plus}{\rm }u_{{00k}} $$
where Y ijk is the individual-level indicator of national over ethnic identification for individual i in ethnic group j in country k, with W ijk representing a vector of individual-level controls and ε ijk the individual-level error term. The second equation models the individual-level intercept as a function of country-ethnic group characteristics, including the key independent dummy variable  $\gamma _{{01k}} Core Ethnic Group_{{0jk}} $
, which captures whether or not ethnic group j is a core ethnic group in country k, as well as X 0jk, a vector of ethnic-group level controls, and r 0jk, the ethnic-group level error term. Finally, the third equation models the country-ethnic-group level intercept as a function of Z 00k, a vector of country-level controls, and u 00k, the country-level error term.
$\gamma _{{01k}} Core Ethnic Group_{{0jk}} $
, which captures whether or not ethnic group j is a core ethnic group in country k, as well as X 0jk, a vector of ethnic-group level controls, and r 0jk, the ethnic-group level error term. Finally, the third equation models the country-ethnic-group level intercept as a function of Z 00k, a vector of country-level controls, and u 00k, the country-level error term.
Table 1 Countries and Ethnic Cores included in Afrobarometer, Round 5

Note: Alesina et al. (Reference Alesina, Devleeshauwer, Easterly, Kurlat and Wacziarg2003) list the Temne (30 per cent) as the largest group in Sierra Leone over the Mende (29 per cent), but the Afrobarometer, Bruk (Reference Bruk1986) and Fearon (Reference Fearon2003) all list the Mende as the largest group.
Table 2 presents the initial results. Column 1 includes the entire dataset, where the coefficient on the core ethnic group is not statistically significant but membership in the same ethnic group as the president is positive and statistically significant. In Columns 2 and 3 I split the sample, first for countries in which the core group is in power and second for those in which they are out of power. As expected, the coefficient for the core ethnic group in Column 2 is positive, while the coefficient in Column 3 is negative, and in both cases they are statistically significant at the 5 per cent level. Moreover, the coefficient on the co-ethnic president variable is negative and not significant in Column 3.
Table 2 Ethnicity and National Identity, Main Results

Note: individual-level control variables include age, age squared, log of distance to capital city and dummies for education, gender, urban residence, Muslim, radio ownership, TV ownership, access to the internet and full-time employment. Ethnic-group level control variables include percentage of total population and dummies for partitioned and peripheral groups. State-level controls include log of GDP per capita, ELF and a dummy for former British colonies. Controls for public goods in Columns 6 and 7 include dummies representing access to electricity, piped water and a sewage system; proximity to a post office, school, police station and health clinic; and whether the nearby roads are paved. *p ≤ 0.1, ** p ≤ 0.05, *** p ≤ 0.01
It is possible that what I am actually capturing here is a demographic relationship between the largest ethnic group and the state, such that members of the largest ethnic group consider themselves to be the dominant group based on their numbers.Footnote 56 I therefore replace the core ethnic group dummy variable with a dummy capturing whether or not the respondent is a member of the largest ethnic group in the country, while splitting the sample into countries in which the largest ethnic group is either in power or not. This change means that two countries, Botswana and Guinea, shift from the left column (ethnic group in power) to the right column (ethnic group out of power). The result, as seen in Columns 4 and 5, is that the coefficient on the largest ethnic group dummy is not statistically significant in either column, and suggests that my results are not just driven by ethnic demography.
Finally, in Columns 6 and 7 I control for access to patronage resources, measured indirectly by whether or not an individual resides in the president’s home region, and directly by a variety of measures of access to public goods, such as access to electricity or a piped or sewage water system, whether there is a post office, school, police station or health clinic within walking distance of the respondent’s residence, and whether local roads in the area are paved or not. These controls allow me to test for the possibility that it is access to patronage resources that explains higher levels of national identification among core ethnic groups in power rather than the alternative psychological mechanism proposed above. Yet none of the coefficients on the co-regional President variable or the measures of access to public goods is consistently statistically significant across the two specifications, and the coefficient on the core ethnic group variable remains statistically significant.
The results in Table 2 confirm all four hypotheses mentioned above. First, the sign of the coefficient on the core ethnic group switches depending on whether the core group is in power. Secondly, the lack of any statistically significant relationship between national identification and either the co-regional President variable or the public goods variables suggests that access to patronage resources is not driving the greater sense of national identification among members of the core ethnic group when they are in power. Thirdly, the coefficient on the co-ethnic President variable is never statistically significant in Columns 3, 5 and 7, indicating that being in power does not necessarily promote greater national identification for non-core groups. Finally, the size of the core ethnic group coefficient is always larger in absolute magnitude when the groups are out of power, which indicates the degree to which being out of power has a stronger effect than being in power and provides additional support for the psychological mechanism.Footnote 57
In Table 3 I list two further robustness tests. First, in Columns 1 and 2 I change the dependent variable to the original five-point scale described above, with no changes in my results. (The results are also robust to using only national identification [answer #5 above] as a dependent variable, with results available from the author.) Secondly, in Columns 3 and 4 I add additional country-level controls to account for various characteristics that could have influenced inter-ethnic relations and national identification – historical slave exports, absolute latitude and geographical size – all of which have been shown elsewhere to be correlated with levels of ethnic fractionalization in Africa (which leads me to drop ELF as a control variable here).Footnote 58 I then also control for the length of colonial rule as well as the length of time since independence, both of which may be correlated with the degree to which intermarriage and state policies may have promoted both assimilation and/or nation building. None of these additional controls is consistently statistically significant across the two columns.
Table 3 Ethnicity and National Identity, Additional Results
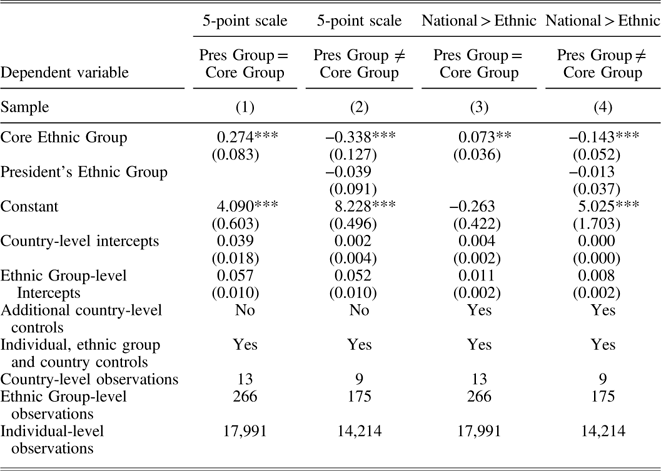
Note: individual-level control variables include age, age squared, log of distance to capital city and dummies for education, gender, urban residence, Muslim, radio ownership, TV ownership, access to the internet and full-time employment. Ethnic-group level control variables include percentage of total population and dummies for partitioned and peripheral groups. State-level controls include log of GDP per capita, ELF and a dummy for former British colonies. Additional country-level controls included in Columns 3 and 4 include log of slave exports, log of absolute latitude, log of geographical size in kilometers squared, log of the length of colonization in years and log of the number of years since independence. *p≤0.1, **p≤0.05, ***p≤0.01
Additional Empirical Results
For additional robustness I also examine a variety of sub-samples. As reported in Appendix Table A1.1, I first examine sub-samples that eliminate countries with notable Asian settler communities (Kenya, Mozambique, South Africa and Uganda) and countries with white settlers (Botswana, Kenya, Mauritius, Namibia, South Africa, Zambia and Zimbabwe), on the grounds that the dynamics of national identification might have been affected by the presence of non-African settlers. The results do not change in any of these sub-samples. In Table A1.2 I list the results at the individual country level; here I use pooled OLS with robust standard errors clustered at the ethnic group level inasmuch as multilevel models lose accuracy at their highest level when that number becomes too small and the highest level when running individual country regressions is the ethnic group level, which is the level at which the key core ethnic group variable is located.Footnote 59 In both cases the sign is correct for a majority of countries in the sample and statistically significant in a fair number as well. (However, the results should be taken with a large grain of salt, as the ethnic group clusters are small in number and highly unbalanced.)Footnote 60
Recent research suggests that public opinion surveys conducted in developing (non-Organisation for Economic Co-operation and Development) countries are at risk of significant amounts of duplication and thus could potentially yield biased and inaccurate results.Footnote 61 One way to tackle this problem here is to test my hypothesis using an alternative dataset, specifically data from the previous Afrobarometer round four. This round was conducted between 2008 and 2009 in twenty countries (all countries from round five except Cameroon, Cote d’Ivoire, Guinea, Mauritius, Niger, Sierra Leone and Togo). Using data from round four provides an excellent way to test the robustness of my main results, since this subset eliminates the two countries with the highest level of national identification in round five (Guinea and Niger), and includes three countries whose core ethnic group either lost power prior to round four (the Wolof of Senegal) or gained power (the Bambara in Mali and the Bemba in Zambia).Footnote 62 However, it is also less representative of sub-Saharan Africa as a whole since it, like round three, oversamples former British colonies.Footnote 63
Table 4 presents the results from round four, first for the core ethnic groups in Columns 1 and 2 and then again for the largest ethnic group per country in Columns 3 and 4. The results are almost identical to those from round five as regards the signs and size of the coefficient on the core ethnic group. The only notable difference from Table 3 is that the coefficient on the core ethnic group has lost a bit of statistical significance (p=0.061) in Column 2, while the coefficient on the president’s ethnic group is now positive and statistically significant in Columns 2 and 4 and the coefficient on the largest group is positive and statistically significant in Column 3, which in all cases may be a consequence of the smaller sample size.
Table 4 Ethnicity and National Identity, Afrobarometer Round 4

Note: individual-level control variables include age, age squared and dummies for education, gender, urban residence, Muslim, radio ownership, TV ownership and full-time employment. Ethnic-group level control variables include percentage of total population and dummies for partitioned and peripheral groups. State-level controls include log of GDP per capita, ELF and a dummy for former British colonies. *p≤0.1, **p≤0.05, ***p≤0.01
Country-Round Results
In my final set of results I turn to country-round observations, where I regress the average level of national identification per country-round on a dummy variable capturing whether or not the country’s core ethnic group was in power at the time along with a number of covariates and time dummies for each round. Here I use a pooled OLS model with clustered standard errors rather than a fixed-effects model, since the number of observations per country is small, there is very little within-country variation over time in the main independent variable due to the short time span involved, and doing so allows me to include time-invariant controls such as a former British colony dummy.Footnote 64 By estimating the results by country-round I can now include countries like Ghana and Liberia, which I had previously excluded due to either a lack of respondents identifying with the core ethnic group or problems in coding the core ethnic group, since here the key independent variable is simply whether or not the key ethnic group is in power. I can also include the Afrobarometer round six results which, at the time of writing, were available online at the country level only. (Round six includes exactly the same number of countries as round five.) In my analysis I add controls such as log GDP per capita, a former British colony dummy and each country’s ELF score, as well as round fixed effects.Footnote 65 I also include each country’s Polity2 score to account for the possibility that democratization could be correlated with the ethnic core’s hold on power in the majority of African countries in which the core group is not an absolute majority. The sample is, however, problematic in that the panel is unbalanced, with fourteen countries in round three, seventeen in round four and twenty-four in both rounds five and six. I thus create a perfectly balanced panel for rounds five and six with twenty-four countries, rounds four through six with seventeen countries and rounds three through six with fourteen countries as additional robustness checks.Footnote 66 The model thus takes the following form:
 $$\eqalign {Y_{{kt}} \,{\equals}\,\alpha _{{kt}} {\plus}{\rm \rbeta }_{1} Core Ethnic Group in Power_{{kt}} {\plus}{\rm \rbeta }_{2} GDPpc_{{kt}} {\plus}{\rm \rbeta }_{3} Polity_{{kt}} {\plus}{\rm \rbeta }_{4} ELF_{k} \cr \quad {\plus}{\rm \rbeta }_{5} British_{k} {\plus}{\rm \rbeta }_{{6t}} Round_{t} {\plus}{\rm }{\epsilon}_{{kt}} $$
where Y kt is the proportion of people identifying with the nation over the ethnic group in country k in round t,  $Core Ethnic Group in Power_{{kt}} $
is the core ethnic group in power dummy variable for country k at time t, GDPpc kt and Polity kt capture log GDP per capita and Polity2 scores for country k at time t, ELF k and British k are time-invariant variables measuring ELF and British colonialism, respectively, Round t is the round fixed-effects variable and ε kt is the error term.
$Core Ethnic Group in Power_{{kt}} $
is the core ethnic group in power dummy variable for country k at time t, GDPpc kt and Polity kt capture log GDP per capita and Polity2 scores for country k at time t, ELF k and British k are time-invariant variables measuring ELF and British colonialism, respectively, Round t is the round fixed-effects variable and ε kt is the error term.
In Table 5 I regress national identification on the core ethnic group in power variable along with the aforementioned covariates. Column 1 lists the main results, while Column 2 uses a balanced dataset from rounds five and six, Column 3 a balanced dataset from rounds four through six and Column 4 a balanced dataset from rounds three through six. The results clearly show that having a core ethnic group in power adds around 12 per cent, on average, to the percentage of people identifying with the nation over the ethnic group. In other words, across the four columns the core ethnic group dummy is almost identical to the former British colony dummy variable but with the opposite sign, which suggests that having a core ethnic group in power effectively cancels out the negative effect of British colonialism on national identification in sub-Saharan Africa. Moreover, none of the other covariates is consistently statistically significant at the 5 per cent level, including the log GDP per capita coefficient, which was negative and significant for the round five results listed above.Footnote 67
Table 5 Ethnicity and National Identity, Country-Level Panel Data

Note: robust standard errors are clustered at the country level. *p≤0.1, **p≤0.05, ***p≤0.01
CONCLUSION
In this article I examined the relationship between core or dominant ethnic groups and national identity, and argued that there should exist a positive relationship between ethnic cores and national identification when members of ethnic cores held power, and a negative one when they were out of power. I then used qualitative evidence from Uganda as well as quantitative evidence from the Afrobarometer project to show strong evidence for this hypothesis, as well as evidence that the mechanism is more psychological than anything to do with access to patronage resources. Finally, I used panel data from several rounds of the Afrobarometer to show that having an ethnic core in power added an average of 12 per cent to the number of people who identified with the nation rather than their ethnic group, thereby effectively cancelling out the negative effect of British colonialism on national identification.
There are several implications I can take from my analysis. First, my argument should not apply just to Africa but also other parts of the world where ethnic cores either come into power or fall out of power. I have already mentioned the rise of white nationalism in the United States as a result of the (perceived) loss of power of the white American ethnic core group; my results could also help to explain conflicts and violence that result from the loss of power of ethnic core groups in the Middle East, whether recently in such countries as Iraq (with Sunni Arabs as the core ethnic group) or in the future if and when the Gulf countries extend the franchise to the vast majority of their residents who are immigrants. One could even extend this analysis to issues around gender and politics, such that men might see themselves as the dominant political gender and, upon losing power, choose to retreat into sexism rather than promote gender-neutral policies.
Secondly, my analysis has important implications for African politics. Previous research has examined the various attempts by African leaders to pursue numerous kinds of nation-building policies, especially in attempts to downgrade ethnic identities in favour of national ones.Footnote 68 Yet one way to interpret my analysis is to suggest that such attempts are fruitless at incorporating the core ethnic group unless it holds executive power, which corresponds to Bandyopadhyay and Green’s findings that nation-building policies in modern Africa have had no real effect in preventing civil conflict.Footnote 69
Thirdly, further research could examine the degree to which the relationship between ethnic exclusion and conflict depends on whether the ethnic core is excluded from power. Indeed, in their ethnic-group level analysis of the origins of ethno-nationalist conflicts, Cederman, Wimmer and Min show not only that exclusion from power is a robust predictor of conflict but that group size and having lost power are as well.Footnote 70 The two latter variables clearly relate to ethnic cores inasmuch as they tend to be the largest group in the country and have a long history, at least in Africa, of losing power to other groups in countries where they are not the majority. In fact, one could even connect my argument to the correlation between a history of losing power and conflict for non-core ethnic groups, inasmuch as countries with dominant cores that do not consistently hold power allow minority groups to seize power sporadically for short periods of time. The Uganda case fits perfectly into this narrative: the origins of the Lord’s Resistance Army rebellion derive in large part from the Acholi loss of status after President Museveni defeated the then government of Tito Okello in 1986. If, however, the Baganda had remained politically dominant beyond 1966, it is possible that no Acholi president would have come to power and thus that there would have been no loss of status for the Acholi to channel into a rebellion.
Finally, I hope the results of this article will spur further research into the roles of ethnic cores in modern nations. Detailed analyses in the literature on the role of ethnic cores in the historical foundation of modern nations have not been met by a similar analysis of the role and place of ethnic cores in the contemporary world, whether in Africa or elsewhere. More qualitative and quantitative work could be done on this subject in the future.


