If people of opposing views can each find support for those views in the same body of evidence, it is small wonder that social science research […] will frequently fuel rather than calm the fires of debate.
– Lord et al. (Reference Lord, Ross and Lepper1979)
For several decades, research on public opinion and information processing has presented a challenge for believers in evidence-based decision making. Its prognosis for the body politic is dire: instead of prompting a reconsideration of long-held views, counter-attitudinal evidence may actually strengthen pre-existing beliefs, resulting in polarization. This prediction of backlash is associated with numerous theoretical perspectives and has led to an emerging consensus among scholars that attempts to persuade voters, challenge opponents or correct factual misperceptions can often result in the opposite of the intended effect.
According to this consensus, people work – consciously or not – to protect their worldviews via a series of complementary belief-preserving mechanisms (Kunda Reference Kunda1990). Examples include the prior attitude effect, the tendency to perceive evidence and arguments that support one’s views as stronger and more persuasive than those that challenge them; disconfirmation bias, in which people exert effort to counter-argue vigorously against evidence that is not congruent with their beliefs; and various forms of selective exposure and selective attention to congenial information, sometimes referred to as confirmation bias (Taber and Lodge Reference Taber and Lodge2006). The cumulative effect of these mechanisms is polarization. People exposed to the same information may respond by strengthening their pre-existing views.
The canonical explication and demonstration of these mechanisms appears in Lord et al. (Reference Lord, Ross and Lepper1979), in which both pro- and anti-death-penalty college students were exposed to mixed scientific evidence on the effectiveness of capital punishment on crime deterrence. To their surprise, the authors found that the subjects did not moderate their views; rather, those who initially supported the punishment reported becoming more pro-capital punishment, on average, by the end of the study, and those who opposed it reported becoming more opposed. This study helped inspire a research agenda spanning psychology (Kuhn and Lao Reference Kuhn and Lao1996; Miller et al. Reference Miller1993), political science (Lau and Redlawsk Reference Lau and Redlawsk2006; Nyhan and Reifler Reference Nyhan and Reifler2010; Redlawsk Reference Redlawsk2002; Taber and Lodge Reference Taber and Lodge2006; Taber et al. Reference Taber, Cann and Kucsova2009), and other fields such as public health (Nyhan et al. Reference Nyhan2014; Strickland et al. Reference Strickland, Taber and Lodge2011). Backlash is frequently invoked in this literature, but how prevalent is it?
Expectations of Backlash
In the study of voter behavior, Lazarsfeld et al. (Reference Lazarsfeld, Berelson and Gaudet1944) were among the first to mention backlash effects; they observed ‘several boomerangs upon people who resented what they read or heard and moved in the opposite direction from that intended’ (p. 154). The authors note this in passing while explaining the reasons why personal contact may be more effective – and less likely to produce such ‘boomerangs’ – than media messages.
Since then, a number of distinct theories have accommodated the possibility of backlash during the opinion formation process. John Zaller’s Receive-Accept-Sample (RAS) model (Reference Zaller1992) treats opinions as generally stable. Depending on both individuals’ level of political awareness and the partisan mix of elite communications, people will exhibit varying levels of receptivity to new information. Those least likely to be swayed one way or another are people with low awareness (who are not likely to be exposed to political messages at all) or high awareness (who possess sufficient knowledge and sophistication about political issues to successfully avoid or resist contrary messages). Only those in between have the opportunity to both receive and accept new political messages, the balance of which will depend on the level of elite consensus. When confronted with information about an issue, people then sample from the ‘top of the head’ considerations they have accumulated over time.
Under the RAS model, new information is assimilated only under certain conditions, and even then is brought to conscious awareness only when required by a survey response or interpersonal context. When new information can be absorbed, the predicted result is attitude change in the direction of the overall balance of arguments made by elite political actors. The model is generally compatible with growing extremity in attitudes over time, particularly among high-awareness individuals who only seek out information that reinforces their existing considerations. It is also consistent with limited predictions of backlash. In a survey context, confrontation with challenging information may cause highly informed individuals to bring counterarguments to mind, creating a mix of considerations more hostile to that perspective (for example, Kuklinski et al. Reference Kuklinski2001; Lord et al. Reference Lord, Ross and Lepper1979).
In contrast to Zaller’s memory-based approach, Lodge and Taber’s John Q. Public (JQP) model (2006; Reference Lodge and Taber2013) explains political evaluations as the result of motivated reasoning driven largely by unconscious processes. People make snap, emotion-laden judgments of political stimuli on the basis of affective tallies stored in memory. These tallies are in turn determined by primes and other subliminal cues accompanying the issues, candidates or groups under consideration. Conscious processing of political information is thus little more than the rationalization of the associated attitudes that elude our awareness. The JQP model predicts backlash if evidence that challenges one’s political views triggers ‘hot cognitions’ about related topics, which in turn motivate a search (in memory or elsewhere) for confirmatory information (Redlawsk Reference Redlawsk2002).
More recently, Kahan (Reference Kahan2012) has applied the Theory of Cultural Cognition to public perceptions of risk on issues such as climate change. This perspective suggests, for example, that endorsing factual positions that are at odds with scientific consensus can be ‘expressively rational’ in the sense that it reinforces one’s membership in a cultural or ideological group. Such identity-protective cognition can be either conscious or unconscious, and it could lead to predictions of backlash via mechanisms similar to JQP.
A final perspective derives from the Bayesian Learning Model. This model provides a simple, mathematically coherent mechanism, via Bayes’ rule, for updating one’s prior beliefs in light of new evidence. The model’s predictions are subtle, leading to occasional disagreements about the expected pattern of evidence under various conditions. For example, whether ‘unbiased’ Bayesian learning implies convergence or parallel updating in evaluations of political figures has been the subject of continuing debate (Bartels Reference Bartels2002; Bullock Reference Bullock2009; Gerber and Green Reference Gerber and Green1999). Bayesian rationality has often been taken to rule out polarization, but even this is possible in the presence of idiosyncratic likelihood functions, which determine the subjective probability of observing a piece of evidence given a particular state of the world. In other words, the Bayesian model is compatible with a wide range of empirical patterns, even including backlash (Benoît and Dubra Reference Benoît and Dubra2016).
Thus far, we have outlined four theoretical perspectives that predict, or at least allow for, the possibility of backlash effects.Footnote 1 The purpose of this article is not to adjudicate among these theories but instead to document the prevalence of backlash. Focusing on randomized experiments, we searched the literature for evidence of backlash effects in response to informational treatments. Within the context of correcting factual misperceptions, there are several such studies. Nyhan and Reifler (Reference Nyhan and Reifler2010) discovered evidence of ‘backfire’ effects to corrections of misinformation embedded in mock news articles about weapons of mass destruction in Iraq and funding for stem cell research, though these findings were not reproduced in a replication attempt (Wood and Porter Reference Wood and Porter2018). In another study, Nyhan et al. (Reference Nyhan2014) showed that providing a correction about vaccine misperceptions can decrease vaccine-averse subjects’ reported intention to vaccinate; this finding was replicated in Nyhan and Reifler (Reference Nyhan and Reifler2015). Finally, Zhou (Reference Zhou2016) identifies ‘boomerang’ effects in framing experiments on Republicans’ responses to climate change messaging.
Alongside these findings are studies that either do not find convincing evidence of backlash or highlight alternative explanations. Redlawsk et al. (Reference Redlawsk, Civettini and Emmerson2010) examine a hypothesized ‘affective tipping point’ or specific dose of counter-attitudinal information at which backlash stops and incorporation of the evidence begins. While the authors do not emphasize this point, the effects of small doses are too small to be distinguishable from zero.Footnote 2 The effects of large doses are positive and significant. A more straightforward case is Americans’ response to advances in gay rights: Bishin et al. (Reference Bishin2016) conclude from both experimental and over-time survey data that there is ‘no evidence of backlash by the public as a whole or among relevant constituent groups’. Within the context of the corrections literature, Wood and Porter (Reference Wood and Porter2018) execute thirty-six versions of the Nyhan and Reifler (Reference Nyhan and Reifler2010) design over a range of different issues, and find evidence of backfire in only one. A recent study of political rumors (Berinsky Reference Berinsky2015) found that backlash can be prevented through the use of partisan source credibility cues. Finally, an emerging literature argues that apparent factual misperceptions are at least partially an artifact of expressive responding by partisans (Bullock et al. Reference Bullock2015; Prior et al. Reference Prior2015).
In this article, we present the results from three well-powered randomized experiments, each designed to identify the effect of exposure to information on the attitudes and beliefs of different subgroups. We chose three distinct issues intended to cover a range of possible backlash triggers. As we detail in the next section, we operationalize the concept of ‘backlash’ as the appearance of negative treatment effects for some subgroups – in other words, attitude change in the direction contrary to that suggested by the information presented.
Across all three studies, we find no evidence of backlash among theoretically relevant subgroups. This is most remarkable in our first study, on gun control, which was conducted on a nationally representative sample and fielded in the aftermath of what was at the time the largest mass shooting in American history. We generally find that subjects update, if at all, in the direction of the information. Each of the theoretical accounts highlighted here can accommodate backlash as well as its absence. Nevertheless, our results suggest that while backlash may occur under some conditions with some individuals, it is the exception, not the rule.
Measuring Backlash
Suppose that each individual i is endowed with three potential outcomes Y i(neg), Y i(control), and Y i(pos), corresponding to the attitude he or she would express if exposed to negative information, no information or positive information. We define two individual-level treatment effects τ i,neg and τ i,pos. τ i,neg is defined as the difference between the negative and control potential outcomes: Y i(neg) − Y i(control). τ i,pos is defined analogously: Y i(pos) − Y i(control). Individual i updates his or her view in the direction of evidence if τ i,neg ≤ 0 and τ i,pos ≥ 0. Individual i ‘backlashes’ if τ i,neg>0 or τ i,pos<0.
Our expectation is that for most individuals and most treatments, τ i,neg will be negative and τ i,pos will be positive. Our main concern is whether there are any individuals for whom these signs are reversed. Unfortunately, due to the Fundamental Problem of Causal Inference (Holland Reference Holland1986), we can never observe τ i,neg or τ i,pos for any individual. We can, however, estimate average causal effects. The Average Negative Treatment Effect (ANTE) is defined as E[τ i,neg], where E[⋅] denotes the expectation operator. The Average Positive Treatment Effect (APTE) is defined analogously.
In the empirical sections below, we will present three randomized experiments in which we obtain estimates of the ANTE and the APTE. What can we conclude from these estimates? If the ANTE is estimated to be negative and the APTE is estimated to be positive, we cannot draw strong conclusions about whether or not τ i,neg and τ i,pos were ‘correctly’ signed for all individuals; that is, we cannot conclude that there is no backlash simply because on average, individual effects have the expected sign. If, however, the ANTE or the APTE are estimated have the ‘wrong’ sign, we can indeed conclude that at least some number of subjects experienced backlash.
We will extend this logic to subgroups of subjects. The CANTE and the CAPTE are the conditional cousins of the ANTE and the APTE – that is, they refer to the average causal effects conditional on membership in a subgroup. In particular, the majority of the backlash theories enumerated above predict that backlash is most likely among individuals whose baseline opinions are opposed to the evidence that they see. To be specific, Y baseline,i is a pre-treatment characteristic of individuals. Y baseline,i is likely to be correlated with (but distinct from) Y i(control), the post-treatment outcome that subjects express when assigned to the control condition. We define ‘proponents’ as those for whom Y baseline,i is high and ‘opponents’ as those for whom it is low.Footnote 3 Backlash theories predict that τ i,neg is likely to be positive among proponents and that τ i,pos is likely to be negative among opponents. If so, we are more likely to find CANTE estimates to be positive among proponents and CAPTE estimates to be negative among opponents.
Even if we fail to find ‘incorrectly’ signed average causal effects among these subgroups, we will not be able to rule out incorrectly signed individual causal effects. We are therefore left with something of an inferential dilemma: we are looking for evidence of backlash, but the failure to do so does not rule backlash out completely. Our empirical strategy is therefore asymmetric. We can demonstrate that backlash occurs if we can estimate incorrectly signed average causal effects with sufficient precision, but we cannot conclusively demonstrate that it never occurs.
Another approach is to consider the variances of Y i(neg), Y i(control) and Y i(pos). If it is indeed true that τ i,neg is negative for most, but positive for some, the variance of Y i(neg) will be higher than the variance of Y i(control). If effects are homogeneous across subjects, then the variance of the two sets of potential outcomes will be equal. We view an inspection of the variance of outcomes as only partially informative about backlash. While backlash would be variance increasing, so too could other patterns of treatment effects.
Research Approach
Our three studies share important design features, so we describe them together here for convenience. All three studies employ a within-and-between-subjects experimental design. First, respondents were invited to complete a pre-treatment (T1) survey in which we collect baseline demographic information, importantly including measures of Y baseline,i. Secondly, respondents were invited back for a main survey (T2) in which treatments were allocated and post-treatment outcomes were collected.
We conducted these studies on two platforms, a nationally representative sample administered by GfK and Amazon’s Mechanical Turk (MTurk). In recent years, social scientists have recognized the utility of MTurk as a tool for recruiting subjects (for example, Buhrmester et al. Reference Buhrmester, Kwang and Gosling2011). While opt-in samples collected via MTurk should not be considered representative of the US population, they have been shown to outperform laboratory-based convenience samples in ensuring adequate variation across sociodemographic and political characteristics of interest (Berinsky et al. Reference Berinsky, Huber and Lenz2012). Typically, MTurk samples tend to skew younger, less wealthy, better-educated, more male, whiter and more liberal than the population as whole. We opted for this approach in Studies 2 and 3 in order to boost the representativeness relative to student populations (Clifford and Jerit Reference Clifford and Jerit2014; Sears Reference Sears1986), and to better ensure the generalizability of our results via similarity of subjects, treatments, contexts and outcome measures across domains (Coppock and Green Reference Coppock and Green2015).
Some scholars have worried about selection bias in the case of conservatives on MTurk (Kahan Reference Kahan2013). Further, MTurk workers may seek out the ‘right’ answer or exhibit other types of demand effects, especially given that members of that population tend to participate in many social science studies (Chandler et al. Reference Chandler, Mueller and Paolacci2014). While we share these concerns, we also note that the evidence to date indicates that estimates obtained from MTurk samples match national samples well (Coppock Reference Coppock2017; Mullinix et al. Reference Mullinix2015). Most critically, the utility of MTurk samples for drawing inferences about the causal effects of information treatments depends on treatment effect heterogeneity. If the treatment effects for these subjects are substantially different from the effects for others, then MTurk is a poor guide to effects more generally. For this reason, Study 1 is fielded on a nationally representative sample.
In all three studies, we estimate average treatment effects (both the CANTE and CAPTE) of information separately for ‘proponents’ and ‘opponents’ as defined by pre-treatment measures of our dependent variables. In Appendix A, we reproduce our analyses splitting our sample by ideology, partisanship, attitude extremity, attitude consistency and issue importance.
Study 1: Gun Control
Study 1: Procedure
We fielded Study 1 on a nationally representative sample (N=2,122) administered by the survey firm GfK from 22–28 June 2016, roughly 10 days after the mass shooting in Orlando, Florida, and in the midst of a heated debate about terrorism and the regulation of firearms. In a preliminary wave of the survey, administered 3–10 days after the shooting, we determined whether subjects support (‘proponents’) or oppose (‘opponents’) stricter gun control laws. We also asked subjects four questions about their preferred gun control policies. We combine all four dependent variables into a composite index using factor analysis in order to improve power (Ansolabehere et al. Reference Ansolabehere, Rodden and Snyder2008).
In the experiment, subjects were randomly assigned to one of three conditions: no information (control), pro-gun-control information (positive) or anti-gun-control information (negative). The treatments we employed were modeled on those of Lord et al. (Reference Lord, Ross and Lepper1979). Subjects were shown graphical evidence of the relationship between gun control policies and four outcome variables: gun homicides, gun suicides, gun accidental deaths and gun assaults. The evidence was presented as if it were the central finding in ‘Kramer and Perry (2014)’, a fictitious academic article. (See Appendix C for questionnaire and stimuli.) We then collected our dependent variables and asked again about subjects’ ‘proponent’ or ‘opponent’ status.
We assigned subjects to treatment conditions using block random assignment. Using the R package BlockTools (Moore Reference Moore2015), we created matched trios, matching on US region, age, education level, Hispanic ethnicity, gender, income category, marital status, employment, party identification and ideology. Within each trio, we used the R package randomizr (Coppock Reference Coppock2016) to assign one unit to each of the treatment conditions. Means and standard deviations for each treatment condition are shown in Table 1, along with the standard error of both our estimate of the mean and the standard deviation. While it is somewhat unusual to report uncertainty estimates for the estimated standard deviation of an outcome, we do so to facilitate comparisons of the variability of outcomes by treatment condition. As it happens, the standard deviations of the outcomes do not appear to vary by treatment condition and are very precisely estimated.
Table 1. Study 1 (gun control): treatment conditions

Note: bootstrapped standard errors are in parentheses.
Study 1: Analytic Strategy
We present results that we pre-registered in planned regression specifications. We use ordinary least squares (OLS) with HC2 robust standard errors, separately by subject type. We employ survey weights (provided by GfK) for all models.
Study 1: Results
In Table 2, the coefficients on the positive information treatment are estimates of the CAPTE. Likewise, the coefficients on negative information correspond to the CANTE. The estimated effects of the information treatments are small and, in most cases, have standard errors as large as or larger than the estimated coefficients. Whether this is a result of the issue itself, the nature of the sample or the timing of the experiment, we do not find that information has substantial effects on our composite measure of gun control policy preferences. Importantly, however, these negligible persuasive effects are similar across subgroups: pro-gun control information has positive coefficients for both opponents and proponents of gun regulation, indicating a lack of evidence of backlash. Negative information similarly has positive coefficients for both subgroups in the unadjusted models (although for opponents with covariate adjustment, the coefficient is just below zero).
Table 2. Effects of information on gun control composite scale

Note: robust standard errors are in parentheses. Covariates include age, registation, education, Hispanic ethnicity, gender, income, marital status, employment status, party ID and ideology. *p<0.1; **p<0.05; ***p>0.01
Table 3. Effects of information on gun control support

Note: robust standard errors are in parentheses. Covariates include age, registation, education, Hispanic ethnicity, gender, income, marital status, employment status, party ID, and ideology. *p<0.1; **p<0.05; ***p<0.01
In Table 2, we turn to the binary gun control support dependent variable, which asks whether respondents support ‘stricter gun control laws in the United States.’ We similarly estimate small but positive coefficients for positive information across subgroups.Footnote 4 Unlike with the composite index, however, we find that anti-gun control information has negative effects on both opponents and proponents. These estimates rise to conventional levels of significance for proponents of gun control, suggesting, contrary to predictions of backlash, that it is those in favor of gun control who are most receptive to evidence questioning its effectiveness. Together, these findings show a more robust persuasive effect on a generalized measure of support compared to specific, policy-related opinions.
We can also use the standard deviations reported in Table 1 to perform a test of whether the treatments polarized opinion. If the treatments did polarize opinion, the standard deviation in the successively more pro or more con treatment groups should be larger, but we do not observe this pattern. Formal statistical tests also reveal that the treatment groups do not differ with respect to the standard deviations of the outcomes.
Finally, in Appendix A, we show that there is no backlash in a preregistered analysis of the effect of the information treatments by party identification. This is significant because of its commonly theorized role as a perceptual filter that could, in the RAS or JQP accounts, promote polarization or backlash.
The results of Study 1 indicate that gun control attitudes do not consistently move in response to either positive or negative information. This is somewhat surprising given the well-powered nature of the experiment, but we acknowledge that the timing of the study, at the height of a national debate on gun control, may explain why the attitudes were difficult to move. The relatively equivocal findings also show, however, that backlash was unlikely to have occurred as a result of these treatments.
Study 2: Minimum Wage
Study 2: Procedure
A large number (N=2,979) of survey respondents on Mechanical Turk were recruited to participate in a pre-treatment survey measuring demographic characteristics (age, gender, race/ethnicity, education, partisan affiliation and ideological leaning) as well as baseline attitudes toward the minimum wage. From this large pool of survey respondents, 1,500 were invited using MTurkR (Leeper 2017) to take part in the main survey testing the effect of videos on attitudes toward the minimum wage. Invitations to take part in the main survey were offered on a random basis, though more slots were offered to younger respondents and those with stronger views (pro or con) about the minimum wage. Of the 1,500 recruited to the main survey, 1,170 participated.
Subjects were exposed to two videos on the subject of the minimum wage. Two of the videos were in favor of minimum wage increases, one presented by John Green, a popular video blogger, and the other presented by Robert Reich, former US Secretary of Labor and established left-leaning public intellectual. On the ‘con’ side of the debate, one video was presented by an actor, and the other by economics professor Antony Davies. Within each side, one video featured a relatively young presenter and the other a relatively old presenter. Finally, two videos were included as placebos, addressing mundane requirements of state minimum wage laws. Links to all six videos are available in Appendix C, as well as screenshots that convey the production quality and mood of the videos.
Subjects were randomized into one of thirteen conditions: placebo, or one of the twelve possible orderings of the four persuasive videos. Subjects answered intermediate questions relating to how well made and persuasive they found each video, and then at the end of the survey they answered two questions that serve as our main dependent variables. The Amount question asked, ‘What do you think the federal minimum wage should be? Please enter an amount between $0.00 and $25.00 in the text box below.’ The interpretation of this dependent variable may be colored by anchoring considerations (Tversky and Kahneman Reference Tversky and Kahneman1974), since specific wage numbers were mentioned in some of the treatment videos. The second dependent variable avoids this concern. The Favor question asked, ‘The federal minimum wage is currently $7.25 per hour. Do you favor or oppose raising the federal minimum wage?’ The response options ranged from 1 (Very much opposed to raising the federal minimum wage) to 7 (Very much in favor of raising the federal minimum wage).
Study 2: Analytic Strategy
We order the treatment conditions according to the amount of pro-minimum wage video content. The information content of the Con Con conditions is scored −1, the Pro Con and Placebo conditions 0, and the Pro Pro conditions 1, as shown in Table 4. We will estimate separate regressions as written in Equation 1 for opponents, moderates and proponents. Opponents are defined as subjects whose pre-treatment Favor response was 4 or lower and whose Amount response was below the median response ($10.00). Those with Favor responses of 4 or higher and Amount responses above the median are defined as proponents. All others are defined as moderates.

Table 4. Study 2 (minimum wage): treatment conditions

Table 4 presents the means and standard deviations by experimental group. Here again, we see an indication that the treatments had average effects in their intended directions. The means of the Con Young/Con Old condition are lower than those of the mixed conditions, which are themselves lower than the means of the Pro Young/Pro Old conditions. These differences are all statistically significant. Turning to the differences in standard deviations, formal tests under the sharp null of no effect lend some support to the hypothesis that the treatments lead to increases in the polarization of opinion – the differences between the placebo condition and the Pro Old, Con Old condition are statistically significant for both dependent variables at the p<0.01 level. However, while increases in the standard deviations of outcomes would be a consequence of backlash, these increases could also result from some individuals having larger treatment effects than others, but with all effects still correctly signed.
Study 2: Results
The results of Study 2 are presented in Tables 5 and 6. Focusing on the covariate-adjusted estimates, the video treatments had powerful effects on all three subject types. In contrast to Study 1, positive information had positive and statistically significant effects on subjects’ preferred minimum wage amount; negative information had strongly negative effects.
Table 5. Effects of information on preferred minimum wage amount

Note: robust standard errors are in parentheses. The information content of the Placebo condition is coded 0. Covariates include T1 Amount, T1 Favor, age, gender, ideology, party ID, and education. *p<0.1; **p<0.05; ***p<0.01
Table 6. Effects of information on favoring minimum wage raise

Note: robust standard errors are in parentheses. The information content of the Placebo condition is coded 0. Covariates include T1 Amount, T1 Favor, age, gender, ideology, party ID, and education. *p<0.1; **p<0.05; ***p<0.01
A similar pattern of response is evident in Table 6. All coefficients are correctly signed. With the exception of negative information among opponents, all these coefficients are statistically significant.
Study 3: Capital Punishment
The treatments used in Study 3 are adapted from those of Lord et al. (Reference Lord, Ross and Lepper1979).Footnote 5 In that study, subjects were presented sequentially with apparent scientific evidence that both challenged and affirmed the notion that the death penalty deters crime, what we would refer to as a ‘mixed evidence’ condition. To this single condition, we added various combinations of pro-capital punishment, anti-capital punishment and inconclusive evidence. We also made minor updates to the original text (changing the publication date of the fictitious research articles from 1977 to 2012, for example) and to the graphical and tabular display of the fabricated data using modern statistical software.
We recruited 1,659 MTurk subjects to take the T1 survey in which we gathered a series of pre-treatment covariates (age, race, gender and political ideology) and two items concerning capital punishment: attitude toward the death penalty and belief in its deterrent effect. From the pool of 1,659, 933 subjects’ pre-survey responses indicated clear and consistent support for or opposition to capital punishment. These subjects were invited to participate in the main survey. Among these, proponents were defined as subjects whose answers to the pre-treatment attitude and belief questions were between 5 and 7 on a seven-point scale. Opponents were defined as subjects whose answers to these questions were between 1 and 3. A total of 683 subjects participated in the main survey (287 proponents and 396 opponents).
The two main dependent variables measured subjects’ attitudes and beliefs about capital punishment. The Attitude question asked, ‘Which view of capital punishment best summarizes your own?’ The response options ranged from 1 (I am very much against capital punishment) to 7 (I am very much in favor of capital punishment). The Belief question asked, ‘Does capital punishment reduce crime? Please select the view that best summarizes your own.’ Responses ranged from 1 (I am very certain that capital punishment does not reduce crime) to 7 (I am very certain that capital punishment reduces crime).
Study 3: Procedure
Subjects were randomly assigned to one of six conditions, as shown in Table 7 below. All subjects were presented with two research reports on the relationship between crime rates and capital punishment that varied in their findings: Pro reports presented findings that capital punishment appears to decrease crime rates, Con reports showed that it appears to increase crime rates, and Null reports showed that no conclusive pattern could be discerned from the data. The reports used one of two methodologies:Footnote 6 cross-sectional (a comparison of ten pairs of neighboring states, with and without capital punishment) or time-series (a comparison of the crime rates before and after the adoption of capital punishment in fourteen states).
Table 7. Study 3 (capital punishment): treatment conditions

Note: bootstrapped standard errors in parentheses.
As in Study 2, the statistical models operationalize the ‘information content’ of the pair of reports seen by subjects in a linear fashion. The positive information content of two Pro reports is coded as 2, one Pro and one Null as 1, and so on. In order to allow the coefficient on information content to vary depending on whether the information is pro- or counter-attitudinal, we split the information content variable into positive information and negative information, as shown in Table 7. We view the information content parameterization as a convenient way to summarize the overall pattern of results, not as an assertion that the effects are strictly linear. As before, we present the means and standard deviations of both outcome variables by treatment group in Table 7. These estimates indicate that the treatments had average effects in the ‘correct’ direction.
Relative to the Null Null condition, the differences in standard deviations across groups are generally not statistically significant at the 5 per cent level, according to a randomization inference test conducted under the sharp null hypothesis of no effect for any unit. The only exception is the difference in standard deviations between the Null Null and Pro Null conditions for the Support dependent variable (p=0.04). This inference does not survive common multiple comparisons corrections, including the Bonferroni, Holm and Benjamini–Hochberg corrections. We conclude from these tests that the treatments do not polarize opinion in the sense of increasing its variance.
Study 3: Analytic Strategy
The relatively complicated design described above can support many alternative analytic strategies. Each report is associated with seven intermediate dependent variables in addition to the two endline dependent variables. Subjects could have been assigned to eighteen different combinations of research reports. Reducing this complexity requires averaging over some conditions and choosing which dependent variables to present. We present our preferred analysis here. We focus on the separate effects of positive and negative information on subjects’ T2 responses to the Attitude and Belief questions. Because the Null Null and Pro Con conditions are both scored 0 on both the positive information and negative information scales, we include an intercept shift for the Null Null condition,Footnote 7 as shown in Equation 2:

We estimate Equation 2 using OLS for proponents and opponents separately. $\widehat{\beta }_{1} $ forms our estimate of the CAPTE and $\widehat{\beta }_{2}$
 our estimate of the CANTE.
Study 3: Results
Tables 8 and 9 present estimates of the effects of information on attitudes and beliefs about capital punishment. Focusing on the covariate-adjusted models, we estimate that a one-unit increase in positive information causes an average increase in support for capital punishment of 0.015 scale points among proponents and 0.068 scale points among opponents, neither of which is statistically significant. Negative information has a strong negative effect among proponents (−0.326, p<0.01), and a weakly negative effect among opponents (−0.042, p=0.43). These estimates imply that moving from the Con Con condition to the Pro Pro condition would cause proponents to move 2⋅0.015 + 2⋅0.326=0.682 scale points and opponents to move 2⋅0.068 + 2⋅0.042=0.220 scale points. While the treatment effects do appear to differ by subject type (p<0.05), we do not observe the ‘incorrectly’ signed treatment effects that backlash would produce.
Table 8. Effects of information on support for capital punishment

Note: robust standard errors are in parentheses. The information content of the Null Null condition is coded 0. Covariates include T1 Attitude, T1 Belief, age, gender, ideology, race, and education. *p<0.1; **p<0.05; ***p<0.01
Table 9. Effects of information on belief in deterrent efficacy

Note: robust standard errors are in parentheses. The information content of the Null Null condition is coded 0. Covariates include T1 Attitude, T1 Belief, age, gender, ideology, race, and education. *p<0.1; **p<0.05; ***p<0.01
Turning to Table 9, we observe that the effects of the information treatments on belief in the deterrent efficacy of capital punishment are nearly identical for proponents and opponents. For both groups, moving from Con Con to Pro Pro results in an entire scale point’s worth of movement. Study 3 again does not provide any direct evidence of backlash. For both proponents and opponents, treatment effects were always correctly signed.
Summary of Results
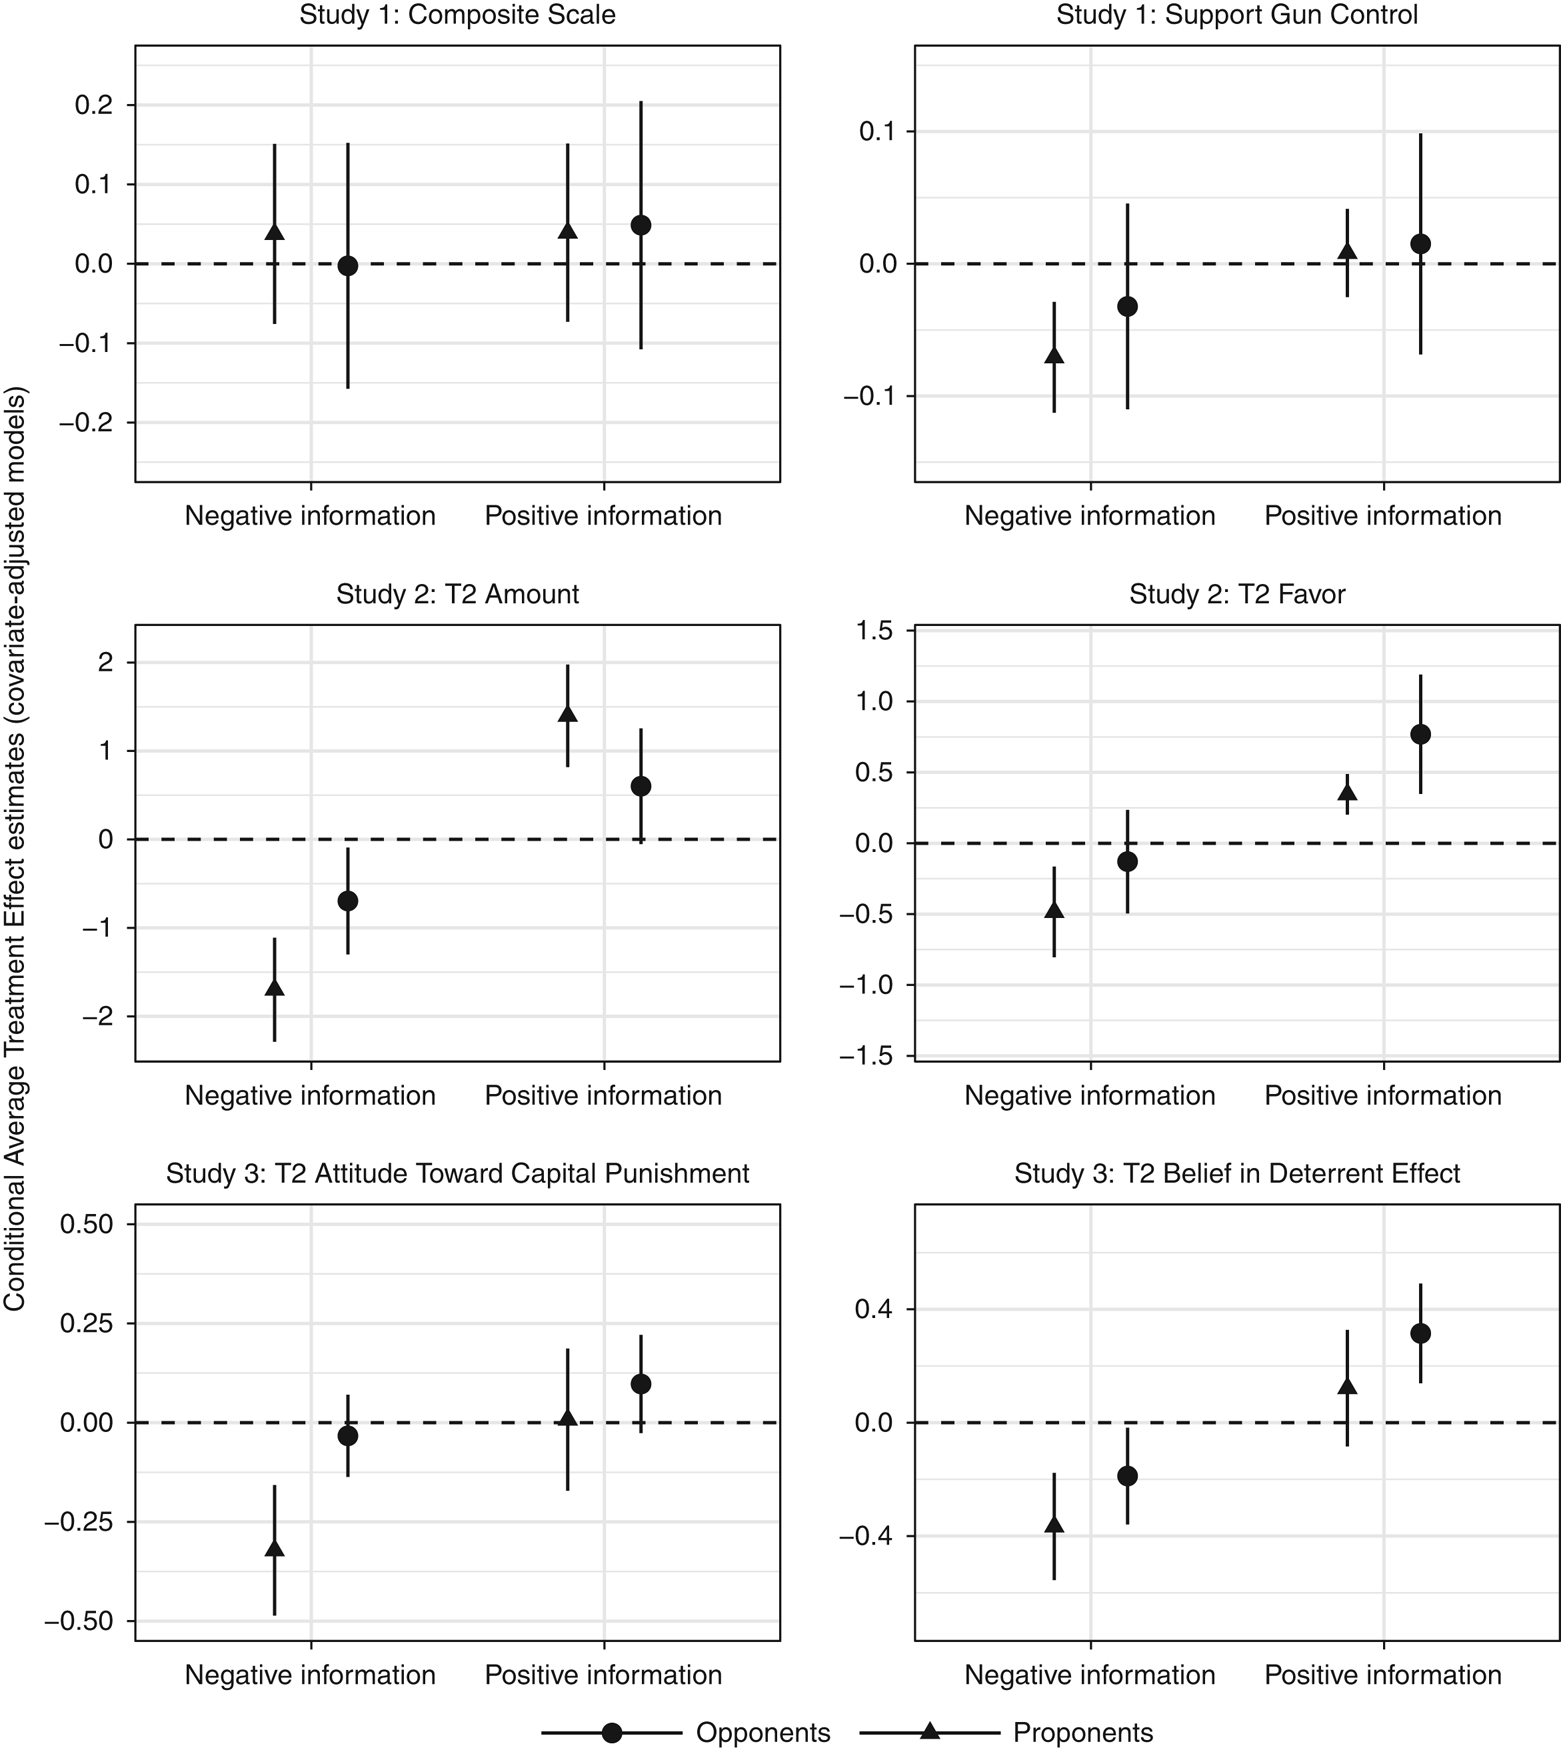
Figure 1 summarizes the results of all three experiments, plotting the covariate-adjusted treatment effect estimates of positive and negative information from Tables 2, 3, 5, 6, 8 and 9. Out of twenty-four opportunities, twenty-three estimates are correctly signed. Needless to say, this pattern is unlikely to occur by chance: a formal binomial test roundly rejects the null hypothesis that the treatment effects were equally likely to be correctly or incorrectly signed (p<0.001). Eleven of the twenty-four treatment effect estimates are statistically significant at p<0.05 or better. While some individual estimates are less precise than we would like, the overall pattern of evidence is strongly in favor of individuals updating in the direction of the information presented rather than resisting it or otherwise exhibiting backlash.

Figure 1. Regression coefficients from models (with controls) reported for all three studies, with 95 per cent confidence intervals
Exploring Treatment Effect Heterogeneity
Thus far, we have considered whether proponents and opponents (as defined by pre-treatment measures of support) experience differently signed treatment effects in response to the same information. However, the proponent/opponent covariate is not the only potential moderator that could be associated with treatment effect heterogeneity. The theoretical accounts we outlined earlier hypothesize a few factors in particular. For example, cultural cognition would predict boomerang effects in response to factual claims that threaten one’s cultural or ideological worldview. The John Q. Public and related motivated reasoning accounts suggest a greater likelihood of backlash among the most politically knowledgeable and aware individuals as well as the strongest partisans. We were able to measure several factors in our studies: attitude extremity, issue importance, attitude consistency, ideology and partisanship. We present analyses by these variables in Appendix A, again finding mild evidence of treatment effect heterogeneity but no evidence of backlash.
The covariate-by-covariate search for backlash is fraught with the risk of making false discoveries (Gelman and Loken Reference Gelman and Loken2016; Humphreys et al. Reference Humphreys, Sanchez de la Sierra and van der Windt2013; Kerr Reference Kerr1998). In order to guard against these pitfalls, we conduct a holistic analysis of treatment effect heterogeneity using a method that considers all measured moderators in a single model. Bayesian Additive Regression Trees (BART) is a recent advance in statistical learning (Chipman et al. Reference Chipman, George and McCulloch2007, Reference Chipman, George and McCulloch2010) that has been recommended by social scientists (Green and Kern Reference Green and Kern2012; Hill Reference Hill2011) as a method for flexibly and automatically detecting treatment effect heterogeneity. BART is a sum-of-trees model that predicts the conditional mean of the outcome variable while minimizing overfitting. A principal benefit of using BART over other machine learning algorithms is that it is robust to the choice of tuning parameters; we use the default settings implemented in the dbarts package for R. Standard statistical methods such as OLS have the advantage of providing relatively simple data summaries. The effect of treatment can be summarized as the coefficient on the treatment indicator, and heterogeneity can be characterized by the coefficients on interaction terms. BART models, by contrast, cannot easily be summarized by a series of coefficients, so we rely on graphical presentations.
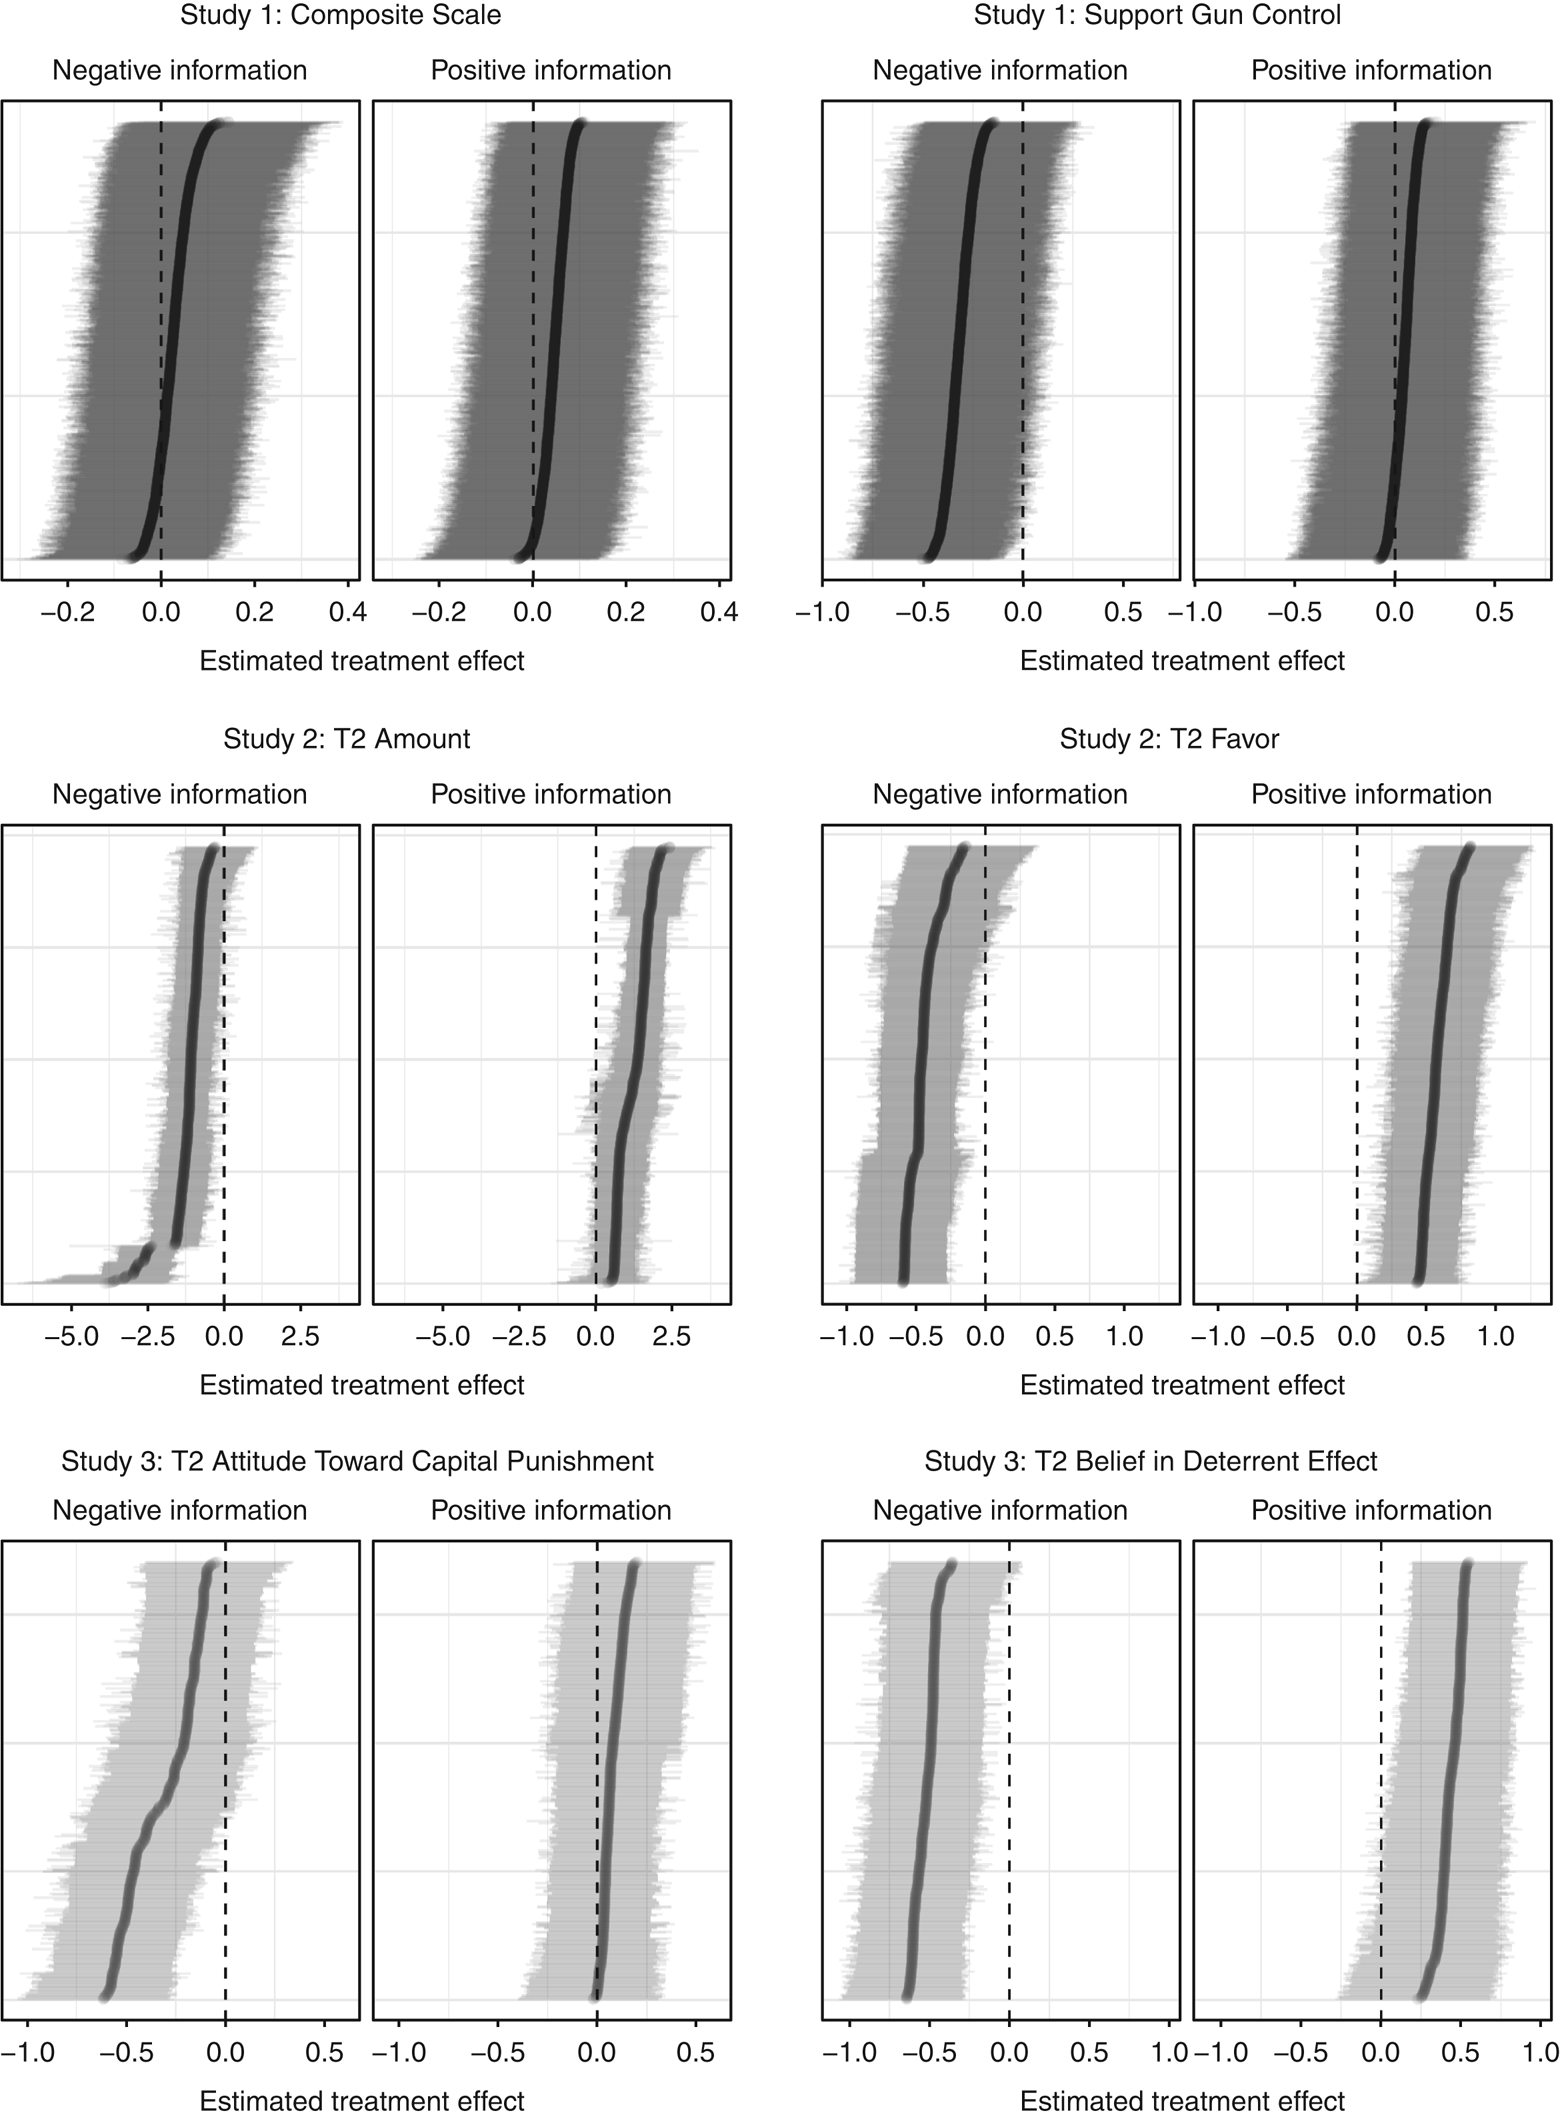
Figure 2 plots the estimated treatment effect for each subject as a function of their individual covariate profile, along with a 95 per cent credible interval. According to this analysis, 93 per cent of subjects have a positive treatment effect estimate when exposed to positive information and 77 per cent have a negative treatment effect estimate when exposed to negative information. In none of the cases for which a subject was predicted to have an incorrectly signed treatment effect does the 95 per cent confidence interval exclude 0. This analysis reveals a remarkable level of treatment effect homogeneity. Most subjects appear to update in the direction of information, by approximately the same amount.

Figure 2. BART estimated treatment effects
Discussion
How common is backlash? Across three studies, we find little evidence of the phenomenon. In the formulation introduced earlier, our estimates of CANTE are not positive, and our estimates of CAPTE are not negative. Evidence about gun control does not polarize opinion on the subject and appears to make proponents less likely to support gun regulation. Arguments about the minimum wage move respondents in the direction of evidence – toward supporting a higher or a lower dollar amount according to the slant of the evidence presented in the video treatments. Finally, pro-capital punishment evidence tends to make subjects more supportive of the death penalty and strengthens their beliefs in its deterrent efficacy, while evidence that the death penalty increases crime does the opposite.
The studies reported here were designed to encompass a variety of different types of information: scientific evidence described in tables and graphs in addition to more colloquial video appeals. The issues covered vary along numerous dimensions: both ‘hot’ (gun violence) and ‘cold’ (minimum wage), easily mapped to the partisan divide or not, and of varying degrees of salience. The results do not depend on the particular issue, whether arguments were presented in a one- or two-sided fashion, or idiosyncratic features of the topics chosen. Additionally, in results not reported here, backlash effects do not materialize over time. In two studies in which we collected follow-up responses (Studies 2 and 3), the initial findings persist at least 10 days after the initial experiment, although the magnitudes are somewhat attenuated. We noted above that our research design is asymmetric. If we had found significant evidence of incorrectly signed effects, we could have concluded that backlash did indeed occur in our experiments. On the whole, we did not find incorrectly signed effects, but we cannot conclude that backlash did not occur because some individuals (not exclusively defined by ‘opponent’ or ‘proponent’ status or partisan identity) may have had an adverse reaction to the treatments. One intriguing possibility is that this very asymmetry contributes to the relatively widespread contention that presenting individuals with counter-attitudinal information is counterproductive: we can draw sharp inferences when backlash occurs, but are left wondering when it does not. This imbalance may carry over into the visibility and novelty of published research findings.
These experiments show that when people are exposed to information, they update their views in the expected or ‘correct’ direction, on average. However, one way in which these findings might not generalize to non-experimental contexts is if people selectively avoid counter-attitudinal information. Prior (Reference Prior2007) and Arceneaux and Johnson (Reference Arceneaux and Johnson2013) find that many individuals, if given the choice, simply consume entertainment rather than news information, thereby selecting out of both pro- and counter-attitudinal information in one stroke. However, Bakshy et al. (Reference Bakshy, Messing and Adamic2015) show that while partisan Facebook users do appear to prefer pro-attitudinal news stories, they are exposed to and consume a large amount of counter-attitudinal information. Other recent work shows evidence that selectivity in media consumption is limited to relatively small subgroups (Barberá Reference Barberá2014; Guess, Reference GuessNd; Guess et al. Reference Guess2018). Future research should consider the conditions under which individuals could be induced to seek out larger or smaller doses of information with which they disagree.
A reasonable objection to these findings is that while individuals may not exhibit backlash when reading relatively sterile descriptions of academic studies, they may do so when arguing about a particular proposition with an opponent. This is partially a concern about demand effects: were subjects, especially eager-to-please MTurk respondents, answering with stronger accuracy motivations than we would expect to find in a more naturalistic setting (as suggested in Hauser and Schwarz Reference Hauser and Schwarz2016)? Since we did not explicitly incorporate motivational primes into our designs, we cannot completely rule out the possibility.Footnote 8 However, we note that our dependent variables generally asked about subjects’ opinions on issues rather than factual perceptions, a feature illustrated most vividly in the case of gun control, in which arguments about the appropriate policy response are heavily contested (especially while our Study 1 survey was fielded). Beyond these particular experiments, scholars have found surprisingly little evidence of demand effects when information about researchers or their expectations is given to online study participants (Leeper and Thorson Reference Leeper and Thorson2015; Mummolo and Peterson Reference Mummolo and Peterson2017; White et al. Reference White2016).
Of course, many political disputes linger and are not easily resolved when new information comes to light. We speculate that in truly contentious political environments, in which opposing sides routinely insult the other (or much worse), the introduction of evidence could induce a divergence in attitudes (Berry and Sobieraj Reference Berry and Sobieraj2013). Perhaps in such antagonistic contexts, individuals become distrustful of counter-attitudinal arguments. We leave the search for backlash effects in such contentious environments to future research.
Supplementary material
Data replication sets are available in Harvard Dataverse at: https://doi.org/10.7910/DVN/J7WNTM and online appendices are at https://doi.org/10.1017/S0007123418000327
Acknowledgments
The authors would like to thank David Kirby as well as the students in Columbia’s Political Psychology graduate seminar for their insight and support as this project developed. We thank Time-sharing Experiments for the Social Sciences for supporting Study 1. Deanna Kuhn and Joseph Lao generously shared copies of original experimental materials with us for Study 3. We benefited greatly from discussions at the New York Area Political Psychology Meeting in November 2014, the Dartmouth Experiments Conference in July 2016, and the 2016 Annual Meeting of the American Political Science Association. Special thanks to John Bullock, Jamie Druckman, Don Green, Brendan Nyhan, and three anonymous reviewers for their useful comments and suggestions. Studies 2 and 3 were reviewed and approved by the Institutional Review Board of Columbia University (IRB-AAAN5213), and Study 1 was approved by both the New York University (IRB-FY2016-639) and Columbia University (IRB-AAAQ7729) Institutional Review Boards. We pre-registered the designs and intended analyses of Studies 1 and 3 with Experiments in Governance and Politics before primary data collection began.