


1. Introduction
Background
1.1 The UK has seen a significant transition from Defined Benefit (“DB”) to Defined Contribution (“DC”) for occupational pension saving. The planned automatic enrolment program starting in 2012 is expected to increase the use of DC.
1.2 The main features of DC are that investment risk falls onto the individual during the pre-retirement phase and there are no guarantees as to the investment return or the level of pension. This can lead to individuals being left with insufficient income during retirement and difficulties for individuals in planning their retirement.
1.3 Our working party was formed to investigate whether there is a place in the UK DC market for a guaranteed savings product. Our focus is on the mass market (which we define as those between the 20th and 80th percentile by income). The mass market is expected, in the short to medium term at least, to effectively remain subject to compulsory annuitisation (as the majority will not meet the criteria required for income drawdown). Under annuitisation, investment risk after retirement is passed to an insurer. Therefore, we have only considered the pre-retirement phase in this paper.
1.4 The working party was formed under the sponsorship of the Finance and Investment Practice Executive Committee of the Institute and Faculty of Actuaries.
1.5 In July 2012, Steve Webb, the Pensions Minister, highlighted the relevance of this topic by challenging industry to think hard about meeting the need for more certainty about pension savings in DC plans and to consider providing an affordable ‘Money Safe’ guarantee where the member would get back at least the nominal value of their contributions (individual, employer and tax relief) at retirement.
Contents and scope of paper
1.6 This paper starts off in Sections 2 and 3 by looking at the pension systems in the UK and from various countries around the world, in particular the existence and use of investment guarantees and any lessons that can be learnt from existing regimes.
1.7 We then identify, in Section 4, the typical wants and needs of the mass market in respect of their pension provision. We also look at the wants and needs of traditional pension providers, i.e. employers and insurers, as well as regulators. We assess whether guarantees can help meet these needs and wants.
1.8 Guaranteed savings products are not a new idea. In addition, a number of methods for managing investment risk and providing investment guarantees have been developed over the years. In Section 5, we describe some of the most common products and techniques. In Section 6, we compare the relative economic features of these approaches to assess the need for guaranteed savings products and the potential scope for offering money-back guarantees.
1.9 In Section 7, we look at some of the practical issues surrounding providing guaranteed products for DC pensions in the mass market.
1.10 Finally, in Section 8, we summarise our findings.
2. UK Pension System
2.1 In this section, we look at the UK pension system to identify the extent of existence of pension guarantees.
2.2 Most developed countries rely on three pillars of pension provision to ensure that pensioners receive an appropriate level of retirement income:
(i) Pillar 1 – state provision
(ii) Pillar 2 – employer/employee provision
(iii) Pillar 3 – individual provision
2.3 The current UK system is to provide a flat basic state pension plus an earnings-related state pension as Pillar 1. Pillar 3 is encouraged through tax incentives. However, Pillar 2 is the key element of pension provision for a large proportion of our target population. OECD (2011, p.123) reports that private pensions provide more income in retirement than state pensions for the median earner in the United Kingdom.
Pillar 2 background
2.4 Historically, most Pillar 2 provision in the UK was provided in the form of DB schemes.
2.5 DB schemes generally provide a lifetime pension in retirement based on the salary level and employment service of an employee. Benefits can be defined in terms of final salary or career average, although final salary has typically been most common. Longevity and investment risk falls on the employer whilst they are solvent.
2.6 The cost of providing DB schemes has in many cases become dis-proportionate to the profits of the sponsoring employer and many companies have considered them too expensive or too risky.
2.7 In the past 10 years, the UK has seen a significant transition from DB to DC for Pillar 2. Towers Watson (2012a) report that the percentage of DC assets has increased from 8% to 39% between 2001 and 2011.
2.8 DC plans have a fixed contribution rate as a percentage of salary, often by both employer and employee. The contributions are invested into funds at the choice of the employee (usually within a focused fund range chosen by the trustees of the scheme, or a very long list of funds for contract based schemes). A default fund is typically offered for members who do not make a choice.
2.9 The main features of DC plans are that investment risk falls onto the individual during the pre-retirement phase and neither the employer nor the scheme provider (in the case where a provider such as an insurance company has been appointed by the employer) provides a guarantee as to the level of investment return or pension. This provides welcome certainty over cost to the employer but passes risk onto the employee. The employee could suffer from low investment returns and/or high annuity rates.
2.10 Current tax rules allow pension contributions to be made out of gross salary and until recently, annuitisation was compulsory. Under annuitisation, investment and longevity risk passes to the insurance company after purchase of the annuity.
2.11 The Finance Act 2011 has removed the need for this compulsory annuitisation. However, this requires individuals to meet a minimum pension income requirement of £20,000pa to qualify and this is unlikely to be applicable to the mass market. Therefore, in this paper, we focus only on investment risks in the pre-retirement phase.
2.12 Annuitisation is only compulsory at age 75, regardless of when an individual actually retired. The “at retirement” savings market is developing rapidly and, increasingly, individuals are not immediately annuitising at retirement.
2.13 It should also be noted that under current tax rules, 25% of the accrued pension pot may be taken as a tax-free cash lump sum rather than be annuitised and that this is a very common occurrence.
Automatic enrolment and NEST
2.14 Over a five year period from October 2012, employers will be required to start automatically enrolling workers into a qualifying workplace pension scheme. The start date for an individual employer depends on its PAYE population size.
2.15 Employers will be required to automatically enrol workers who
(a) Are not already in a qualifying workplace pension scheme;
(b) Are aged between 22 and State Pension Age;
(c) Earn more than £8,105 per annum; and
(d) Ordinarily work in the UK (under their contract)
2.16 A qualifying scheme can be a DB or hybrid scheme but it is expected that the vast majority of qualifying schemes will be DC schemes.
2.17 From October 2018, a minimum of 8% of earnings must be paid in contributions, with a minimum of 3% to be contributed by the employer.
2.18 Individuals have the right to opt out of the scheme so the scheme is not fully compulsory.
2.19 As part of the forthcoming Pension reform, the UK government has established the National Employment Savings Trust (“NEST”). This is a not-for-profit pension scheme which is pitched primarily at employers who are seeking a suitable DC scheme to meet some or all of their automatic enrolment obligations. There is no requirement to use NEST and indeed NEST now has a number of low-cost competitors.
2.20 NEST (2012) announced that it will run target date funds (one fund for each future retirement year) with the following features:
• 3 investment phases (foundation, growth and consolidation)
• NEST determines fund allocations
• Dynamic asset allocations, reflecting market conditions and risk limits
• Use of passive investment funds
• Statement of intention for low charges (expected to be 0.3% per annum plus a 1.8% contribution charge).
2.21 The foundation phase is a new concept for DC plans. The idea is that in the first 5 years, investment risk should be low to avoid shocks to encourage saving.
2.22 The growth phase is risk-controlled and is expected to adopt a diversified multi-asset fund approach, as opposed to the higher equity exposure in a typical existing lifestyling fund.
2.23 The consolidation phase is expected to start 10 years before retirement and transitions the fund from return-seeking assets towards cash and annuity tracking assets. This is very similar to the approach used under current lifestyling funds.
2.24 We consider the NEST approach further in section 5.
Hybrid “Middle-way” schemes
2.25 In response to recognition that the transition from DB to DC passes risk onto employees, a small number of middle-way options which share investment and longevity risks between the employer and member have been designed in the UK. These include:
• Cash balance plans where DC-like contributions are credited with a fixed rate of return until retirement. These are usually set up on a pooled, notional basis. Employers benefit or suffer from investment surpluses or deficits and so individuals do not have a say in the investment strategy
• DC with underpins where the employer guarantees minimum pension benefits based on a salary based formula but pays a DC fund if at retirement, the annuity that could be bought by the DC fund turns out to be higher. These are usually set up on an individual account basis with the individual controlling their investment strategy. This creates larger risk on the employer than a traditional DB scheme as the employer has no control over the level of investment risk being taken.
2.26 These schemes are currently classified as DB yet also fall under the UK statutory regulations for DC schemes. They generally offer an improvement for members relative to pure DC but come with the challenges of communicating them effectively and dealing with the administrative and legal burdens of falling within both the DC and DB regulatory regimes.
2.27 The Association of Consulting Actuaries (2009) has carried out research that suggests that whilst many companies are supportive of middle way schemes, they believe that legislation does not easily allow for sharing risks and unless there was a step change in regulation, most companies would be unlikely to implement such schemes.
Conclusions
2.28 The key pillar of pension provision for the majority of employed UK individuals is Pillar 2 – employer and employee provision. The introduction of automatic enrolment will increase this reliance on Pillar 2.
2.29 The move from DB to DC has led to a removal in Pillar 2 pension guarantees for a large proportion of the population, who now have no pension guarantees, except for those provided in state benefits.
2.30 A small number of employers have attempted to re-introduce guarantees through “middle-way” schemes. However, these generally involve a lot of challenges for employers and so are unlikely to become common.
3. Pension Systems from around the world
Introduction
3.1 We have seen that investment guarantees are becoming increasingly rare in UK pension savings.
3.2 In this section, we look at the key features of a number of different systems from other countries to identify whether guarantees are common elsewhere and the impact any such guarantees have on pension saving.
Netherlands
3.3 The second pillar in the Netherlands is still heavily dominated by DB schemes as both employers and (union-backed) employees must agree to any changes to plans. Van der Lecq & Van der Wurff, (Reference Van der Lecq and Van der Wurff2011, p1) report that only 5% of employees were in DC plans at the end of 2008.
3.4 However, there has been a material shift from final salary schemes to career average schemes for DB schemes. Van der Lecq & Van der Wurff (Reference Van der Lecq and Van der Wurff2011, p1) report that approximately 90% of employees had a career-average scheme at the end of 2008.
3.5 These schemes are quasi-mandatory and it is reported (www.pensionfundsonline.co.uk) that 80% of occupational plan members are being covered by mandatory sector-wide plans.
3.6 An alternative approach, Collective DC (“CDC”) schemes, has also been trialled. They allow greater cost certainty to employers than DB schemes, but retain some pooling and risk sharing for employees unlike traditional DC schemes.
3.7 In simple terms, as with DB schemes, members accrue nominal pension rights annually, with indexation of these benefits dependent on fund performance. However both these nominal pensions and indexation increases can be changed if fund performance is poor.
3.8 CDC in itself does not provide any absolute guarantees, nor provide greater certainty than plain DC, although it does build up expectations. It could be possible for the investment strategy of the fund to provide guarantees but this would increase complexity, and raise questions about who was ultimately responsible for meeting those should the fund suffer.
Germany
3.9 German Pillar 2 pension plans provide an absolute guarantee. The Riester reform from 2001 requires a minimum rate of return of 0% on accumulated savings at retirement. As these are the responsibility of the employer, they are classified as DB schemes.
3.10 It is worth noting that the guarantee is cancelled on transfer of employer before retirement.
3.11 Riester pensions are also sold directly by pension providers (e.g. insurers) under Pillar 3. These must guarantee, at retirement, an accumulation of contributions compounded at a fixed positive interest rate (reduced from 2.25% per annum to 1.75% per annum in 2012). In most cases, the provider credits the guaranteed rate only.
Denmark
3.12 Denmark provides a tax-financed basic pension but also requires all employees to contribute to a low contribution first-pillar pension, provided by ATP, a public pension fund. ATP must provide a minimum guarantee of member's contributions, which is re-set regularly in line with long-term interest rates.
3.13 Second Pillar schemes are voluntary, although compulsory industry-wide funds are common. Aon Hewitt (2011, p12) reports that 80% of the workforce contributes to a second-pillar scheme and that over 90% of these schemes are DC.
3.14 The majority of the DC schemes are invested with insurance companies and include minimum return guarantees.
3.15 Regulations restrict equity investment in Pillar 2 schemes to 50% and, in practice, only 20% on average is invested in equities.
Switzerland
3.16 Switzerland runs a mandatory second pillar, where employers are required to provide pension schemes.
3.17 These pension schemes must meet a minimum return threshold, which is intended to be linked to the average market yield on seven-year Swiss government debt. This guarantee applies both at retirement and also on switching of provider.
3.18 In practice, this means that the minimum return is the level usually credited to member's accounts.
Australia
3.19 Australian pension provision is predominantly based on a mandatory second pillar requiring individuals to have funded pension accounts.
3.20 A wide range of providers, including industry funds, exist and 80% of the plans are DC (Towers Watson, 2012a). However, most funds use a trust structure with trustees responsible for investment strategy. A high equity exposure is common for active members and guaranteed investment products are rare.
USA
3.21 A key element of Pillar 2 and 3 provision in the US is the use of 401(k) accounts. These were initially personal provisions encouraged by tax incentives. However, increasingly, employers are making contributions into individual's accounts. ICI (2012) reports that $3,070bn was held in 401(k) DC plans at the end of 2011.
3.22 Employers are now allowed to automatically enrol their employees in 401(k) plans, requiring opt-out for those not wanting to participate. Such automatic plans stipulate a default fund and default contribution rate.
3.23 Under the Pension Protection Act of 2006, if the default fund meets certain requirements to be classified as “Qualified Default Investment Alternative”, the liability for investment losses as a result of automatic enrolments passes from the employer to the employee.
3.24 In 2011, about 60% of American households nearing retirement age had 401(k) accounts. However, it has been reported (Browning, Reference Browning2011) that these contained on average considerably less (c25%) than the amount needed to maintain the individual's standard of living in retirement.
3.25 70% of all schemes now offer target-date funds (ICI, 2012). However, as reported in Pollock (Reference Pollock2012), the Securities and Exchange Commission recently sought comments on proposed new rules to apply to the marketing materials used by target date fund providers to improve understanding of how such funds work.
3.26 ICI (2012) reports that members in their sixties invested 16.5% of their 401(k) assets at the end of 2011 in Guaranteed Investment Contracts and other Stable Value funds, although these are mainly viewed as alternatives to cash. However, savers in their twenties saved just 4.4% of their account in such assets.
Japan
3.27 All DC plans must provide at least one capital guaranteed product (ie 0% return guarantee) amongst their investment alternatives. This guarantee level needs to be considered in the context of 0% bank interest rates in Japan.
3.28 Pillar 3 Variable Annuities with a guaranteed minimum accumulation benefit are also very popular in Japan.
Conclusions
3.29 It is clear that a wide range of systems are currently in place for Pillar 2.
3.30 A lot of the regimes we have investigated have a mandatory or quasi-mandatory Pillar 2 system although this is not universal.
3.31 A number of these regimes do include a return guarantee and often this is required by law to reduce the risk of pension burden falling back on the state.
3.32 Typically, those countries where a guaranteed return is required see that pension savings are invested more cautiously than in other countries, such as the UK and Australia.
3.33 It is also common that where a guarantee is offered, especially if this is based on long term bond yields, accounts are credited with that guarantee return and no upside return is sought.
4. Wants and needs?
4.1 There is no use in designing guaranteed pensions savings products if they are neither wanted nor needed. In this section we examine the wants and needs of different stakeholders, and highlight initial thoughts regarding how these wants and needs may be met by guaranteed products (although we also touch on other potential solutions).
4.2 The distinction between wants and needs is an important one. A lot of individuals have views on their wants but these may not always be practical or feasible, or indeed necessary, particularly in the long term. Needs are a lot less aspirational and are often more straightforward to identify and target.
Individuals
4.3 We accept that “individuals” is a broad category, encompassing, for example:
• Different types of employment status (employee, self-employed, unemployed)
• A range of levels of wealth
• Scheme membership status (e.g. occupational trust-based, occupational contract-based, personal pension, no pension scheme, etc)
• Age
• Level of financial awareness and understanding.
4.4 However, in the following table we attempt to identify “typical” needs and wants of pension savers. Our focus here has been on non-high net worth individuals.

Employers

Providers
4.5 In this context, providers could include fund managers, insurers, banks, etc. We look at possible providers in more detail in section 7.

Regulators and industry bodies
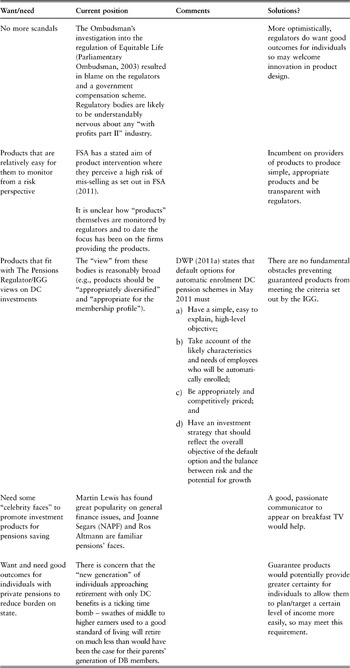
Conclusions
4.6 We conclude that fairly-priced guarantees should have a place in pension savings as they help meet a number of needs and wants of the various interested parties.
4.7 The information in the “individuals” table suggests that there is a clear “need” for well-priced, guaranteed products that provide individuals with a level of certainty and allows them to be passive investors but have confidence in their retirement outcome.
4.8 The ideal “needs” product would offer a guaranteed real level of income in retirement, akin to defined benefit or deferred annuity products. However, experience has shown that these are expensive to provide and this cost would have too much of an impact on returns if charged explicitly to member's accounts under a DC plan.
4.9 A “moneyback” guarantee would also appear to meet most needs and wants and would be a simpler, cheaper guarantee to provide.
4.10 However, to meet wants (and hopes), the expected return on a guaranteed product should be materially greater than that expected by investing in risk-free assets.
5. Methods of managing investment risk and providing guarantees
5.1 Guaranteed savings products are not a new idea. In this section, we first of all look at some of the most common products in the market.
5.2 A number of investment techniques have been developed to manage investment risk and to allow guarantees to be offered into savings products. We then introduce the most popular of these.
5.3 These strategies should be compared with the alternative of investing in risk-free assets such as cash (backed by government deposit guarantees) or government bonds. We do this quantitatively in section 6.
Product: With-profits
5.4 The traditional UK savings product with guarantees was the with-profits product offered by life insurance companies.
5.5 These were long-term contracts, usually with a fixed term. Virtually every UK life insurer sold significant amounts of these products in the 1980s and 1990s. Often these were sold as the repayment vehicle for mortgages (“mortgage endowments”) with 25 year terms or as a pension savings vehicle.
5.6 The contracts contain a minimum guarantee regarding the payout. In addition, the guarantees can be added to during the life of the policy by the declaration of bonuses to reflect excess investment returns.
5.7 One of the main features of with-profits products is that they are generally run on a pooled investment approach. Some of the investment upside is held back to enhance investment returns in poor periods. This is intended to smooth out returns so individuals are not disadvantaged by investment timing issues.
5.8 The key feature of with-profits that allows an insurance company to offer investment guarantees is that the company has almost complete control over the individual policy. The company determines the investment strategy and the levels of payout, subject to the guarantee.
5.9 However, sales declined sharply after the collapse of Equitable Life at the beginning of the century and the recognition of the risks to companies of running these funds. A large number of funds were closed to new members, saw a significant reduction in investment risk (and hence returns) and bonuses were slashed, often to zero. Generally, the public lost trust in with-profits policies and disliked the lack of control of their policies.
5.10 The legacy books of with-profits funds are still huge, though. According to FSA (2010), at the end of 2009, there were around 25 million with-profits policies held by consumers representing £330bn of assets under management (this is down from £420bn at the end of 2005).
5.11 Companies are now required to publish a Principles and Practices of Financial Management (“PPFM”) for each fund setting out their planned management actions, although in practice this has not been particularly successful in winning back public trust.
5.12 Some of the stronger insurance companies continue to write with-profits policies, although the typical investment is now a single premium, 5 year policy with a money-back guarantee.
5.13 Writing new with-profits business is capital intensive for insurance companies. As well as high initial commissions, the levels of capital required to back the guarantees are high. To partially address this, companies have often implemented some of the ideas discussed later in this section, such as lifestyling and CPPI, to reduce the expected cost of guarantees.
5.14 Newer products often have an explicit cost of guarantee charged to policyholders.
5.15 Some practitioners believe that the smoothing feature would be advantageous for DC and may remove the need for guarantees. However, we believe that a smoothing account approach would place a significant burden on the DC provider as it is difficult to run these at “zero-cost”.
Product: Variable Annuities
5.16 With the decline of with-profits, UK insurers sold increased volumes of unit-linked policies as pension saving products. These provide complete control to policyholders who can choose from often hundreds of funds. However, policyholders are completely exposed to any falls in value of those funds.
5.17 Variable Annuities (“VA”) are a wide class of products which can include longevity and withdrawal guarantees but for the purpose of this paper, we focus on the Guaranteed Minimum Accumulation Benefit (“GMAB”) product.
5.18 This is effectively a unit-linked policy with investment guarantees applying at the maturity of the product. Policyholders choose the funds in which they are invested and an explicit fee is charged for the guarantee, depending on the fund(s) chosen.
5.19 The VA market initially took off in the US in the 1990s. Sales have been resilient to market turmoil and assets under management at end Q2 2011 stood at over $1,500 bn, although the vast majority of this includes decumulation benefits. The GMAB product has been very successful in Japan.
5.20 In Europe, and the UK in particular, the market for GMAB has failed to take off. Hartford launched the first UK product in 2005 and were subsequently joined by a number of the major players from the US market. However, Towers Watson (2012b) reports that UK annual sales have remained stagnant at about £1bn per annum between 2008 and 2011 and the Hartford withdrew from the UK market in 2009.
5.21 VA policies have typically only been sold to High Net Worth individuals through IFAs and not been used as part of occupational pension scheme provision in the UK. Charges have therefore been at the higher individual business levels rather than the lower levels that can be achieved in occupational pensions business due to bulk purchasing. The high level of charges is generally stated as the main reason for the lack of market penetration.
5.22 Initially, consumers were offered an enormous choice of underlying funds and the ability to switch funds. This approach caused significant losses for a number of insurers as their hedging programs were based on vanilla indices. The volatility of actual funds was often greater than those of the hedges, causing losses to not be covered.
5.23 In addition, the complex hedging programs put in place used short term derivative instruments and required regular rolling of the hedges. As market volatility increased, these hedging costs increased significantly above the guarantee costs being charged, causing further losses.
5.24 Basis risk and hedge effectiveness are expected to be key determinants of capital requirements for VA products under Solvency II. Therefore, current products are based on considerably less funds.
5.25 In Japan, in many cases, the guarantee is now passed to an investment bank.
5.26 We believe that GMAB could be a mass-market product and that the bulk purchasing power of pension schemes could lead to an acceptable level of fees for the mass-market.
Product: Structured Notes
5.27 Structured notes come in a wide range of formats but are generally characterised by the use of derivatives to transform the risk/return profile of an underlying asset class or basket.
5.28 For example, a protected equity note may provide upside exposure to an equity index but provide a level of protection against downside falls. This protection is either paid for by an explicit fee, giving up some of the upside or giving up equity dividends compared to a normal equity holding.
5.29 These are very popular in the high net wealth individual retail market but their short term nature (often 5y or less) and complexity make them difficult to consider as a key element for the pensions mass market.
5.30 However, structured notes can often be considered as a return of premium plus a potential upside, dependent on underlying asset performance. This concept could be used as the basis for the type of guarantee we are considering.
Technique: Lifestyling
5.31 Under DC, the choice of investment funds is the responsibility of the individual. However, as we discussed in Section 4, a large number of individuals are not able or interested in making such an investment decision.
5.32 DC schemes therefore will almost all have a default fund that any individuals not making a choice will have their contributions invested into. It is normal for this fund to use a lifestyling approach. By definition, the default fund should be an appropriate fund for a wide range of members of a scheme and, as such, there are often “active defaulters” who go into the default option by choice.
5.33 Lifestyling is the term given for investing initially in risky assets, such as equities, and then reducing the allocation to risky assets in an individual's portfolio as they reach retirement. The objective is to give the assets a chance to grow but have a chance to recover from any fall in asset values in the early years and to avoid the impact of such a fall just prior to retirement.
5.34 In its simplest form, lifestyling can move assets into cash and short term bonds to give more certainty over the level of retirement “pot”. Historically, though, it has been more usual to move more into long-term bonds to give more certainty over the level of income achievable from an annuity.
5.35 However, long-term bond yields are currently very low and such a strategy risks locking in low annuity rates or seeing a fall in pot value if long-term bond yields rise.
5.36 Lifestyling is generally carried out by the asset managers to a scheme or fund at an individual member level. However, a group approach is gaining more popularity. Such “target date” funds invest to a certain target date and use a lifestyle approach to invest assets to become available on that date.
5.37 Both lifestyling and target date funds leave the investment risk with the saver, albeit that the investment strategy is defined in advance and, in theory, investment risk is reduced in the latter years. It is often perceived that this is a good default option as it makes what appear to be sensible decisions for those who are unlikely to get engaged in investment decisions.
5.38 However, asset switches are triggered as age limits are hit rather than particular returns achieved so the distribution of final potential returns can still be very wide. We investigate this further in section 6.
5.39 These approaches also expose an individual to last minute decisions to retire early or late, although presumably in a lot of cases, an individual can avoid retiring early if investment conditions are unfavourable and if the retirement deferment is not for too long, it may not be inappropriate to be fully invested in cash or bonds for the additional period.
Technique: CPPI
5.40 Constant Proportion Portfolio Insurance (“CPPI”) is a similar concept to lifestyling in that it involves switching between risky and non-risky assets. However, the allocation is dynamic, ie it depends on market conditions rather than fixed changes, and it is typical for a savings product using CPPI to incorporate a maturity guarantee.
5.41 The percentage allocated to each asset class depends on the ‘cushion value’ (defined as current portfolio value minus guarantee value) and a multiplier co-efficient. The multiplier coefficient reflects the risk level of the strategy. It is typically derived by a view on the maximum potential loss on the risky assets in one day. The coefficient is the inverse of that percentage.
5.42 For example, if the view is that the maximum ‘crash’ loss is 20%, the multiplier will be 5. If the guarantee value is set at 90% of the initial value and the multiplier is 5, then the strategy would initially invest (100%–90%)*5 = 50% in the risky asset with the rest in the non-risky asset.
5.43 Typically, this calculation will be carried out daily and the fund re-balanced accordingly. This approach is guaranteed to hit a minimum of 90% at maturity as long as the daily performance is never lower than the maximum crash level, 20% in this example.
5.44 A company offering such a guarantee will lose money if such a crash happened. It is therefore typical for such a company to buy protection for this risk from an investment bank.
5.45 A common alternative approach is to provide an open-ended ratchet guarantee, where the guarantee represents a percentage (usually lower than that guaranteed just at maturity) of the highest daily fund value since investment and applies daily (ie the investor doesn't have to invest for a fixed period).
5.46 The major risk for investors is monetisation leading to poor returns. Monetisation is the term used to describe the scenario when the risky assets have fallen significantly in value and so the CPPI mechanism invests the fund virtually all in the non-risky assets to meet the minimum guarantee. The return on the non-risky assets is generally low but the fund still attracts high fee levels and so offers poor value compared to equivalently invested funds. Also, fund values have fallen but the fund has disinvested and so will miss out on any rebound in value of risky assets, hence locking in losses.
5.47 This happened to a lot of CPPI funds after the credit crunch. It was common for insurers to offer new series of these products to enable investors to remain invested in risky assets, albeit at lower guarantee levels.
5.48 The risk to the provider of issuing CPPI products is low (ignoring any operational risk) and is limited to the remote “crash” risk. With-profit funds have been known to apply such an approach to reduce guarantee costs.
5.49 In the individual retail space, CPPI was sold extensively in the early to mid part of the “noughties” as a replacement guaranteed product to with-profits. These are still sold now, but less so due to the recognition of the monetisation risk, and it is normal for the crash risk to be sold to an investment bank. They are not currently used in the UK pension scheme arena.
Technique: Volatility Targeting
5.50 Volatility Targeting is a similar approach to CPPI but aims to minimise monetisation risk.
5.51 The allocation between the risky and non-risky asset class is determined by reference to short-term realised volatility (often 1 month) and a volatility target. The underlying assumptions are that recent volatility is a good predictor of future short-term volatility and that volatile assets underperform and so you want to be underweight when assets are volatile.
5.52 For example, if the volatility target is 12% and recent volatility of the risky asset has been 20% and the recent volatility of the non-risky asset is 4%, then the allocation would be 50% in the risky asset and 50% in the non-risky asset. If the risky asset volatility increases to 24%, then the allocation to the risky asset falls to 40%.
5.53 If the assumption holds, the strength of this approach is that it should reduce your exposure to risky assets at the time when a crash is most likely but get you back into the risky assets when markets have calmed down again.
5.54 The other big advantage is that volatility targeting can be applied across many asset classes, not just two. Therefore, individuals can choose from a wide range of asset classes and funds that they would like to invest in and the manager applies the approach to those funds.
5.55 However, this approach does not naturally provide a guarantee to investors. The risk to investors is that the allocation process does not protect them against a market fall or misses a sharp market rise.
5.56 To mitigate the first risk, it is common for investment banks to offer a guarantee on volatility target funds. As the volatility of the fund is “controlled”, the banks will offer this protection cheaper than on a normal balanced fund which can be passed on to customers in terms of lower guarantee funds.
5.57 To date, Volatility Target funds have not seen widespread take-up. One of the major concerns seems to be whether the concept is too complex and difficult to communicate (we consider this in section 7).
5.58 However, it can be argued that such an approach helps an advisor meet client suitability requirements as it enables them to discuss maximum expected fund value falls.
5.59 Such an approach may also be a sensible default option for a DC pension scheme where an individual may not be engaged enough to switch out of risky assets when markets are increasingly volatile.
5.60 We note that NEST intends to use volatility-controlled funds and so the use of expected volatility as a risk measure and input to asset allocation may become more common.
6. Quantitative analysis of investment approaches
Introduction
6.1 In section 5, we identified a number of different investment techniques that have been designed to reduce investment risk. We wanted to see how successful these approaches are expected to be in doing this. Clearly, if these approaches remove all downside investment risk at an appropriate cost in terms of return, there is no need for guaranteed products. To compare the relative values of various approaches, we have used a stochastic model to calculate the expected distributions of DC pot values at retirement.
6.2 We have focused on expected return, the probability of beating risk-free returns and the probability of capital loss (defined as the final pot being less than the total amount of contributions). As discussed in section 4, we believe that the expected return of a strategy needs to be materially in excess of risk-free (probably at least 1/3rd of the assumed equity risk premium – in this case 1% pa).
6.3 The approaches that we modelled were fixed asset allocation, lifestyling, CPPI and volatility targeting.
6.4 Guarantees could also theoretically be written around these strategies and we also look at how much excess return could be available to fund a guarantee whilst still meeting our performance targets.
Model used
6.5 We chose to model each of these strategies using just two asset classes – equity and risk-free assets. The model used stochastic equity price movements, stochastic equity volatility and fixed deterministic risk-free rates
6.6 The key assumptions used were:
• Risk-free returns = 3% pa
• Equity risk premium = 3% pa
• Equity volatility = 20% pa
• Correlation between equity price movements and equity volatility = −75%
6.7 For the fixed asset allocation strategy, we assumed a fixed allocation of 50% in equities and 50% in risk-free.
6.8 For lifestyling, we assumed a fixed asset allocation until 10 years before retirement when the holding in equities was reduced linearly to zero at retirement. We examined three levels of initial equity allocation – 100%, 75% and 50%. Risk-free assets have no market value volatility.
6.9 For CPPI, we assumed a multiplier of 5 and a maximum investment cap in equities of 100% (i.e. no leverage)
6.10 For calculating the equity exposure in the volatility targeting strategies, we assumed a volatility of risk-free assets of 4% pa. We examined a fixed 12% volatility target strategy and also a lifestyled volatility target approach. Under the latter, we assumed that the volatility target was 7% for 10 years (if the initial outstanding term was greater than 30 years), 12% until 8 years to go and then reducing linearly to 4% at retirement.
6.11 We assumed a fixed AMC of 20bps per annum for each strategy, including the risk-free investment comparison. We recognise that this might be challenging for some of the dynamic strategies but wanted to show a best case scenario for the “non-guaranteed” strategies to ensure we did not over-state any downside risk.
Regular Contribution Results
6.12 DC members can be invested for a long time and it is most typical for contributions to be regular in nature as they are often taken as a deduction of salary. For a new entrant into the workforce, their working lifetime could be in excess of 40 years. Therefore, we have firstly looked at some of the strategies without guarantees for members paying regular contributions for 40 years.
6.13 For a variety of reasons (new job, automatic enrolment, etc), members could also join schemes at older ages. We have therefore also looked at the same strategies for regular contributions paid for 10 years and 20 years. For simplicity, we have assumed level contributions (i.e. zero wage inflation).
6.14 The results of our modelling are shown as follows:

6.15 It can be seen that, for a member paying regular contributions for 40 years, each of the non-guaranteed strategies investigated produces strong expected returns over risk-free (2.8% per annum after charges) and most of the strategies have only a small risk of returning less than the contributions paid.
6.16 Over the 20 year investment period, it can be seen that most of the strategies now have a material probability of not returning more than contributions.
6.17 Over 10 years, there is a split of strategies between those which maintain a significant amount of risk and those which are generally de-risking strategies. The former have higher expected returns but material probabilities of loss whereas the latter have lower expected returns and correspondingly lower probabilities of loss.
Single Contribution Results
6.18 Whilst it could be expected that members will make pension contributions throughout their working lives, a provider will need to ensure that any strategy also works for flexible contributions as a member is not contractually obliged to stay with that provider and /or could change employer or employment status, for example.
6.19 In addition, a provider will want to be able to offer to receive significant pots built up with other providers and one-off payments.
6.20 At the other extreme of this flexibility from regular contributions are single contributions. We therefore have tested the same strategies over the same periods for single contributions.
6.21 The single contribution results are as follows:

6.22 The single contribution results provide similar results to the regular contribution results, although some of the probabilities of capital loss are slightly higher.
6.23 We conclude that comparisons between strategies will not be invalidated by differences caused by contribution flexibility.
Guaranteed Products
6.24 We have seen that, for a number of the strategies and terms we have investigated, the expected return is greater than risk-free + 1% per annum but the probability of capital loss is non-zero.
6.25 For those strategies, it would be possible to increase the AMC to include a guarantee charge and still meet our performance targets.
6.26 In the analysis below, we have shown the maximum charge that could be used to cover an explicit guarantee charge and possibly higher management charges yet still meet the performance targets. We have then re-run the strategies using these increased charges and assuming a money-back guarantee to see the impact on the metrics.
6.27 Clearly, if lower charges are used, the metrics would be improved.
6.28 The results are as follows:

6.29 By definition, the existence of the money-back guarantee removes the probability of capital loss. As would be expected, the increased charge level reduces the probability of beating risk-free returns but, by design, the expected return is approximately equal to the risk-free rate (net of fees) + 1% pa.
Conclusions
6.30 We have investigated a number of different investment strategies. Under our model, for all combinations of strategies and contribution terms, there is a risk that the member gets back less than their contributions. However, this risk is small for some of the less risky strategies, especially over 40 years. For an individual entering in their twenties, a “money back” guarantee at retirement may not have much value.
6.31 For shorter investment periods, it is necessary to incorporate a guarantee to materially remove the material risk of getting back less than the amounts contributed.
6.32 Naturally, the cost of such a guarantee would reduce the expected return and also the probability of beating risk-free returns. We look in the next chapter at the practical challenges of providing such a guarantee. We do not conclude whether a guarantee is needed as this will be a function of the value placed by a member on the guarantee relative to the impact on their returns and the cost required by the provider to provide such a guarantee.
6.33 However, it does appear that there is some scope to enable a guarantee charge to be levied in conjunction with some strategies and yet still achieve an expected return materially in excess of risk-free returns.
7. Practical issues
Introduction
7.1 We have concluded in section 6 that, theoretically, by looking at available excess return, there is some scope for providers to offer a money-back guarantee.
7.2 In this section, we look at some of the practical issues surrounding the offering of such a guarantee.
Possible providers
7.3 There are a number of different types of providers who could provide such a guarantee. We discuss the main possible parties below.
7.4 Employers could offer the guarantee in a similar way that they provide defined benefit schemes to members. This is the position in Germany for Pillar 2. However, this would require DB-like governance which we believe is too onerous for the majority of small to medium employers.
7.5 Insurance companies are natural providers of savings guarantees and could offer the guarantee to the member through an insurance contract. It is likely that these arrangements would be determined on a group basis by the employer. This is the situation in Denmark for Pillar 2 and also in a number of countries for Pillar 3.
7.6 Banks also offer savings products with guarantees but these are often shorter in term than those offered by insurance companies. It may be more natural for banks to participate behind other providers in helping them manage the risk taken on.
7.7 Asset managers are not able to directly offer the guarantee but could package up the investment management and risk reduction products (see below) to provide a product that has an embedded guarantee provided by a third party.
7.8 Ultimately, any pension provision shortfall will fall onto the government so the government could see offering a money-back guarantee as taking from one hand to pay the other and hence cost-neutral. However, public pension liabilities in the UK are already very high and adding to these is unlikely to be palatable.
7.9 In the UK, the Pension Protection Fund exists to guarantee benefit promises to members of DB schemes. It is funded by levies from existing schemes. It is possible that an equivalent structure could be set up to meet DC guarantees.
Capital
7.10 Any provider who offers an investment guarantee is taking on investment risk. Such risk needs to be mitigated, passed on or capital held against the investment risk to minimise the risk that the guarantee is not provided to the individual.
7.11 Pension schemes are required to target holding assets equal to the value of their liabilities whereas insurers are required to hold assets equal to the value of their liabilities plus hold additional capital to provide a buffer against any risks that the liabilities will not be able to be met.
7.12 For an insurance company, the amount of capital required to cover a guarantee will depend on the expected cost of providing the guarantee and the expected charges that will be received to meet that guarantee.
7.13 Assuming that the guarantee charge is priced correctly, it would be expected that the level of capital needed at the point of writing the guarantee would not be significant as the expected guarantee cost should be covered by the guarantee charges, even after allowing for a prudent level of transfers and market falls. However, this capital could increase significantly over time if markets fall or the expected cost of providing guarantees rises and risks have not been mitigated.
7.14 The level of capital that might have to be held will have an impact on the level of the guarantee charge that an insurer will apply as holding regulatory capital has a cost to the insurer.
Risk reduction methodologies
7.15 To reduce the level of investment risk and amount of capital to be held, pension schemes and insurers often look to use derivative instruments to transfer risk to investment banks.
7.16 There are two standard approaches for doing this – “delta-hedging” or purchasing put options.
7.17 Delta-hedging involves purchasing short-term derivative contracts so that the provider is neutral to short-term changes in investment market levels. This strategy requires regular re-balancing of the derivative contracts held and is probably only appropriate for larger insurance companies.
7.18 The major risk to the provider of delta-hedging is that the re-balancing costs money and the price of the derivative instruments fluctuate. This is most noticeable in volatile markets. Therefore, the cost of the hedging is unknown in advance and this can lead to losses if a fixed guarantee cost has been offered.
7.19 To pass on this uncertainty, a provider can purchase put options from an investment bank. However, it should be noted that the option market is limited in size beyond 20 years and so it is unlikely that a provider will be able to buy put options that exactly match any guarantees written with terms longer than 20 years. Rolling put strategies could be used but these will also involve some uncertainty of cost.
7.20 If a provider wishes to fully pass on the guarantee risk to an investment bank, it may be necessary for the guarantee to be limited to the consolidation phase. However, this could be appropriate as it will offer protection to pots once they have reached a significant size and provide some retirement pot certainty, regardless of future contributions and market movements.
7.21 Similarly, protection could be offered only for the foundation phase to ensure that savers do not see capital losses on their initial contributions to encourage further saving.
7.22 Another significant risk is basis risk. Most of the derivative contracts that can be purchased in significant size are based on the most liquid indices. If the investment funds offered are not based on the same indices, then there is a risk that the funds fall but the derivative contracts do not provide the required level of protection. This was a major cause of loss for insurers selling variable annuities. We therefore expect any guaranteed DC product to be based on index funds and for the asset allocation to be controlled by the fund manager following set allocation rules.
7.23 A connected major issue to be addressed is whether a fixed guarantee cost can be offered for all future contributions. The expected cost of providing a guarantee will vary over time due to views on future volatility, interest rates and the term of the guarantee. This will be most noticeable for a provider buying put options who will find that they will vary in price over time.
7.24 As future contributions are uncertain (due to wage inflation, employment levels, additional contributions etc), offering a fixed guarantee cost through time may not be practical as it may leave the provider open to too much risk. However, a variable guarantee charge may not be acceptable to members, especially if it is difficult to change providers (see below).
7.25 Clearly, any risk mitigation with a third party introduces a counterparty risk. However, in most cases, any such agreements will be fully collateralised.
Portability/consolidation
7.26 The labour market is considerably more fluid these days than when pension schemes were first established. It is not unusual for individuals to have more than 10 employers during a career.
7.27 This creates challenges for the pensions industry. An employer would rather not be running small pots for every employee it has ever had, regardless of when they left. An employee is unlikely to want to have a large number of small pots to keep track of. Therefore, an ability to consolidate small pension pots seems a necessary requirement and the DWP consulted on this topic in December 2011 (DWP, 2011b).
7.28 The potential existence of funds with money-back guarantees complicates this further. If markets have fallen, the existence of a guarantee could be very valuable to the member. If the member wishes to transfer that guarantee to a new provider (say because their new employer does not have an arrangement with the same insurance company), then the new provider would require some form of transfer value compensation to take on the guarantee.
7.29 Equally, a provider that has bought a put option to hedge a guarantee needs the future guarantee charges to pay for that option. If an individual leaves, and markets are up when the provider looks to unwind the option, the provider will be out of pocket. It will need to be compensated via either a transfer value from the new provider or a surrender value applied to the member's account.
7.30 Portability and consolidation issues can be reduced if the number of providers is limited. We have seen the emergence of industry and sector super-schemes in many countries.
7.31 These issues have been addressed differently in the countries where guarantees exist. In Germany, the guarantee is cancelled if the employee transfers provider. In Switzerland, the guarantee applies on transfer as well as retirement although this has led to risk-free investment. In Denmark, the compulsory Pillar 1 guarantees are provided only by ATP.
7.32 Ultimately, the portability and consolidation issues can be removed if the government is the only provider and such money-back guarantees were compulsory.
7.33 The government may have to legislate or provide guidance to enable a common solution to be found across the industry and allow true portability.
Retirement age uncertainty
7.34 Individuals are currently requiring greater flexibility in retirement dates. This could potentially cause issues for providers who are offering a fixed point money-back guarantee if the individual changes their retirement date.
7.35 We feel that this can be solved mainly through effective communication and advice. A member retiring earlier than expected needs to understand that they would be giving up the guarantee if they took the pot early and the implications of such an action. A member choosing to work later could take the guaranteed pot and invest it appropriately to reflect their requirements at that point of time.
Administration
7.36 As discussed earlier, there is an increased administration burden if consolidation is not a key feature of the market.
7.37 For providers providing guarantees, the variability of the guarantee charge will have an impact on the amount of administration. If the guarantee charge can vary, the provider will need to break down the individual member accounts into sub-accounts for each different guarantee charge and then re-aggregate those sub-accounts for communication purposes. This could create significant challenges, both for administration and communication.
Education
7.38 A number of the products described in this paper are complex. This not only brings communication challenges in relation to customers (in this context, scheme members, see next section below) but also to advisors (including employers and providers). Advisors across the spectrum will need to be comfortable and familiar with the products before they consider recommending them to their clients. This process will not happen overnight.
7.39 In order for the market for guarantee products to gain the bulk buying power needed to provide them at acceptable cost, advisor buy-in will be crucial.
Communication
7.40 The Consumer Information Working Party (Ritchie et al. Reference Ritchie, Corrigan, Graham, Hague, Higham, Holt, Mowbray and Robinson2012) has recently carried out some very good work on how to engage better with customers. Some of their relevant key proposals were that
• Advice needs to be provided supplemented by engaging information;
• Need to communicate risk and reward by reference to chance of achieving consumer's goals; and
• On-going discussions throughout the duration of investments.
7.41 We fully agree with these findings and believe that the existence of a money-back guarantee could assist in improving communication. A floor is an easily understood concept and could remove some of the potential disappointment in downside scenarios for other strategies.
7.42 It is clear that some of the underlying strategies are complicated but we believe the use of volatility controlled strategies by NEST will aid in these becoming more mainstream.
7.43 The existence of a money-back guarantee should also make communication easier during periods of short-term volatility because the provider can point to the existence of the guarantee to reduce concerns.
8. Conclusions
8.1 We note that there is widespread use of guaranteed products in DC offerings around the world but not in the UK. We welcome the increased publicity given to the debate by the Pensions Minister.
8.2 We believe that a well priced money-back guaranteed DC offering meets a large number of the needs and wants of individuals and other parties and therefore there should be a place for such a product.
8.3 However, we believe that it is critical that a guaranteed product should still aim for returns better than risk-free and not just target the guaranteed return.
8.4 A number of investment techniques have been developed in recent years to allow investment performance in a risk-controlled manner. Our analysis suggests that by using some of these techniques, providers can minimise the downside risk of offering guarantees. Hopefully, this will enable providers to be able to offer guarantees at a level of charge that still allows expected returns to be above risk-free returns and with the additional benefit of the guarantee.
8.5 There are a number of practical issues for providers of a money-back guarantee. We believe that a number of these can be solved by improved communication between providers and individuals, and in particular, by a stronger focus on outcomes based analysis.
8.6 However, the biggest issue is likely to be in connection with changes of provider and transferability of guarantees. It may be that regulation is required to address this.
8.7 The low level of downside risk being transferred and the lack of a liquid long-term option market may preclude a lifetime “money-back” guarantee for new, younger entrants to the labour market. However, protection could be offered during either a “foundation” or “consolidation” phase that may still meet the majority of the needs and wants of a full “money-back” guarantee.
9. Acknowledgements
9.1 The opinions expressed in this paper are the authors’ personal views, rather than those of our employers.
9.2 We would like to acknowledge the many helpful comments received from both colleagues and peers. However any errors or omissions remain the authors own.
9.3 We would particularly like to thank Andrew Slater, Jenny Holt, Keith Feldman, Andrew Lill, Kevin Telfer and Hugh Cutler for their input into the Working Party.

