


Introduction
The conservation and management of threatened species is greatly aided by knowledge of fine-scale distribution and occurrence patterns (Crates et al. Reference Crates, Terauds, Rayner, Stojanovic, Heinsohn, Ingwersen and Webb2017, Marinho et al. Reference Marinho, Bezerra, Antongiovanni, Fonseca and Venticinque2018). Delineating fine-scale distribution is crucial to direct on-ground management efforts to where they will be most effective, allocate monitoring effort to the right areas, and determine habitat requirements. This can be challenging for species that are mobile, wide-ranging, occur at low density, and/or are patchily distributed, as gathering a sufficiently large dataset is often time consuming and expensive (MacKenzie et al. Reference MacKenzie, Nichols, Sutton, Kawanishi and Bailey2005, Runge et al. Reference Runge, Martin, Possingham, Willis and Fuller2014).
Birds are mobile and often use large areas of habitat daily, which can present challenges in identifying habitat preferences and subsequently ensuring their conservation (Hayes and Monfils Reference Hayes and Monfils2015). The Alligator Rivers Yellow Chat Epthianura crocea tunneyi is a locally nomadic species that inhabits alluvial coastal and subcoastal grassy floodplains of large tidal rivers in a restricted area between Darwin (12.46°S, 130.85°E) and Gunbalanya (12.33°S, 133.06°E) in the Northern Territory, Australia (Higgins et al. Reference Higgins, Peter and Steele2001, Kyne and Jackson Reference Kyne and Jackson2016). The Alligator Rivers Yellow Chat is poorly understood, with great uncertainty about its status, range, and habitat preferences. Due to seasonal inundation, habitat is difficult for observers to access for much of the year, meaning the subspecies is seldom encountered. There have only been two surveys of this taxon, both within Kakadu National Park (NP; 13.09°S, 132.39°E), the first covering a loosely specified area (Armstrong Reference Armstrong2004) and the second focusing on a hotspot of sightings from the first (Armstrong Reference Armstrong2004, Kyne and Jackson Reference Kyne and Jackson2016). Floodplain habitat outside Kakadu NP makes up more than half of the taxon’s historical range, but has never been formally surveyed, and it is likely that there is also unsurveyed habitat within Kakadu NP. To inform on-ground conservation management for the Alligator Rivers Yellow Chat, there is a need for research on the chat’s status, distribution, and habitat preferences, and for the establishment of robust monitoring programmes (Garnett et al. Reference Garnett, Szabo and Dutson2011, Woinarski and Winderlich Reference Woinarski and Winderlich2014).
Previous surveys of the Alligator Rivers Yellow Chat showed that fewer birds were encountered in the second survey (Armstrong Reference Armstrong2004, Kyne and Jackson Reference Kyne and Jackson2016). In the absence of more robust monitoring and range-wide searches, this led the authors to suggest a decline (Kyne and Jackson Reference Kyne and Jackson2016). This built on anecdotal evidence that chats were at one time more commonly seen on the South Alligator floodplain than they are today (Garnett et al. Reference Garnett, Szabo and Dutson2011). The subspecies was classified under Australia’s national environmental legislation as ‘Endangered’ due to a small and declining population (<2,500 mature individuals) with a small and fragmented area of occupancy (Threatened Species Scientific Committee 2006). Based on expert elicitation, the chat has been given a 15% likelihood of becoming extinct in the next 20 years (Geyle et al. Reference Geyle, Woinarski, Baker, Dickman, Dutson, Fisher and Kutt2018) and has been flagged as one of the 20 Australian bird taxa most in need of conservation action (Department of the Environment and Energy 2015). However, the very limited knowledge of this subspecies means the confidence in these estimates is low.
The habitat of the Alligator Rivers Yellow Chat has been coarsely characterised as the alluvial coastal and subcoastal grassy floodplains of large macrotidal rivers (Higgins et al. Reference Higgins, Peter and Steele2001, Armstrong Reference Armstrong2004, Kyne and Jackson Reference Kyne and Jackson2016). These low-lying floodplains undergo seasonal inundation in the northern Australian wet season (approximately November–April) and dry out in the dry season (approximately May–October), at which time they frequently burn both prescriptively and from wildfire (McGregor et al. Reference McGregor, Lawson, Christophersen, Kennett, Boyden, Bayliss and Andersen2010). Chats feed in small groups, pursuing invertebrates on the ground, moving between sparse low-lying vegetation including shrubs, grasses, sedges, and forbs (Higgins et al. Reference Higgins, Peter and Steele2001). Past studies have noted a strong association between chat occurrence and shrubs of the genus Sesbania, a relatively tall (to 3 m) floodplain shrub, and the fringes of floodplain channels and depressions (Armstrong Reference Armstrong2004, Kyne and Jackson Reference Kyne and Jackson2016).
The Alligator Rivers Yellow Chat faces a range of potential threats (Garnett et al. Reference Garnett, Szabo and Dutson2011). These include habitat destruction by feral herbivores (Skeat et al. Reference Skeat, East and Corbett1996, Mitchell et al. Reference Mitchell, Dorney, Mayer and McIlroy2008), altered fire regimes (Woinarski Reference Woinarski and Gill1999), invasive plants (Cowie et al. Reference Cowie, Short and Osterkamp Madsen2000), and sea-level rise (their floodplain habitat is partially tidal and on average just 1.5 m above sea-level) (Bayliss et al. Reference Bayliss, Saunders, Dutra, Melo, Hilton, Prakash and Woolard2018). Clarifying the influence of these threatening processes is needed to improve chat conservation by allowing for more targeted mitigation of such threats, especially as land management budgets are constrained. Threatening processes can be inferred through studies of spatial habitat-use, based on the assumption that a species is less likely to occur in areas where conditions (e.g. feral animals, fire, weeds) are or have been less favourable (MacKenzie et al. Reference MacKenzie, Nichols, Sutton, Kawanishi and Bailey2005). While caution should be applied when inferring temporal processes from spatial patterns (MacKenzie et al. Reference MacKenzie, Nichols, Royle, Pollock, Bailey and Hines2006), in the absence of more reliable information this type of information can at least focus inquiry and help define the limits of the hypotheses of future studies.
In this study, we conducted the first broad-scale survey across the known range of the chat, with the major aims being: 1) to determine habitat use of floodplains in the dry season across a range of land tenures; 2) to assess the influence of a range of environmental factors and landscape position on the probability of occupancy; and 3) to estimate detection probability for improved occupancy estimates. Occupancy – the probability that an area of interest is occupied by a taxon – is a commonly used metric that can be employed to estimate where the taxon occurs (MacKenzie et al. Reference MacKenzie, Nichols, Lachman, Droege, Andrew Royle and Langtimm2002, 2006), and is frequently used in the study of bird-habitat relationships (West et al. Reference West, Keyser, Lituma, Buehler, Applegate and Morgan2016, Crates et al. Reference Crates, Terauds, Rayner, Stojanovic, Heinsohn, Ingwersen and Webb2017, Glisson et al. Reference Glisson, Conway, Nadeau and Borgmann2017). Improving our understanding of where chats occur and identifying associations between chat occupancy and management levers such as fire, feral species, and weeds can help guide land managers to reduce the impact of threatening processes. The results can inform the design of a species-specific monitoring programme to identify trends in population, assess the success of future conservation actions, and inform future management (Lovett et al. Reference Lovett, Burns, Driscoll, Jenkins, Mitchell, Rustad and Haeuber2007, Martin et al. Reference Martin, Kitchens and Hines2007).
Methods
Study area
The study area encompassed the 4,599 km2 floodplains of the Adelaide River, Mary River, Wildman River, West Alligator River, South Alligator River, and East Alligator River which lie between Darwin (12.46°S, 130.85°E) and Gunbalanya (12.21°S, 133.02°E), Northern Territory, Australia (Figure 1). These floodplains comprise the vast majority of the entire known range of the Alligator Rivers Yellow Chat.

Figure 1. Map of the study area and survey sites showing the floodplains (textured areas) of: Adelaide River (A); Mary River (M); Wildman River (W); West Alligator River (WA): South Alligator River (SA); and, East Alligator River (EA), by land use.
Land tenure of these floodplains is split between pastoral (cattle) (1,969 km2) and conservation (2,630 km2), which includes Kakadu NP (managed by Parks Australia) and several smaller National Parks and Reserves (managed by the Parks and Wildlife Commission of the Northern Territory; PWCNT), and Aboriginal managed lands of Arnhem Land. These floodplains are largely inaccessible by ground; with roads providing only limited access to their fringes.
Site selection
We generated a set of predetermined sites to guide survey effort across the study area. We selected sites firstly by using Geographic Information System software (ArcGIS; Environmental Systems Research Institute, Redlands, CA) to generate 500 random points across the entire area of the floodplains. In order to increase the likelihood of detecting chats, we used satellite imagery to stratify 200 of these random sites to within a 200 m radius of hydrogeological features such as lagoons or depressions, as these features matched descriptions of chat habitat found in the literature (Higgins et al. Reference Higgins, Peter and Steele2001, Armstrong Reference Armstrong2004, Kyne and Jackson Reference Kyne and Jackson2016). Secondly, we downloaded waypoints of all historical chat records from the Atlas of Living Australia (ALA: http://www.ala.org.au), which included records from the two previous targeted surveys (Armstrong Reference Armstrong2004, Kyne and Jackson Reference Kyne and Jackson2016). We revisited as many of these historical records as were accessible to resurvey (total 25 sites). We viewed all predetermined sites in ArcGIS and, to reduce spatial autocorrelation, several were omitted such that no two sites were closer than 200 m. Some predetermined sites could not be sampled because they proved to be inaccessible due to logistical issues such as flooding or permitting.
In addition to preselected sites, we also performed surveys opportunistically, notably at sites where ostensibly suitable habitat (from descriptions in Armstrong Reference Armstrong2004, Kyne and Jackson Reference Kyne and Jackson2016) was present or chats were encountered (with such opportunities taken partly because we recognised there were likely to be few presence records across the predetermined site sampling). If chats were encountered incidentally, we placed a site at the exact location at which the chats were observed. Floodplain searches for chats were occasionally guided by tip-offs from ranger groups who believed they had seen chats in a certain area. When these tip-offs were to particularly remote areas of floodplain, often no random site surveys could be performed in that area, as the extensive travel time to such sites prevented time-consuming random site surveys. A total of 257 sites were sampled across five floodplains and two years (Table 1, Table 2). Survey effort was not evenly distributed spatially or temporally across the study area due to access limitations (Table 1, Table 2).
Table 1. The spatial and temporal distribution of sites used to survey for Alligator River Yellow Chats.
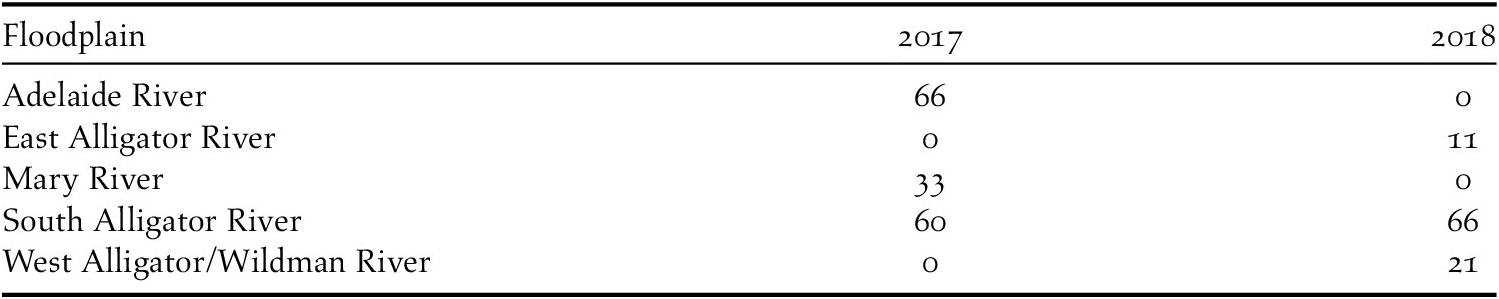
Table 2. The mode of site selection and the number of sites surveyed for Alligator River Yellow Chats.

Site surveys
All results reported relate to habitat associations for the late dry season as sites could only be accessed from July to December 2017 and from August to December 2018. During other months of the year the floodplains were inundated and inaccessible to the all-terrain vehicle (Polaris Ranger) used to access survey points. At each site, we undertook a four-part survey: 1) 400-m transect search for chats; 2) 100-m transect survey of topsoil damage caused by feral ungulates (primarily pigs); 3) vegetation survey in a 5 x 5 m quadrat; and 4) a 4-ha fire and vegetation assessment (Figure 2). The results of surveys 2–4 were used to generate variables for the occupancy modelling (Table 3). Surveys 1, 2, and 4 were conducted by the same observer (RL).

Figure 2. Sampling protocol implemented at each site showing the two 200-m transect searches for chats, the 100-m transect search for topsoil damage caused by feral pigs, the 5 x 5 m quadrat for the vegetation survey, and the 4-ha fire and vegetation assessment, represented by the entire grey textured area. The area searched for chats is also represented by the grey textured area,
Table 3. Variables recorded at each site. *variables recorded within the 5 x 5 m quadrat; **variables recorded within the 4-ha site.

We conducted the search for chats (survey 1) along two 200-m parallel transects that were 100 m apart. We started the first transect at the site coordinates and proceeded north, the second transect began 100 m east of the end of the first transect and proceeded south. We searched the 50 m either side of each transect line so, when combined, each survey for chats searched a 4-ha rectangle of floodplain. The surveyor did not leave the transect line during the search. Each transect search took 8–20 minutes, depending on terrain and the number of birds present.
We performed an estimation of feral pig damage (survey 2) to topsoil (e.g. rooting, wallowing) along a 100-m transect that began at the end of the first transect search for chats and proceeded in an easterly direction, ending at the beginning of the second transect search for chats. We appraised the 5 m on both sides of the transect to estimate what percentage of the 10 x 100 m area was affected by feral pig damage, in categories of 0, 1–25%, and 26–100%.
We conducted a 5 x 5 m vegetation survey (survey 3) as close to the exact site coordinates as possible according to a handheld GPS. We recorded the percentage cover, height, and name of each plant species, as well as evidence of the presence of feral animals, whether any part of the quadrat had been burnt that season, and the percentage of bare ground. The type, number, and distance from the quadrat of any visible feral mammals (e.g. buffalo, pigs, horses, cattle, cats) was recorded. As well as the quadrat survey, we assessed the vegetation in the entire 4-ha site (survey 4). Variables recorded included whether any part of the 4-ha site was burnt and an estimate of the number of stems of woody shrubs in the 4-ha site area (Table 3).
When chats were detected, we performed a total count, and where possible, counts by sex and maturity. To account for chats being present at a surveyed site but not being detected by the surveyor (i.e. a false absence), we searched approximately every 8th unoccupied site and every third occupied site three times, 30 minutes apart on the same day. We used detection histories from these repeat visits to estimate chat detection probability (see Statistical Analysis below).
Fire history
Fire maps of Kakadu NP were provided by the Darwin Centre for Bushfire Research. To characterise the fire history over the rest of the study area, we obtained all available Landsat (30 x 30 m resolution) satellite imagery from 1988 until 2018 sourced from the United States Geological Survey (USGS) database. In the GIS program ArcMap we viewed annual sets of true colour images to select those that were largely cloud-free. We mapped burned areas through an interactive process of 1) manually thresholding difference indices, then 2) on-screen editing of commission errors from the vectorized outputs. Indices utilised were the normalised burn ratio, and mid-infrared burn index. These indices incorporate the near infrared and short-wave infrared spectral regions and are sensitive to variations in soil moisture and leaf water content (Xu Reference Xu2006, Wang and Qu Reference Wang and Qu2007, Reference Wang and Qu2009) so are effective in highlighting burned areas (García and Caselles Reference García and Caselles1991, Pereira et al. Reference Pereira, Sá, Sousa, Silva, Santos, Carreira and Chuvieco1999, Pleniou and Koutsias Reference Pleniou and Koutsias2013). However, as they are confounded by changes in the presence of surface water (e.g. inundation or drying of the floodplains, tidal movement), vegetation change as the floodplains dried out, and clouds and cloud shadows, highlighted areas were cross-checked against corresponding true-colour images and all areas that were not burn scars were manually discarded. Differenced image pairs were a maximum of 48 days apart, as longer time periods made burn scars too difficult to discern visually. We then converted highlighted areas to polygons and combined with all the other polygons for that year, resulting in 31 fire maps representing where fires had burnt in the study area each year.
We then used the ArcMap function ‘intersect’ to calculate which sites were within the generated burn scars in each year. This fire mapping technique was ground-truthed, using the 2017 and 2018 fire maps with on-ground data collected during field work and we found that fire maps corresponded to on-ground observations 85% of the time.
Annual burn scars were used to calculate two fire metrics: 1) time since fire, being the number of years since sites were recorded as burnt; and 2) fire frequency, being the number of times a site was recorded as burnt within a set time horizon. We considered several time horizons (3-year, 5-year, 8-year, 11-year, and 18-year), given lack of previous knowledge about which time scale fire history would have the most effect on the suitability of a site for chats. As suitable Landsat imagery was not available for the entire floodplain for 10 of the 30 years, fire maps outside of Kakadu NP were partially supplemented with data from the Northern Australia Fire Information (NAFI) service (MODIS satellites, 250 m x 250 m resolution).
Statistical analysis
Naïve occupancy is the probability that a randomly selected site or sampling unit in an area of interest is occupied by a species and is calculated by dividing the number of occupied sites by the total number of sites searched (MacKenzie et al. Reference MacKenzie, Nichols, Royle, Pollock, Bailey and Hines2006). Estimates of occupancy are improved by calculating detection probability, which is the probability that a species will be detected if present at a site (MacKenzie et al. Reference MacKenzie, Nichols, Lachman, Droege, Andrew Royle and Langtimm2002). We modelled chat occupancy incorporating detection probability at 257 four-hectare sites across the survey area. As the spatial scale of the survey site (4 ha) is probably smaller than that of the home range of the chat, we considered occupancy to represent the probability of use of a site, as recommended by McKenzie (Reference MacKenzie, Nichols, Royle, Pollock, Bailey and Hines2006). Whilst some birds may be recounted if they move between survey sites, their presence at a site still represents that the site is used, and therefore occupied by chats.
We tested categorical variables (Table 3) for multicollinearity using the R code “HighstatLib.r” (Zuur et al. Reference Zuur, Ieno and Elphick2010). We retained variables if their variance inflation factor was below 2.5, which is considered adequate for ensuring that variables are not collinear (Zuur et al. Reference Zuur, Ieno and Elphick2010). We tested multicollinearity amongst continuous variables (Table 3) using Spearman correlation coefficients. We discarded one of a pair if the coefficient was greater than 0.7 (Dormann et al. Reference Dormann, Elith, Bacher, Buchmann, Carl, Carré and Leitao2013), discarding the variable that we thought less likely to have a meaningful impact in informing chat management. As the continuous variables used in this study used different scales, we standardised them around zero to avoid bias. We ran single term models for each variable against chat occupancy. We discarded any variables in single-term models that did not lower the Akaike Information Criterion (AIC) from the null model (Burnham and Anderson Reference Burnham and Anderson1998).
We included the remaining environmental variables in a global model and removed terms until a minimum adequate model was determined, following Crawley (Reference Crawley2005). We determined the order of deletion of habitat variables from chi-square tests for full models and reduced models in which only that habitat variable had been deleted. We retained significant habitat variables, and we repeated the removal of other habitat variables until all habitat variables in the model were statistically significant at P ≤0.05 or were lowering the AIC by >2. When each explanatory variable was removed in turn, the difference in percentage deviance explained its comparative value in explaining the observed variation in the response variable: occupancy.
To test the goodness of fit of the model, we used Pearson’s coefficient (p) of the sum of squared errors (model accepted if P ≥ 0.05), the chi-squared (model accepted if P is between 0.2–0.8) and the Freeman-Tukey (model accepted if P is between 0.2–0.8). All analyses were conducted in the program R (R Core Team 2017) using the R package ‘Unmarked’.
Results
Survey effort and chat observations
Approximately 1,850 km of floodplain were traversed either on foot or in an all-terrain vehicle during 78 days of fieldwork. Surveys were conducted at 257 sites across five floodplains (Figure 1; Table 1; Table 2). Eighty-six chats were observed at 24 sites during formal surveys with an average flock size of 3.6, and flock size ranging from one to 10 birds. All chats were recorded on the South Alligator and East Alligator River floodplains, with no records on the Adelaide, Mary, Wildman, or West Alligator River floodplains. All occupied sites were within conservation estates, with most in Kakadu NP and one in Arnhem Land (Figure 3). No chats were detected on pastoral land. There were no chat detections at randomly selected sites, the majority of detections were of chats encountered incidentally whilst traversing the study area (19), with a smaller number of detections at sites placed opportunistically amongst suitable habitat (3), or at sites where chats had been seen in previous surveys (2) (Table 2, Figure 3, Table S1 in the online supplementary material). Additionally, two large flocks of chats were observed outside formal surveys: On 2 November 2017, a flock of approximately 30 chats was observed near Anthill Point on the western side of the South Alligator Floodplain (Figure 3). On 8 November 2018, a flock of approximately 40 chats was observed at Orby-Worby Creek on the eastern side of the South Alligator River (Figure 3). These were not included in the results as a site survey could not be conducted at the time these flocks were seen.
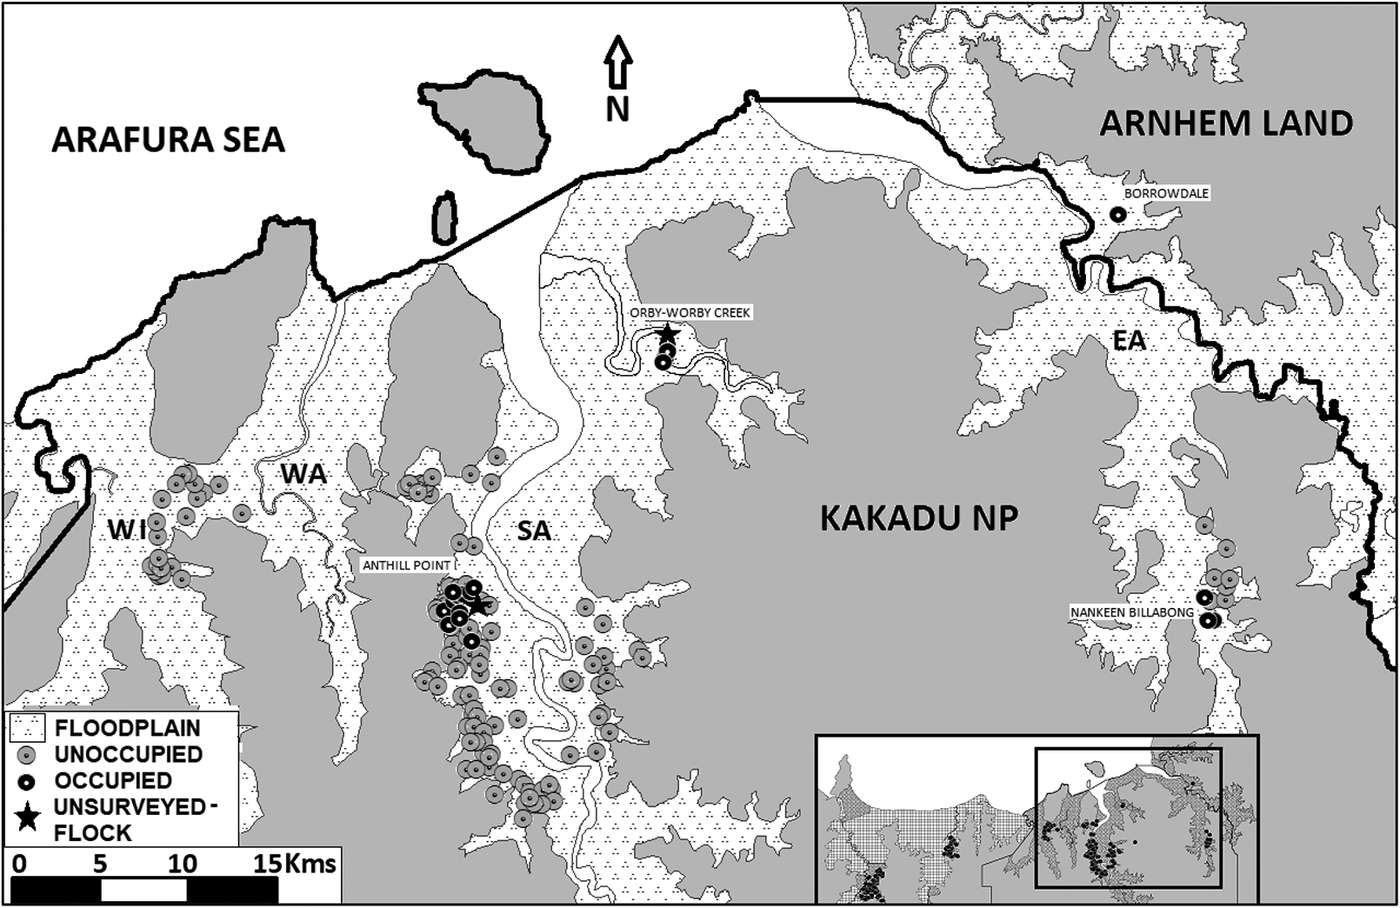
Figure 3. Map of the eastern half of the survey area showing the location of sites occupied by chats as well as unoccupied sites on the floodplains of the: Wildman River (WI); West Alligator River (WA): South Alligator River (SA); and, East Alligator River (EA).
Occupancy modelling
The estimate of occupancy from the most parsimonious model was 0.10 ± 0.04, i.e. chats were predicted to occur at 9.6–10.4% of the sites surveyed. Detection probability was estimated at 0.89 ± 0.07. Across all sites and all five floodplains, naïve occupancy of chats was 0.10 ± 0.02. Per floodplain, naïve occupancy was highest on the East Alligator River at 0.36 (n = 11 sites surveyed) compared to 0.18 (n = 126 sites surveyed) on the South Alligator River.
The best and most parsimonious model of chat occupancy included the covariates: distance to hydrogeological feature, Sesbania sesban, time since fire, and pig damage (Table 4). Shrub density, floodplain, fire frequency over 11 years, % cover of Malachria fasciata, and % cover of Mimosa pigra were also significantly related to chat occupancy, but were collinear with other significant terms, so were omitted from the final model.
Table 4. Coefficient estimates with standard errors of our most parsimonious model explaining site occupancy by Alligator River Yellow Chats.

Chat occupancy was significantly negatively related to the covariate ‘distance to hydrogeological feature’, meaning that chats were more likely to occur near, or within, hydrological features (e.g. channels, drainage; Figure 4). The sites surveyed were situated 0–3,510 m from a hydrogeological feature, but occupied sites were never further than 65 m from such a feature. Chat occupancy was significantly positively related to the presence of the shrub S. sesban (Figure 4). Overall, S. sesban was present at 31% of the sites surveyed and was present at 88% of the sites occupied by chats. Chat occupancy was positively related to ‘pig damage’ sites with either moderate or severe pig damage were more likely to be occupied than sites with no pig damage (Figure 4). Neither moderate nor severe pig damage were significant, but severe pig damage was close, and so was included in the final model (P = 0.056). Chat occupancy was also related to ‘time since fire’, with long unburnt (5+ years without fire) sites more likely to be occupied compared to recently burnt sites (Figure 4). Whilst this result was not significant, the inclusion of ‘time since fire’ in the model lowered the AIC.

Figure 4. The effect of distance to hydrogeological features (log transformed) on chat occupancy under 6 different conditions. The leaf represents the presence of Sesbania sesban whilst the pig represents the presence of severe topsoil damage caused by pigs at the site. A–E were burnt within the last 5 years, whilst E–F have been unburnt for at least the last 5 years.
Discussion
This survey represents the most comprehensive assessment of the distribution of the Alligator Rivers Yellow Chat, and the habitat variables that influence its occupancy. We surveyed across the taxon’s entire known range, on different land tenures. We detected chats on only two of the five surveyed floodplains. Most of our detections of chats were on the western side of the South Alligator River floodplain in the same vicinity as a site at which many of the earlier chat sightings have occurred (Armstrong Reference Armstrong2004, Kyne and Jackson Reference Kyne and Jackson2016). For logistical reasons, the study was conducted in the dry season, we therefore acknowledge that its results may provide little inference for distribution and habitat selection during the wet season, and that other factors may then influence the distribution or breeding (likely late wet season; Armstrong Reference Armstrong2004) and be priorities for management.
Preferred habitat
Patterns of occurrence of species are often used to infer preferred habitat (Verner et al. Reference Verner, Morrison and Ralph1986, Raven Reference Raven2002, MacKenzie et al. Reference MacKenzie, Nichols, Royle, Pollock, Bailey and Hines2006). Our chat occupancy modelling found that during the late dry season, chats are more likely to occur in areas of the floodplain with the shrub S. sesban. In a predominantly grassland environment, this shrub provides a relatively tall (to 3 m) woody structure on which to perch (Cowie et al. Reference Cowie, Short and Osterkamp Madsen2000), shade during the hotter parts of the day, and, when in dense thickets, cover from predators. We also found that chats are closely associated with low-lying channels and depressions on the drying floodplains. Drainage lines may have been favoured because moist areas are commonly associated with a higher abundance and diversity of invertebrate prey (Batzer and Resh Reference Batzer and Resh1992) and may also be important for hydration. Drainage areas usually also supported a relatively higher diversity of vegetation compared to adjacent grassy floodplain so are likely to contain a greater diversity of invertebrates (Siemann Reference Siemann1998). Finally, the vegetation in drainage lines was structurally complex, which, similar to S. sesban, is likely to benefit chats by offering shade and cover, as well as numerous substrates for invertebrate prey.
Fires individually and more generally affect floodplain vegetation and structure (Cowie et al. Reference Cowie, Short and Osterkamp Madsen2000). Changed fire regimes are one of the major threats to Australia’s avifauna (Woinarski and Legge Reference Woinarski and Legge2013) and have been implicated in the decline of a number of northern Australian birds (eg. Noske Reference Noske1992, Fraser et al. Reference Fraser, Lawson, Morrison, Christophersen, McGreggor and Rawlinson2003, Skroblin and Legge Reference Skroblin and Legge2012). Chat occurrence was higher at sites that were long unburnt (5+ years). The maintenance of fire regimes that result in retention of adequate areas of long unburnt patches has been identified as one of the key performance thresholds of conservation fire management in northern Australia (Russell‐Smith et al. Reference Russell‐Smith, Evans, Edwards and Simms2017). Vegetation is hypothesised to show successional variation over time since fire (Woinarski and Legge Reference Woinarski and Legge2013, Russell‐Smith et al. Reference Russell‐Smith, Evans, Edwards and Simms2017), so chat habitat may only develop after several years without fire. Alternatively, the hydrogeological features that chats prefer remain wetter for longer each season than other areas of floodplain, and therefore may be less likely to burn in early season fires. Our modelling found that chats were more likely to occur at sites with extensive pig damage. One reason for the link is that feral pigs and chats prefer similar habitat (Kyne and Jackson Reference Kyne and Jackson2016, Hancock et al. Reference Hancock, Lowry and Dever2017). As the dry season progresses feral pigs concentrate on the relatively small patches of moist habitat, which includes the hydrogeological features that chats prefer (Garnett et al. Reference Garnett, Szabo and Dutson2011).
Comparison with prior surveys
Formal monitoring that identifies trends in population size, assesses the success of future conservation actions, and informs future management is still lacking for this subspecies. Repeat surveys of chats (Armstrong Reference Armstrong2004, Kyne and Jackson, Reference Kyne and Jackson2016, this study), especially when they cover some of the same area, provide an opportunity to infer trends over time. The only area searched by all three surveys is an area on the western side of the South Alligator River floodplain, near Anthill Point (Figure 3). Here, Armstrong (Reference Armstrong2004) detected 65 chats from 26 sites, Kyne and Jackson (Reference Kyne and Jackson2016) detected up to 27 chats from nine sites, and this survey detected 69 chats from 17 sites. However, these numbers should not be used to infer change in population over time given that the survey methods and effort varied greatly. The first and second surveys were undertaken over no more than two weeks. The current survey covered a smaller area per day than earlier surveys but was undertaken over a longer period. Furthermore, information on the proportion of surveyed sites that were occupied, and the basis of site selection is incomplete from the earlier surveys (particularly from Armstrong Reference Armstrong2004). Nevertheless, that our sampling over 78 days of searching detected only 86 chats from just 24 sites is evidence that the chat occurs at low density and is likely to have a small population size.
Land tenure
Chats were only found on two of the six surveyed floodplains (South and East Alligator Rivers), and of the 100 sites surveyed outside of Kakadu NP, this study found just one of them to be occupied by chats (Figure 3). Of the 33 sites surveyed on pastoral land, none were found to be occupied by chats. Outside Kakadu NP, 67% of available floodplain habitat is used for the production of beef. Cattle stations seek to promote grass monocultures to feed their stock, and high densities of cattle can denude vegetation entirely. This may prevent the growth of key vegetation (such as Sesbania sesban) and may make cattle station floodplain habitat unsuitable for chats. Other floodplain habitat outside Kakadu NP is managed for conservation by the PWCNT and by Aboriginal Ranger Groups in Arnhem Land. Inaccessibility reduced survey time in Arnhem Land to just one day, but PWCNT land was surveyed extensively (66 sites). The PWCNT land surveyed in this study had large infestations of the woody weed Mimosa pigra, a weed that has been largely controlled on Kakadu NP floodplains. Mimosa pigra can form dense, 3-m tall thickets that cover large areas of the floodplain, altering floodplain vegetation structure, and therefore reducing chat habitat suitability. Further searching of floodplains outside of Kakadu NP targeting less-accessible weed free areas is required to better establish chat occupancy.
Limitations and future research
Acquiring adequate data to estimate population metrics for the Alligator River Yellow Chats is difficult due to remoteness, seasonal weather, and accessibility of habitat. As such, the survey period was restricted to the late dry season when the floodplains were dry enough to allow access by foot and all-terrain vehicle, and to areas where permission was granted. Although our sampling was extensive, it could not be comprehensive, and we recommend further searching of other areas of floodplain that could not be surveyed during the current survey. We recommend further searching of the East Alligator River Floodplain in particular, which had a naïve occupancy of 0.36 from just 11 survey sites, suggesting it may be important for chats.
Seasonal cycles of inundation and drying of floodplains mean that chat habitat is constantly changing, and the population probably moves around to exploit different parts of the floodplain in different seasons (Armstrong Reference Armstrong2004). The conservation of the species requires a full understanding of their key habitats at all times of year, and we therefore recommend surveying for chats during the wet season (December–June) when possible but we are keenly aware of the logistical difficulties involved with traversing the floodplains at this time. Lastly, successful conservation of the chat will rely on the abatement of threats through management actions. Further research is required to clarify the relative importance of these threats, determine how they influence the chat and determine cost-effective management actions that will best reduce the pressure they are exerting on chat populations.
Management recommendations
We propose that future chat conservation involves both systematic monitoring and immediate and persistent management action. Whilst uncertainty about chat population size and trend makes continued monitoring essential, it is also necessary to act upon the potential threats identified in this paper, to avoid monitoring this species to extinction (Lindenmayer et al. Reference Lindenmayer, Piggott and Wintle2013), as has been the case with several species (e.g. McDonald Reference McDonald1990, Hayward et al. Reference Hayward, Paul, Dillon and Fox2003, Beeton et al. Reference Beeton, Burbidge, Grigg, Harrison, How, Humphreys and Woinarski2010). Chat occupancy is influenced by fire and feral pigs, both of which can be influenced by land managers. Chats prefer long unburnt habitat, so it should be a priority of floodplain fire management to maintain areas that are long unburnt. This has already been an objective of Kakadu NP’s fire management (KNP 2016), and a 2017 multi-year assessment of Kakadu NP’s fire management found that consistently more than 40% of the floodplains have been unburnt for 3+ years (Russell‐Smith et al. Reference Russell‐Smith, Evans, Edwards and Simms2017). This suggests that current floodplain fire management may be adequate for maintenance of preferred chat habitat. Chats are more likely to occur where feral pig damage is severe, but we interpret this association to coincidence of preferred habitat rather than that pig damage renders habitat more suitable for chats. Furthermore, feral pigs are a major threat to biodiversity in northern Australia (Woinarski Reference Woinarski2004). We therefore recommend that feral pig numbers be controlled on the floodplains. Whilst feral pig control is also already part of the Kakadu NP management plan (KNP 2016), we recommend it be continued and intensified to protect chat habitat.
The implementation of a robust yet feasible monitoring programme for chats is vital to track changes in the population and ensure that any future population declines are detected, and remedial management implemented. Monitoring will also allow evaluation of what constitutes effective conservation actions. We propose a monitoring programme in which all sites that were found to be occupied by chats in previous surveys (Armstrong Reference Armstrong2004, Kyne and Jackson Reference Kyne and Jackson2016) and in this study are surveyed annually using the same chat search methodology described in this paper. To account for the low density of chats and that a 4-ha survey site will likely represent a small fraction of any chat’s actual home range, we propose that in an ideal monitoring programme, each site should be surveyed three times in the same survey year to maximise the likelihood that chats are detected at sites that they frequently use. Additionally, a further 20 random, stratified selected sites should be surveyed in likely habitat on the surveyed floodplains in order to expand the search for chats across the floodplain whilst keeping the survey effort manageable. These new survey sites should search drainage lines or depressions that feature S. sesban in areas where chats have not been located previously, which would mean approximately 70 sites are sampled each year. Such areas of likely habitat could be located by Kakadu NP staff and/or Traditional Owners (who have intimate knowledge of the floodplains), through satellite imagery, or by aerial survey. Each year, a new set of these 20 random sites should be selected and surveyed. Any newly discovered occupied sites can be added to the initial baseline of sites that are surveyed annually, and sites that have no chat detections for three consecutive years can be removed, to avoid the occupied site list becoming unmanageable. This study underlines the challenges of obtaining data on rare and elusive species in remote and inaccessible habitats in order to provide valuable evidence to inform conservation management.
Acknowledgements
The authors would like to acknowledge the Traditional Owners of the lands on which the research was conducted, most notably Victor Cooper, Sean Nadji, and the Larrakia People, on which Charles Darwin University stands. We would also like to acknowledge Roy Tipiloura, Harold Swan, and the volunteers who contributed to the collection of data. This research received support from Charles Darwin University and the Australian Government’s National Environmental Science Program through the Threatened Species Recovery Hub. PMK was supported through the Marine Biodiversity Hub, a collaborative partnership supported through funding from the Australian Government’s National Environmental Science Program.
Competing Interest
none
Supplementary Materials
To view supplementary material for this article, please visit http://doi.org/10.1017/S0959270921000447.


