

Introduction
Vertebrate diversity has drastically declined over the past decades in tropical regions (Hoffmann et al. Reference Hoffmann2010). Southeast Asia in particular has a high proportion of species at risk of extinction within the next 50 years (Sodhi et al. Reference Sodhi, Koh, Brook and Ng2004, Laurance Reference Laurance2006). This is due primarily to the degradation of natural habitat (Sodhi et al. Reference Sodhi, Posa, Ming Lee, Bickford, Koh and Brook2010) and overhunting (Harrison et al. Reference Harrison, Sreekar, Brodie, Brook, Luskin, O’kelly, Rao, Scheffers and Velho2016). Birds are particularly at risk, with about 10% of the 2,696 species designated as threatened with extinction, including about 27% of the 76 Galliformes species (IUCN 2016). However, there are no empirical data on the extinction probability of the Galliformes species in South-East Asia (Grainger et al. Reference Grainger, Garson, Browne, McGowan and Savini2018).
To support conservation and management decisions, it is imperative to determine, quantitatively, the extinction probability of threatened species in the region. In the past, this has been achieved using Population Viability Analysis (PVA), which predicts long-term population survival, extinction risk and associated threats within a specific environment (Boyce Reference Boyce1992, William et al. Reference William, Philip, Brain, Leonie and Johm2002). PVA analyses how population growth parameters, such as initial population size, population growth rate, survival rate, productivity and predation rate are affected by environmental factors, such as habitat quality, disturbance level and protection level (Ruggiero et al. Reference Ruggiero, Hayward and Squires1994). Understanding the variables affecting the survival trend of a population is crucial to defining the actions needed for long term species management (Brook et al. Reference Brook, O’Grady, Chapman, Burgman, Akcakaya and Frankham2000). Besides providing important details on the probability of extinction, PVA can be used to determine the Minimum Viable Population (MVP), defined as the minimum number of individuals of a species inhabiting a given area needed to guarantee survival of the population over a specific time frame (Shaffer Reference Shaffer1981); a higher extinction rate is typically observed for small populations by comparison with large ones (Schoener and Spiller Reference Schoener and Spiller1987). In addition, MVP can be used to estimate the minimum area required for any given carrying capacity.
Although PVAs have potential to provide critical information for conservation planning, some studies have questioned the reliability of PVA due to large uncertainty in model outcomes (Flather et al. Reference Flather, Hayward, Beissinger and Stephens2011). Viability is generally predicted using population models, such as those incorporated in the Vortex software (Lindenmayer et al. Reference Lindenmayer, Burgman, Akçakaya, Lacy and Possingham1995), that require multiple parameters (e.g. productivity data, population growth rate and survival rate). However some parameters are not often available, as they require long-term studies (Boyce Reference Boyce1992). Gilpin and Soule (Reference Gilpin, Soule and Soule1986) suggested that a study of 12 generations, at least, is required for a robust extinction risk prediction. Unfortunately, most ecological studies are carried out over a three-year period (Tilman Reference Tilman and Likens1989, Baskin Reference Baskin1997), providing data that often underestimate the extinction risk (Reed et al. Reference Reed, O’Grady, Brook, Ballou and Frankham2003). Generally, the life history of a species is dependent on environmental factors and management strategies (Flather et al. Reference Flather, Hayward, Beissinger and Stephens2011) and therefore, each population within an area ought to be separately considered while performing a PVA analysis. Lack of relevant data has been reported as the main hindrance to viability analysis for Galliformes (Fuller and Garson Reference Fuller and Garson2000) and to date, only Bro et al. (Reference Bro, Sarrazin, Clobert and Reitz2000) and Zhang and Zheng (Reference Zhang and Zheng2007) have conducted PVA studies for Galliformes in South-East Asia. However, by running PVA in a Bayesian framework, we can develop predictive models using information on observed population abundance and simulate population information for a given period by random sampling within the range of the observed population abundance data from two points in time. This approach allows the estimation of a credible range of future population abundance and predicts the probability of a future trend employing only data from monitoring abundance.
The ‘Endangered’ Green Peafowl is among the most threatened species in South-East Asia due to high hunting pressure and habitat destruction (McGowan et al. Reference McGowan, Duckworth, Wen, Van Balen, Yang, Khan, Yatim, Thanga, Setiwan and Kaul1999). The original distribution covered the whole dry-forest area (e.g. deciduous, dry dipterocarp, pine) in north-east India, Bangladesh, Yunnan (south-west China), Myanmar, Thailand, Laos, Vietnam, Cambodia, peninsular Malaysia and Java (Indonesia) (McGowan et al. Reference McGowan, Duckworth, Wen, Van Balen, Yang, Khan, Yatim, Thanga, Setiwan and Kaul1999). However, recent modelling shows a severe decline in range, currently scattered into small patches highlighted in six population strongholds, including southern Myanmar; northern, north-western and western Thailand; and northern and eastern Cambodia (Sukumal et al. Reference Sukumal, Dowell and Savini2019). Recently several population estimates have been made for some of the strongholds (Sukumal et al. Reference Sukumal, McGowan and Savini2015, Reference Sukumal, Dowell and Savini2017, Nuttall et al. Reference Nuttall, Nut, Ung and O’Kelly2016, Loveridge et al. Reference Loveridge, Kidney, Ty, Eames, Borchers, Kidney and Borchers2017). The loud mating call by males makes detection of Green Peafowl relatively easy compared to other Galliformes species in the region (Suwanrat et al. Reference Suwanrat, Ngoprasert, Sutherland, Suwanwaree and Savini2015), making them a good species through which to explore the response of ground dwelling birds, especially in dry forest habitat, to different levels of threat and management action.
Therefore, the aims of this work were to estimate the long-term viability and extinction risk of Green Peafowl using only information on the observed population abundance in two years separated by a long interval. We use a Bayesian model to provide estimates of uncertainty as the data we have are limited (the estimates of uncertainty would be narrower in a frequentist model). In addition, we do not have the requisite ecological data (vital rates such as survival, fecundity, and net immigration) to build a more complex model or use stand-alone PVA software (e.g. Vortex). We use two populations of Green Peafowl facing different levels of threat as a case study. Specifically, we 1) estimate the population growth rate at two sites, showing different protection level, where two surveys with count data were conducted at 23 year intervals at a first site and 15 year intervals at a second site (Sukumal et al. Reference Sukumal, McGowan and Savini2015, Reference Sukumal, Dowell and Savini2017), projecting the results into the future to see for how long the populations will persist in protected areas facing different threats, and 2) define the minimum viable population (MVP) size of Green Peafowl required for long-term persistence of the species in these two areas.
Study area and methods
This study was focused on two sites with different levels of protection and disturbance to their Green Peafowl populations. The first site was in HuaiKhaKhaeng Wildlife Sanctuary (HKK), western Thailand (15̊ 36´N 99̊ 19´E), with increased patrolling and reduced hunting pressure that led to an increase in the population of Green Peafowl between 1992 and 2015 (Sukumal et al. Reference Sukumal, Dowell and Savini2017). The HKK is connected to ThungYaiNaresuan Wildlife Sanctuary and this Western Forest Complex is designated as a UNESCO World Heritage Site. It covers a total area of 2,780 km2 with an altitudinal range of 200 to 1,600 m, an annual temperature range of 8 to 38̊ C and a mean annual rainfall of 1,375 mm (Simcharoen et al. Reference Simcharoen, Savini, Gale, Simcharoen, Duangchantrasiri, Pakpien and Smith2014). The dry season in HKK occurs between November and April, with a mean rainfall of 298 mm; and the wet season occurs between May and October, with a mean rainfall of 1,088 mm. The sanctuary consists of mixed deciduous forest (48%), dry evergreen forest (25%), hill evergreen forest (13%) and dry dipterocarp forest (7%) (Simcharoen et al. Reference Simcharoen, Savini, Gale, Simcharoen, Duangchantrasiri, Pakpien and Smith2014). The information on population estimation was derived from two independent surveys during a 23-year period, comprising a historical survey between 1989 and 1992 (Simcharoen et al. Reference Simcharoen, Thongnamchaima, Sukmasuong, Thobmongkol, Khoothong, Thobmongkol, Khoothong, Sunthran, Mheesangpraew, Thongooppagarn and Singkram1995, McGowan et al. Reference McGowan, Duckworth, Wen, Van Balen, Yang, Khan, Yatim, Thanga, Setiwan and Kaul1999) and a follow-up survey in 2015 (Sukumal et al. Reference Sukumal, Dowell and Savini2017).
The second site was in YokDon National Park (YDN), south central Vietnam (12̊ 47´–13̊ 00´N, 107̊ 29´–107̊ 50´E), with a high level of habitat disturbance and hunting pressure. The YDN is located in DakLak Province, which borders Cambodia and has a total area of 1,155 km2, mainly dominated by dry deciduous forest (75% of total area). The area is relatively flat with an elevation of about 200 m and high spots of up to 474 m (Sterling et al. Reference Sterling, Hurley and Le Duc2006). This area comprises the majority of suitable habitat for Vietnam’s remaining Green Peafowl population (Brickle Reference Brickle2002). However, a recent survey in 2013 reported a much-reduced Green Peafowl population in YDN (Sukumal et al. Reference Sukumal, McGowan and Savini2015), compared to the number in 1998 (Brickle et al. Reference Brickle, Cu, Quynh, Cuong and Van San1998).
Population monitoring data
The estimation of the Green Peafowl population number in HKK was based on two historical datasets recording 256 (Simcharoen et al. Reference Simcharoen, Thongnamchaima, Sukmasuong, Thobmongkol, Khoothong, Thobmongkol, Khoothong, Sunthran, Mheesangpraew, Thongooppagarn and Singkram1995) and 225–300 calling males (McGowan et al. Reference McGowan, Duckworth, Wen, Van Balen, Yang, Khan, Yatim, Thanga, Setiwan and Kaul1999); and the dataset from a follow-up survey, comprising 434 calling males with a range of 373 to 512 (95% CI estimated using DISTANCE; Sukumal et al. Reference Sukumal, Dowell and Savini2017). For YDN, a historical dataset comprising an estimated 475 calling males, ranging from 391 to 559 (Brickle et al. Reference Brickle, Cu, Quynh, Cuong and Van San1998) and an estimated 219 calling males, ranging between 101 and 479 calling males, from a recent survey (Sukumal et al. Reference Sukumal, McGowan and Savini2015) were used as inputs for the model.
BPVA framework
The analysis was conducted using a Bayesian state-space model. We analysed the population datasets for HKK with a high level of protection and low level of disturbance (Sukumal et al. Reference Sukumal, Dowell and Savini2017), and YDN with an observed high disturbance level (Sukumal et al. Reference Sukumal, McGowan and Savini2015) to illustrate the potential differences in extinction probability. We chose a state-space approach to account for both sampling and demographic uncertainty. Ideally, one would incorporate monitoring data over a longer time period, but such data is unavailable for Green Peafowl. Hence, for the simulation procedure, a constant rate of growth was assumed throughout the projected time series. The initial population size was inputted in a range from 0 to the initial population estimate. We used the estimated historical population size at each site as a maximum initial population size in the analysis. The population estimates from the historical and recent surveys were used to calculate annual population abundances in HKK, from 1992 to 2015, and in YDN, between 1998 and 2013. These annual population abundances were used to estimate average population growth rates and the future population trend over the next 100 years (1992–2092 for HKK, and 1998–2098 for YDN). We ran BPVA under the assumption of exponential growth rate when no constraints were applied because the estimation of carrying capacity (k) is highly uncertain, especially for a species that has been hunted unsustainably, resulting in a sparse population distribution across the entire range.
Data analysis
Posterior distribution of parameters was conducted using Markov chain Monte Carlo (MCMC) simulations in the program JAGS, implemented using the R (R Development Core Team 2014) package “R2jags” (Su and Yajima Reference Su and Yajima2015). The analysis was run using three independent chains for 50,000 iterations after a burn-in of 10,000 iterations. MVP was determined following the BPVA approach (Saunders et al. Reference Saunders, Cuthbert and Zipkin2018) whereby each population number was inputted to a loop procedure as the mean of recent population sizes. Next, the lowest population number that showed a stable or increase future population trend after 50 years was used to simulate the population abundance.
Results
Population viability at different disturbance levels
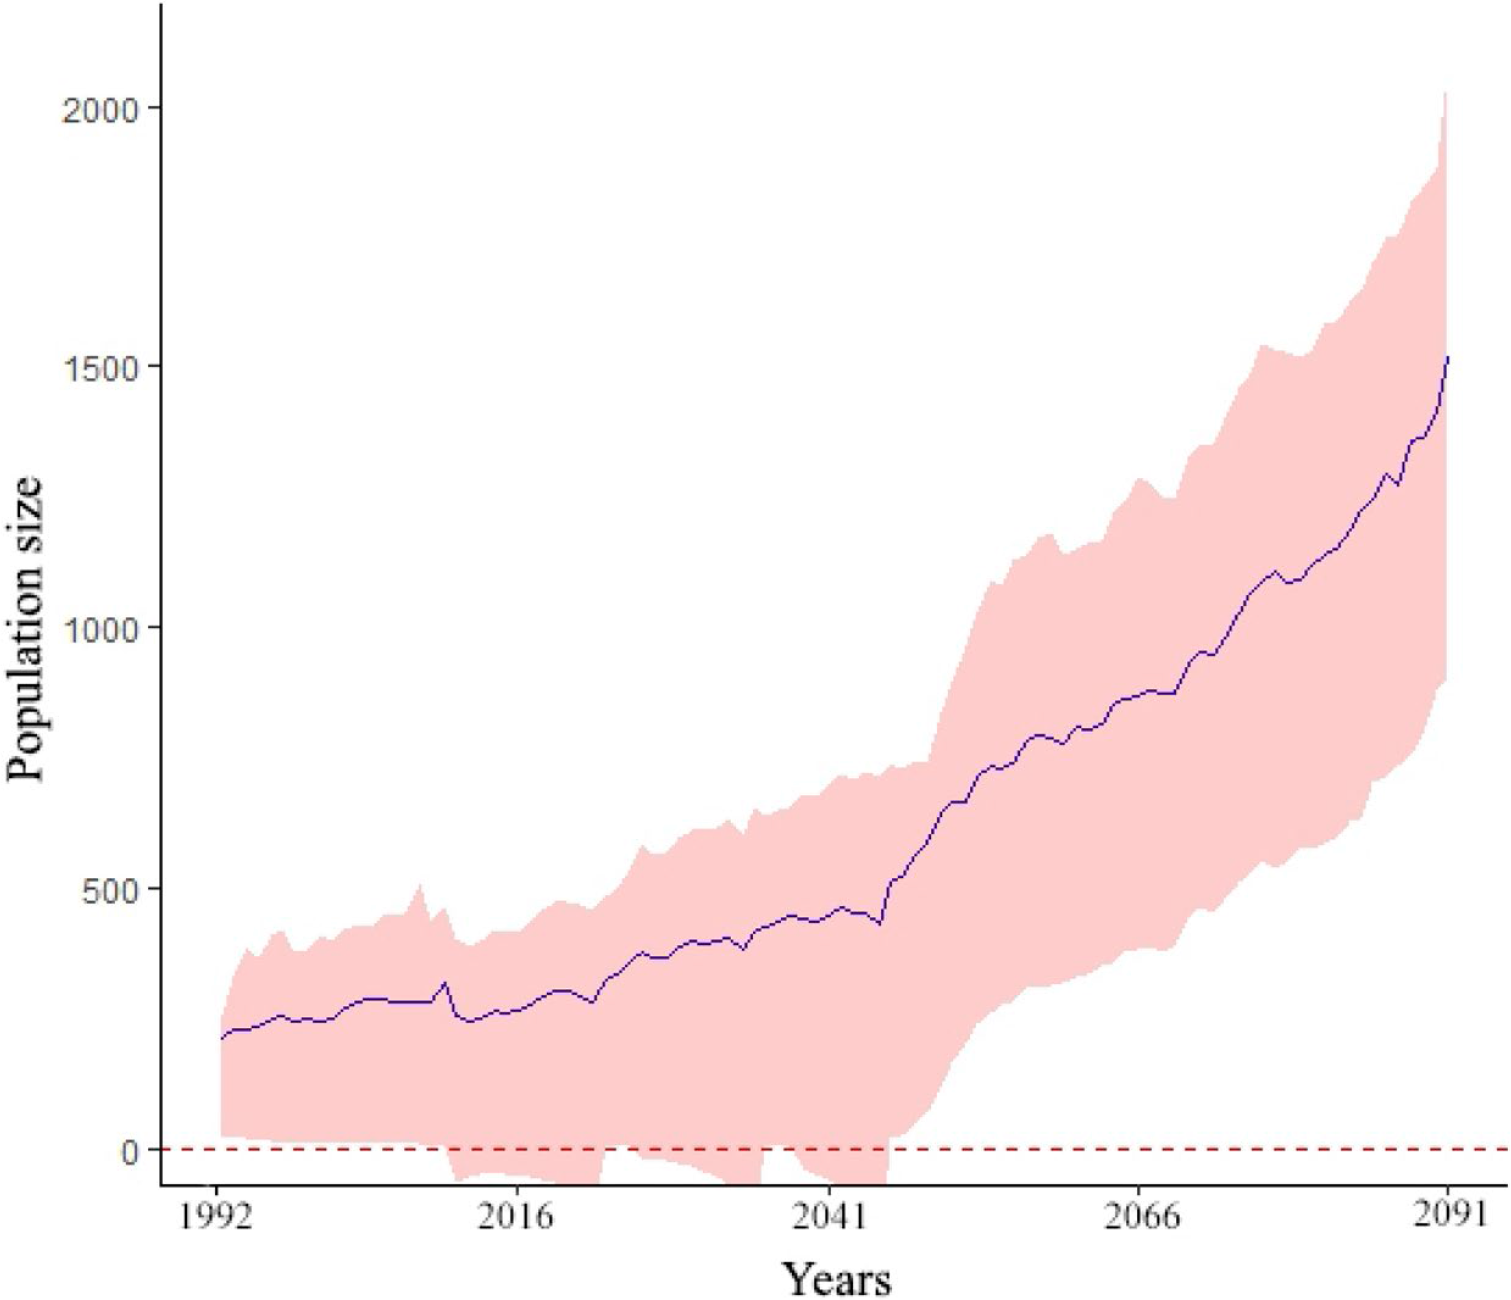
In HKK (western Thailand), with a high level of protection and low disturbance, the Green Peafowl population size was stable over the study period, with populations of 209 (credible interval or [CI] = 26–255) and 261 (CI = -49–411) calling males in 1992 and 2015 respectively. If the current protection and disturbance levels in the area remains, the population size is predicted to increase to 1,516 calling males (CI = 896–2,081) by 2091 (Figure 1).

Figure 1. Predicted population size from 1992 to 2091 (line, year 1-100) of Green Peafowl in HuaiKhaKhaeng Wildlife Sanctuary from a simulation model of population growth. Shading represents 95% credible intervals (CI).
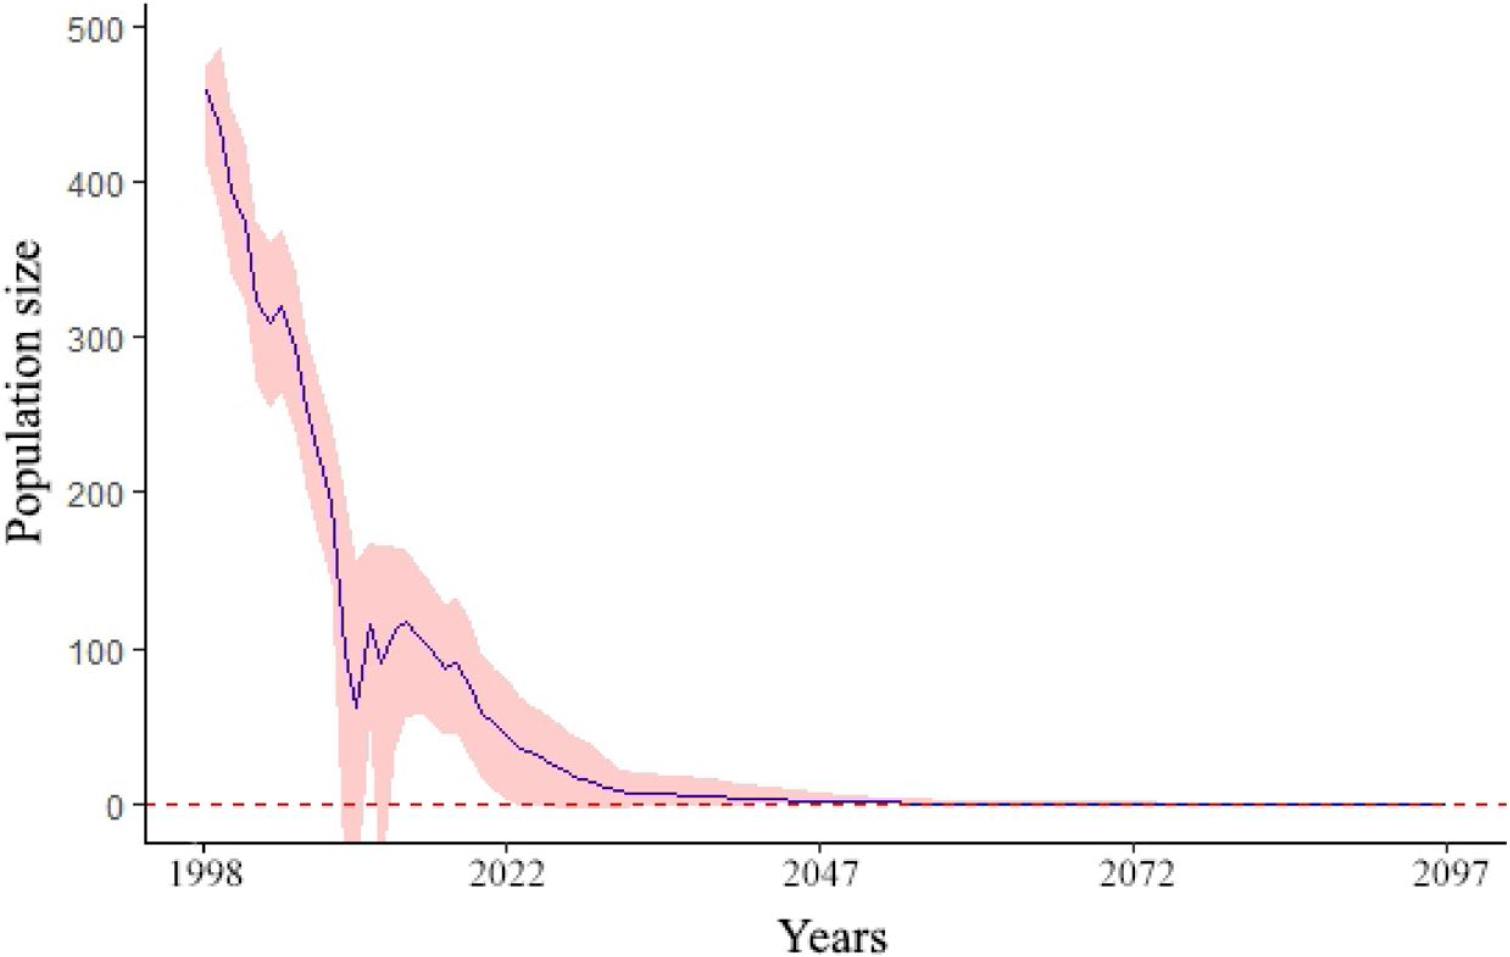
In contrast, the population size in YDN (south central Vietnam), with a high level of habitat disturbance and hunting pressure, drastically declined between 1998 and 2013. The estimated populations in 1998 and 2013 were 458 (CI = 410–474) and 111 (CI = 33–165) calling males, respectively. If the status quo remains going forward, without any conservation or management improvement, the species has a 63% chance of going extinct, based on our model, as evidenced by the estimated population size of 0.95 (CI = 0.17–3.93) in 2052 (Figure 2).

Figure 2. Predicted population size from 1998 to 2097 (line, year 1-100) of Green Peafowl in YokDon National Park from a simulation model of population growth. Shading represents 95% credible intervals (CI).
Minimum viable population (MVP)
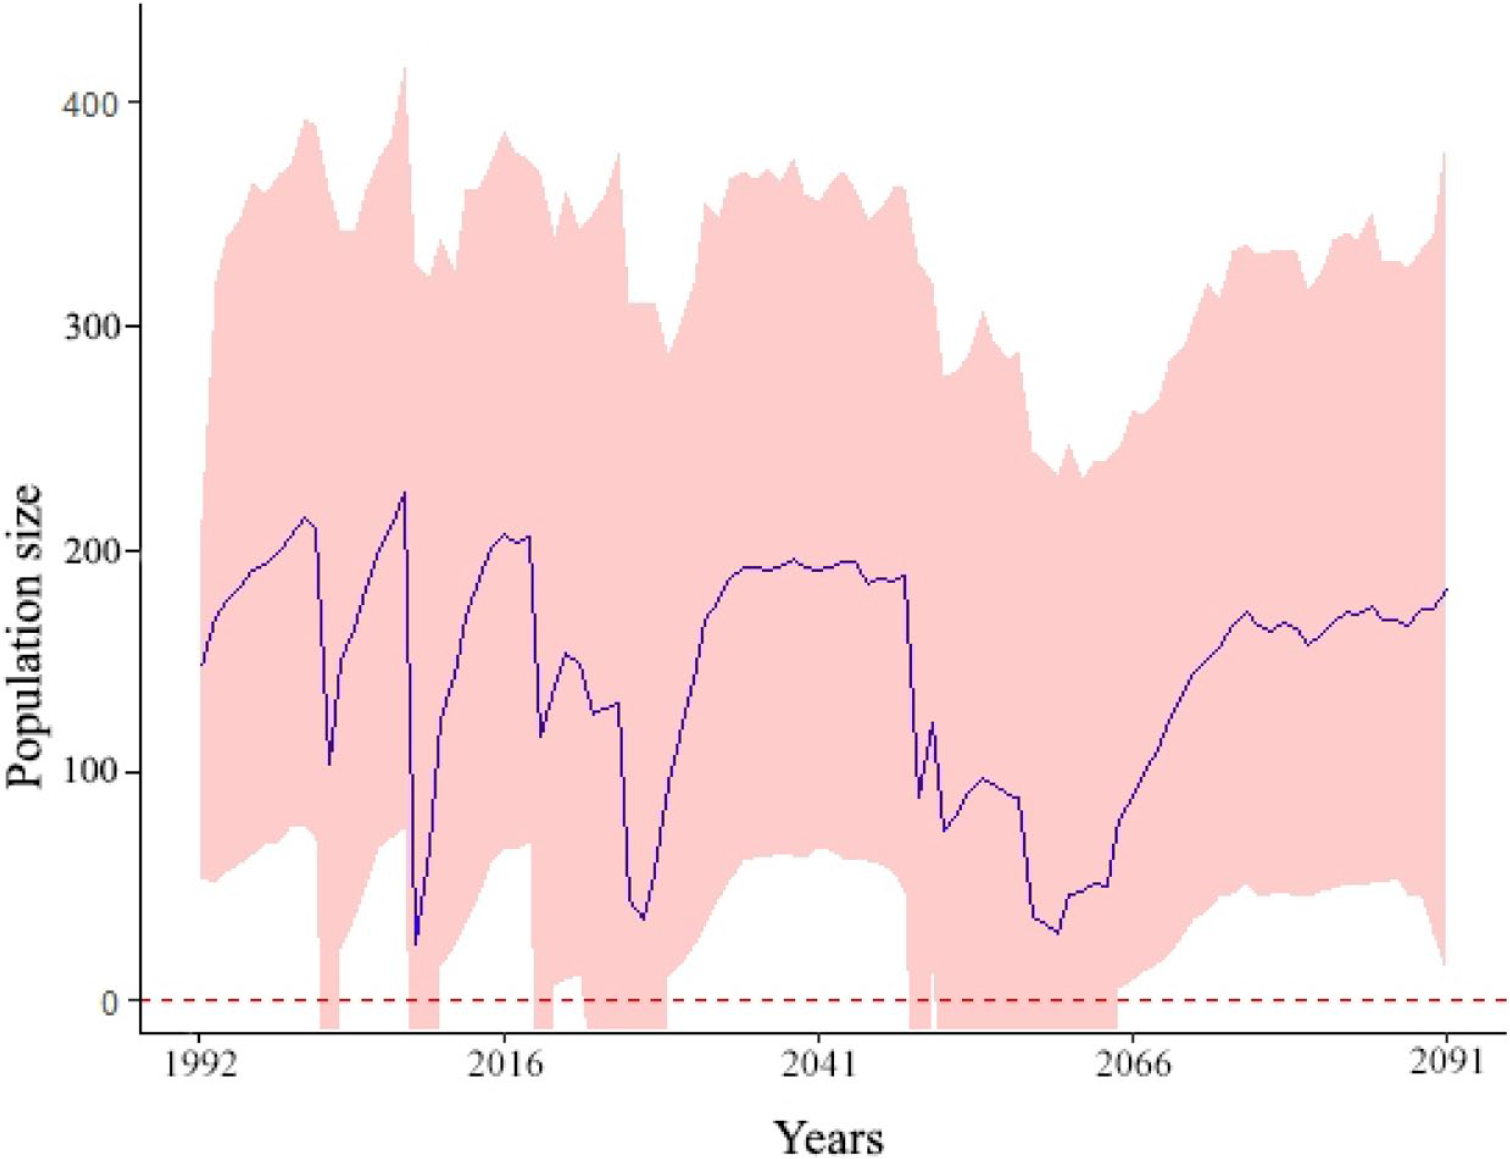
In HKK, the smallest number that could maintain long-term population survival (i.e. MVP) for 76 years from last survey, i.e. from 2016 to 2091, or for the 100-year period between 1992 and 2091, is 250 ±124 (SD) calling males, assuming the current protection and disturbance levels, comparable to conditions in 1992, are maintained going forward. This number is marginally lower than the estimated initial historical population size of 256 calling males (Simcharoen et al. Reference Simcharoen, Thongnamchaima, Sukmasuong, Thobmongkol, Khoothong, Thobmongkol, Khoothong, Sunthran, Mheesangpraew, Thongooppagarn and Singkram1995) (Figure 3).

Figure 3. Predicted population size from 1992 to 2091 (line, year 1-100) of Green Peafowl in HuaiKhaKhaeng Wildlife Sanctuary, by inputting 256 calling males from historical datasets as population abundance in 1992 and the estimated Minimum Viable Population of 250 ± 124 (SD) calling males as population abundance in 2015. Shading represents 95% credible intervals (CI).
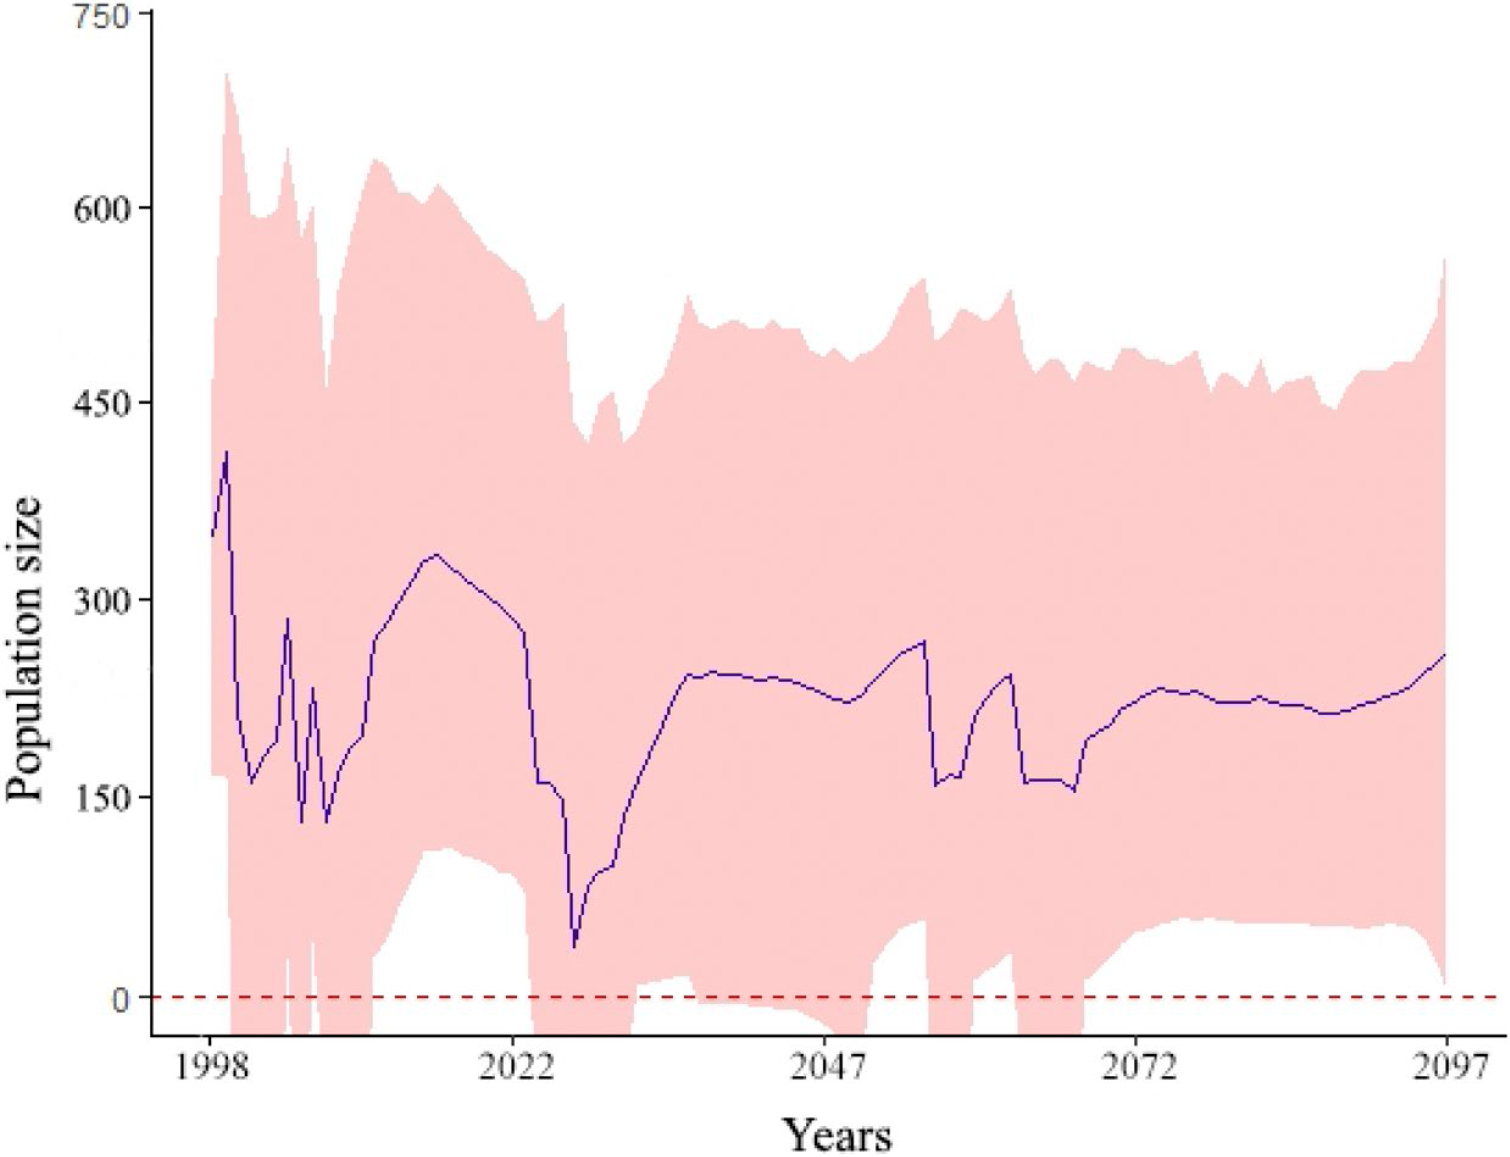
In contrast, for YDN, the smallest initial population size that could maintain long-term survival (i.e. MVP) for 84 years from last survey (i.e. from 2014 to 2097) is 450 ±145 calling males (Figure 4). This number lies within the initial historical population range of 391 to 559 (Brickle et al. Reference Brickle, Cu, Quynh, Cuong and Van San1998) but is higher than the recent population estimate of 219 calling males, indicating that this population does not appear to be sustainable, given demographic influences in the region.

Figure 4. Predicted population size from 1998 to 2097 (line, year 1-100) of Green Peafowl in YokDon National Park, by inputting 475 calling males from historical datasets as population abundance in 1998 and the estimated Minimum Viable Population of 450 ±145 calling males as population abundance in 2013. Shading represents 95% credible intervals (CI).
Discussion
We conducted our analysis employing only data on population abundance from two timeframes at two different sites, with different protection and disturbance levels, to simulate the historical, recent and future (next 100 years) population trends. Results from the HuaiKhaKhaeng Wildlife Sanctuary, which has a high level of protection and low disturbance, suggest positive Green Peafowl population growth, assuring long-term population persistence for the next 70 years. An MVP size of 250 calling males was determined to guarantee the species long-term persistence in the area. In contrast, the Green Peafowl population in YokDon National Park, suffering high habitat disturbance and hunting pressure, has declined drastically and our analysis predicts the population has a 63% chance of going extinct by the year 2052, in the absence of intervention measures. Our model estimated an MVP size of 450 calling males, including an assumption of exponential growth. However, the latest survey in 2013, showed the population size is lower than this MVP, and we take this as evidence that the species is at risk of local extinction.
Using population abundance information with BPVA
Our ecological knowledge of Green Peafowl is still limited in terms of life history parameters such as annual productivity, despite the availability of methods that increase their detectability compared to other forest Galliformes species (Suwanrat et al. Reference Suwanrat, Ngoprasert, Sutherland, Suwanwaree and Savini2015). In the absence of the life history data, the state-space modelling approach allowed us to simulate the current and future population abundance of the species using sparse historical monitoring data. However, because we lacked empirical productivity and survival information, our model’s outputs were characterised by high uncertainty (i.e. wide Credible Interval of posterior abundance). Therefore, we recommend the integration of life history information, when available, to improve the precision of the analysis. Given the difficulty in obtaining life history data, our basic model is a promising tool for conservation planning.
Population viability analysis has been scarcely applied to study Galliformes species, especially in South-East Asia. For the whole Asia region, only one case study that collected the long-term life-history data (from 1982 to 2004) for Cabot’s Tragopan Tragopan caboti in Wuyanling, south-east China, has been used with VORTEX to estimate population viability (Zhang and Zheng Reference Zhang and Zheng2007). Nevertheless, by using limited data on population abundance and a Bayesian PVA approach, prediction of the size and future viability of these two population has been achieved, and appropriate management actions can be recommended.
Conservation and management implications
HuiKhaKhaeng has a high level of protection with minimum disturbance. The effective patrolling system covering the entire area has resulted in a reduction of hunting pressure. Moreover the sanctuary has reduced human activities due to the prohibition of settlement within the area.
The good management in HuaiKhaKhaeng Wildlife Sanctuary has reportedly led to an increase in population of various endangered species, e.g. tiger Panthera tigris (Duangchantrasiri et al. Reference Duangchantrasiri, Umponjan, Simcharoen, Pattanavibool, Chaiwattana, Maneerat, Kumar, Jathanna, Srivathsa and Karanth2016), banteng Bos javanicus and Green Peafowl (Sukumal et al. Reference Sukumal, Dowell and Savini2017). If the current management system is maintained, the population levels of Green Peafowl have high probability of being maintained for the next 70 years. However, monitoring of Green Peafowl population abundance should be conducted every five years, which is the age of sexual maturity for males (Madge and McGowan Reference Madge and McGowan2002). To assure long-term persistence of the Green Peafowl population at the site, managers should aim to maintain at least 250 calling males.
By contrast, YokDon is characterised by high habitat disturbance and hunting pressure. Overgrazing by domestic cattle and bushfires have led to the deterioration of vegetation cover, resulting in the loss of foraging and nesting sites for Green Peafowl. These disturbances, in addition to a high hunting pressure, contributed to the drastic decline in Green Peafowl population in the area (Sukumal et al. Reference Sukumal, McGowan and Savini2015). A study conducted in 2013 revealed the counted population of Green Peafowl in YokDon was below the PVA predicted by the model, indicating that the population may well be at risk of local extinction. Measures such as restriction of human activities and effective patrolling are crucial to improving the future for this Green Peafowl population. YokDon is strategically important for the survival of the species in South-East Asia as it is connected to Mundulkiri Protected Forest in eastern Cambodia, which is home to a large population of Green Peafowl (Sukumal et al. Reference Sukumal, Dowell and Savini2019).
Many native wildlife populations are facing significant threats, and management interventions are urgently required to ensure their survival. Understanding how a population responds to site-specific conditions is key to setting up proper management plans for effective restoration or protection. Our results clearly show that protection level affects the long term survival of this species: we can see that with improved protection populations tend to increase, while with little or no protection populations decrease. Therefore, projecting future protection levels, when such data are available, should be included when performing viability analyses. However, we have shown here that information on population abundance alone can be used to investigate population trends and viability.
Considering the relative ease of detecting calling males during the breeding season, the Green Peafowl could be used as an indicator species to investigate the response of ground-dwelling birds to human-induced threats in their dry forest habitat. More generally, we hope that the BPVA approach can be applied to other species where only population abundance and not life history information is available. The BPVA could also be applied more broadly for determining suitable conservation management strategies, especially for highly threatened species.
Acknowledgements
The authors acknowledge King Mongkut’s University of Technology Thonburi for funding Postdoctoral Fellowship to Niti Sukumal. Thanks to O. Nnaemeka for improving an English in this manuscript.