


Introduction
Global temperatures increased by between 0.65 and 1.06°C during the period 1880–2012. Possibly, depending on various scenarios, global temperatures could increase by between 1.4 and 4.5°C for the period 2085–2100 (Collins et al. Reference Collins, Knutti, Arblaster, Dufresne, Fichefet, Friedlingstein, Wehner, Stocker, Qin, Plattner, Tignor, Allen, Boschung and Midgley2013, IPCC 2014). These changes in the global climate could trigger alterations in biological cycles, geographical patterns, and the ecological processes of the species (Walther et al. Reference Walther, Post, Convey, Menzel, Parmesan, Beebee and Bairlein2002, Ackerly et al. Reference Ackerly, Loarie, Cornwell, Weiss, Hamilton, Branciforte and Kraft2010, Bellard et al. Reference Bellard, Bertelsmeier, Leadley, Thuiller and Courchamp2012, Roth et al. Reference Roth, Plattner and Amrhein2014). Changes could be any or all of the following: 1) changes in the density of the species; 2) geographical displacement in the distribution of the species, either in the direction of increased latitudes and / or higher elevations; 3) changes in processes such as migration, laying dates; 4) modifications in morphology, body size, and behavior; 5) modification of community through changes in interspecific relationships; and 6) alterations in genetic frequencies (Walther et al. Reference Walther, Post, Convey, Menzel, Parmesan, Beebee and Bairlein2002, Root et al. Reference Root, Price, Hall, Schneider, Rosenzweig and Pounds2003, Ackerly et al. Reference Ackerly, Loarie, Cornwell, Weiss, Hamilton, Branciforte and Kraft2010, Walther Reference Walther2010, Yang and Rudolf Reference Yang and Rudolf2010).
To date there is evidence of some species that have already modified their latitudinal or altitudinal geographical distribution patterns in response to temperature increases in recent decades (e.g. Hughes Reference Hughes2000, Parmesan and Yohe Reference Parmesan and Yohe2003, Parmesan Reference Parmesan2006, La Sorte and Jetz Reference La Sorte and Jetz2010, Roth et al. Reference Roth, Plattner and Amrhein2014). It is predicted that in the future many species will undergo dramatic changes in their distribution (Parmesan and Yohe Reference Parmesan and Yohe2003, Parmesan Reference Parmesan2006, Lawler et al. Reference Lawler, Shafer, White, Kareiva, Maurer, Blaustein and Bartlein2009). However, the responses to these variations will not be the same for all species and the patterns of change have not been clearly identified. Some have suggested that species from low elevations or low latitudes will benefit from expanding their distributions, while species from higher elevations or latitudes will contract their range (Walther et al. Reference Walther, Post, Convey, Menzel, Parmesan, Beebee and Bairlein2002). Despite these findings corroborating these tendencies, the patterns do not seem to be generalized, since some species from high latitudes in Antarctica such as Gentoo Penguin Pygoscelis papua and some vascular plants, e.g. Deschampsia antarctica, Colobanthus quitensis, have colonised new areas expanding their range (Parmesan Reference Parmesan2006).
Under the assumption that populations of species from diverse groups will be able to follow their climatic niches that could potentially change geographically in the face of future climate changes, such populations could move from their original ranges to new places (Tingley et al. Reference Tingley, Monahan, Beissinger and Moritz2009, Feeley et al. Reference Feeley, Rehm and Machovina2012). This process will be further exacerbated by landscape transformation which will further modify the characteristics of potentially available habitat (Brown and Maurer Reference Brown and Maurer1989, Walther et al. Reference Walther, Post, Convey, Menzel, Parmesan, Beebee and Bairlein2002, Ricciardi Reference Ricciardi2007).
Changes in geographical distributions suggest that some species will have to interact with species that were previously geographically separated, thus modifying the configuration of pre-existing communities (Walther et al. Reference Walther, Post, Convey, Menzel, Parmesan, Beebee and Bairlein2002, Walther Reference Walther2010). These modifications of geographical ranges could alter the dynamics of biotic interactions such as competition, which could lead either to the exclusion of one of the species or to coexistence between them (Sommer and Worm Reference Sommer and Worm2002). When an expanding species occupies the area of a species with similar diets and habits, and that species has evolved in the absence of the other species, it may result in the competitive exclusion of the least competitive species (Carrete et al. Reference Carrete, Lambertucci, Speziale, Ceballos, Travaini, Delibes and Donázar2010). Environmental changes generated by anthropogenic action generally cause a reduction of the area of distribution, a decrease in population sizes and an increase in the probability of extinction (Schneider et al. Reference Schneider, Semenov, Patwardhan, Burton, Magadza, Oppenheimer, Yamin, Parry, Canziani, Palutikof, van der Linden and Hanson2007). On the other hand, species that respond positively to these transformations increase colonization into new areas (McKinney and Lockwood Reference McKinney and Lockwood1999).
There is strong evidence that the Black Vulture Coragyps atratus is favoured by anthropogenic intervention, since it frequently seeks food in garbage dumps and consumes cattle carrion (del Hoyo et al. Reference Del Hoyo, Elliot and Sargatal1994, Carrete et al. Reference Carrete, Lambertucci, Speziale, Ceballos, Travaini, Delibes and Donázar2010, Barbar et al. Reference Barbar, Werenkraut, Morales and Lambertucci2015). Previously this species was limited to highly productive tropical environments, but it has expanded its distribution in North America and throughout South America (del Hoyo et al. Reference Del Hoyo, Elliot and Sargatal1994, Carrete et al. Reference Carrete, Lambertucci, Speziale, Ceballos, Travaini, Delibes and Donázar2010). In recent years, its population size has increased to the point of being currently considered the world’s most abundant avian scavenger (Carrete et al. Reference Carrete, Lambertucci, Speziale, Ceballos, Travaini, Delibes and Donázar2010, Valéry et al. Reference Valéry, Fritz and Lefeuvre2013). As a result of this expansion its geographical distribution has overlapped partially with similar species such as the Andean Condor Vultur gryphus (Carrete et al. Reference Carrete, Lambertucci, Speziale, Ceballos, Travaini, Delibes and Donázar2010).
For South American avian scavengers, the hierarchy between sympatric species is governed by body size. The Andean Condor dominates the smaller scavenger species such as the Black Vulture (Wallace and Temple Reference Wallace and Temple1987). However, in habitats where the Black Vulture is more abundant, it is a strong competitor to female and juvenile Andean Condors (Carrete et al. Reference Carrete, Lambertucci, Speziale, Ceballos, Travaini, Delibes and Donázar2010). Wallace and Temple (Reference Wallace and Temple1987) suggested that the Black Vulture is dominant over other species when it is found in large groups (> 50 individuals). This new interaction with the Black Vulture can affect the conservation of the Andean Condor, whose females have a higher mortality rate than males (Lambertucci et al. Reference Lambertucci, Carrete, Donázar and Hiraldo2012).
The coexistence of ecologically similar species depends in part on the evolution of a differential use of resources, mediated by mechanisms such as the partition of resources, niche segregation, or by facilitative processes between species (Sommer and Worm Reference Sommer and Worm2002). These processes are possible when evolutionary histories are shared over long periods of time (Mundy et al. Reference Mundy, Butchart, Ledger and Piper1992, Rice and Pfennig Reference Rice and Pfennig2008, Carrete et al. Reference Carrete, Lambertucci, Speziale, Ceballos, Travaini, Delibes and Donázar2010). Based on historical records, the distribution of the Black Vulture and the Andean Condor did not overlap until less than 100 years ago (Houston Reference Houston1985, Tonni and Noriega Reference Tonni and Noriega1998). This is a very short period for the evolution of behaviours that facilitate their coexistence. Recent research conducted in Argentina’s Patagonia (Ballejo et al. Reference Ballejo, Lambertucci, Trejo and De Santis2017), suggests that the trophic niches of the Black Vulture and the Andean Condor overlap to a significant degree, especially in rural environments. Since they have a similar diet based on domestic and introduced species, this could put populations of Andean Condor at risk in those environments where the Black Vulture increases in numbers.
Carrion is an ephemeral resource irregularly distributed both spatially and temporally (Carbone et al. Reference Carbone, Turvey and Bielby2011, Shepard and Lambertucci Reference Shepard and Lambertucci2013), so an increase in sympatry between these two species can increase interspecific competition. Predicting the possible effects of global environmental changes and anthropogenic transformations of the landscape on the geographical distributions of these two species would allow an evaluation of the potential increase in interspecific competition and a prognosis for the future conservation of the Andean Condor.
In this study, we aimed to evaluate, through the modelling of ecological niches (MNE), the hypothesis that distributions of the Black Vulture and the Andean Condor will be modified by the effect of future climate changes in the Andean Region. Such changes might include an increase in the areas of sympatry between the two species. Additionally, we expected that the coexistence of the Andean Condor in the northern Andes will be compromised in favor of the Black Vulture, taking into account the current trends of land use and human expansion. We evaluated this hypothesis through the projection of the current anthropogenic impacts on the environment to future scenarios using Geographic Information System (GIS) techniques.
Methods
Study species
The Andean Condor is one of the largest flying birds in the world with a 3 m wingspan and weight varying between 7.5 and 15 kg (Ferguson-Lees and Christie Reference Ferguson-Lees and Christie2001). They are monogamous and have a low reproductive rate (Ferguson-Lees and Christie Reference Ferguson-Lees and Christie2001, Lambertucci Reference Lambertucci2007) with a single egg laid every two or three years (Wallace and Temple Reference Wallace and Temple1987). The Andean Condor feeds on the carrion of large- and medium-sized vertebrates, both wild and domesticated (Ferguson-Lees and Christie Reference Ferguson-Lees and Christie2001). They secure this food by searching through long flights that can reach up to 340 km per day (Lambertucci et al. Reference Lambertucci, Alarcón, Hiraldo, Sanchez-Zapata, Blanco and Donázar2014).
The Andean Condor is currently distributed along the Andes Cordillera from Venezuela to Tierra del Fuego (del Hoyo et al. Reference Del Hoyo, Elliot and Sargatal1994, Ferguson-Lees and Christie Reference Ferguson-Lees and Christie2001, Lambertucci Reference Lambertucci2007). The bird can reach 5,200 m in altitude, and occasionally it is observed below 3,000 m in Ecuador and Colombia and at sea level in some localities of Peru, Chile, and Argentina (Ferguson-Lees and Christie Reference Ferguson-Lees and Christie2001). The species is considered globally ‘Near Threatened’ (NT) on the IUCN Red List (BirdLife International 2017). However, its conservation status is critical in the northern Andes (Venezuela, Colombia, Ecuador and Perú) (Lambertucci Reference Lambertucci2007).
The Black Vulture has a very wide distribution in America. It is abundant locally and is associated with open and urban areas such as garbage dumps, slaughterhouses, fishing ports and roads (Ferguson-Lees and Christie Reference Ferguson-Lees and Christie2001). The bird is distributed from sea level to 2,700 m and rarely exceeds 3,000 m, mainly north of the Andes in Colombia and Peru (Ferguson-Lees and Christie Reference Ferguson-Lees and Christie2001, Márquez et al. Reference Márquez, Bechard, Gast and Vanegas2005). It is a highly gregarious and aggressive species, particularly when near carrion where at times more than 200 individuals concentrate (Wallace and Temple Reference Wallace and Temple1987, Carrete et al. Reference Carrete, Lambertucci, Speziale, Ceballos, Travaini, Delibes and Donázar2010). It lays 1–3 eggs a year and feeds on carrion of variable size but can also hunt small prey such as birds, insects or reptiles. Its weight varies between 1.18 and 2 kg and its wingspan reaches 1.5 m (Ferguson-Lees and Christie Reference Ferguson-Lees and Christie2001, Campbell Reference Campbell2016).
Spatial and statistical analysis
Two modelling algorithms that have demonstrated excellent performance and do not require absence data (Tsoar et al. Reference Tsoar, Allouche, Steinitz, Rotem and Kadmon2007) were used to predict the effect of global environmental change on the distributions of these two species: MaxEnt (Phillips et al. Reference Phillips, Anderson and Schapire2006) and the Genetic Algorithm for Rule-set Production (GARP) (Stockwell and Noble Reference Stockwell and Noble1992).
The MaxEnt algorithm estimates the species’ distribution from presence and background data to find the distribution of maximum entropy (Phillips et al. Reference Phillips, Anderson and Schapire2006). The resulting model reveals the relative probability of the distribution of the species over all the pixels of a grid in a defined geographical space (Phillips et al. Reference Phillips, Anderson and Schapire2006). Although to date alternative parametrization processes exist (e.g. Muscarella et al. Reference Muscarella, Galante, Soley-Guardia, Boria, Kass, Uriarte and Anderson2014), we used the default parameters based on an extensive empirical tuning study (Phillips and Dudík Reference Phillips and Dudík2008). The models were generated using a random sample of 80% of the presence data as training data and the remaining 20% were used to evaluate the model, and the logistic output was used to obtain suitability values. To obtain binary presence / absence maps, the threshold defined by the value "10 percentile training presence" was used (Phillips et al. Reference Phillips, Anderson and Schapire2006).
As an alternative approach we used GARP, a learning algorithm that combines environmental data with the localities of occurrence of the species to produce a model of their requirements in these environmental dimensions (Stockwell and Noble Reference Stockwell and Noble1992). For the elaboration of the models with GARP, the process suggested by Anderson et al. (Reference Anderson, Lew and Peterson A2003) was followed using a sample of 80% of the data as training data and 20% as validation data, using 1,000 iterations with a convergence limit of 0.001. The 10 best models were selected (best subsets) with a specific error of omission of 10% and one of commission of 50%. These 10 models were then summed in ArcMap Ver. 10.2 (ESRI 2010) generating a consensus map.
To calculate the changes in the distributions in the future scenarios (losses, gains and areas that remain stable) the function BIOMOD_RangeSize of the R software package biomod2 was used (Thuiller et al. Reference Thuiller, Georges and Engler2015). Finally, the areas of overlap in the distribution of the two species were established using ArcGis 10.2.
In order to identify the regions with greater or lesser loss of geographic distribution or overlap, the Andes Cordillera was divided into three regions: Northern Andes (Venezuela, Colombia and Ecuador), Central Andes (Perú and Bolivia) and Southern Andes (Chile and Argentina). The political boundaries of these countries were used to establish the distribution and overlap in each of the regions.
Environmental and species presence data
Presence data of both species were obtained from: 1) Global Biodiversity Information Facility database from 2000 to 2018; 2) records compiled in the literature (e.g. McGahan Reference McGahan1972, Heredia and Piedrabuena Reference Heredia and Piedrabuena2010, Lambertucci Reference Lambertucci2010, Gargiulo, Reference Gargiulo2014); 3) data provided by researchers (R. Morales pers. comm.) and 4) georeferenced field records, obtained by the first author for Colombia between the years 2002 and 2014. Data from all the Andean countries were used, including confirmed records of nesting and roosting sites. Duplicate or doubtful records were excluded. In total, 85 records were collected for the Andean Condor and 329 for the Black Vulture (Figure S1 in the online supplementary material).
To develop the predictive models, we used 19 climatic variables obtained from the WorldClim project database (Hijmans et al. Reference Hijmans, Cameron, Parra, Jones and Jarvis2005) and the slope percentage obtained from the CGIAR 90-m digital elevation model (Jarvis et al. Reference Jarvis, Reuter, Nelson and Guevara2008). Variables like wind and livestock distribution were not included in the analysis due to the lack of projections of those variables for future scenarios.
For future scenarios (2050–2070), the global climate models of three laboratories: ACCESS1-0 (Commonwealth Scientific and Industrial Research Organization and Bureau of Meteorology), HadGEM2-AO (Met Office Hadley Centre) and MIROC5 (Model for Interdisciplinary Research on Climate), and three representative routes of concentration of emissions were used: RCP2.6 (low emissions), RCP4.5 (medium emissions) and RCP8.5 (high emissions). The models were downloaded from WorldClim (www.worldclim.org) as digital layers based on the same bioclimatic variables used to generate the distributional models of the current scenario. All the layers (current and future scenarios) were converted to raster format and homogenized to a cell size of 2.5 minutes (~4.5 km) with the help of ArcMap Ver. 10.2 (ESRI 2010) (Table S1).
We reduced co-linearity by excluding pairs of variables with Pearson’s correlation. The variables included in the final distribution models were selected using a MaxEnt jackknife test according to the percent contribution and permutation importance value of each variable. To evaluate the accuracy of the models partial ROC curves were used (Peterson et al. Reference Peterson, Papeş and Soberón2008).
The variables used for the final models of the Andean Condor were mean daytime range (bio2), isothermality (bio3), maximum temperature of the warmest month (bio5), mean temperature of driest quarter (bio9), precipitation of driest month (bio14), precipitation seasonality (bio15), precipitation of coldest quarter (bio19) and the slope, among which the most important were mean temperature of driest quarter, slope percentage and precipitation seasonality (Table 1). For Black Vulture, the variables used in the final models were mean daytime range (bio2), seasonality of temperature (bio4), maximum temperature of the warmest month (bio5), mean temperature of driest quarter (bio9), precipitation seasonality (bio15), precipitation of warmest quarter (bio18), precipitation of coldest quarter (bio19) and the slope. The variables that showed a greater influence in the Jackknife test were temperature seasonality, mean temperature of driest quarter and mean diurnal range (Table 1).
Table 1. Percentage contribution of each variable to the current distribution models of V. gryphus and C. atratus obtained with the Maxent algorithm. Percentage contribution: measures the increase in likelihood associated with modelling rules based on each environmental variable and then divides this by the total gain in likelihood to calculate the percent of the total gain associated with each variable (Phillips Reference Phillips2017). Permutation importance: randomizes the values for each environmental variable between the presences and background points in order to make that variable uninformative and then measures the resulting drop in area under the curve AUC. Values are normalized to give percentages (Phillips Reference Phillips2017).

Measurement of niche overlap
To compare the ecological niches of the two species we used a modification of the niche equivalency and similarity tests (Warren et al. Reference Warren, Glor and Turelli2008). These statistics allow the identification of differences in environmental preferences, considering the use and availability of environments for both species (Broennimann et al. Reference Broennimann, Fitzpatrick, Pearman, Petitpierre, Pellissier, Yoccoz and Guisan2012, Petipierre et al. Reference Petipierre, Kueffer, Broennimann, Randin, Daehler and Guisan2012). The availability of environments is quantified directly on all available environments for each species; that is, all environments within the areas of potential distribution of each species. Thus the comparison between two niches can be used to calculate niche overlap using the D metric (Schoener Reference Schoener1970, reviewed in Warren et al. Reference Warren, Glor and Turelli2008).
Thus, we evaluated the niche equivalency and niche similarity hypotheses of Warren et al. (Reference Warren, Glor and Turelli2008) with this method using null models. For the niche equivalency hypothesis, the identity of the occurrences is first randomised among the observed occurrences of the two species using iterations and then the difference in niche preference is quantified. If the niches of the two lineages are identical, the observed value should not be different from the null model expectation. Next, differences in niche preferences are quantified per iteration and the observed difference is compared to the distribution of the simulated differences. The latter evaluates if the observed difference is higher or lower than what would be expected by the null model (Warren et al. Reference Warren, Glor and Turelli2008, Glor and Warren Reference Glor and Warren2010).
Finally, to perform Warren’s tests modified by Broennimann et al. (Reference Broennimann, Fitzpatrick, Pearman, Petitpierre, Pellissier, Yoccoz and Guisan2012), we used the same set of occurrences and environmental variables as in the niche models and performed a Principal Component Analysis on all the available environments (using standardized values of the variables) for the Andean Condor and the Black Vulture. We used the Ecospat package in R (Di Cola et al. Reference Di Cola, Broennimann, Petitpierre, Breiner, D’Amen, Randin and Guisan2017) to estimate the density of occurrences and to quantify niche similarity between the two species in environmental space. Significance was evaluated by the position of the observed value in relation to the distribution of simulated values under the null models of each hypothesis.
Analysis of human influence
The effect of human influence on the distributions of both species was evaluated by the Global Human Influence Index generated by Wildlife Conservation Society (WCS) and Columbia University Center for International Earth Science Information Network (CIESIN). This is a raster format coverage of 30 seconds of resolution (~1 km2), created from nine global data layers (population density, buildings, nighttime lights, land use, land cover, coastal lines, roads, railways and navigable rivers) (Wildlife Conservation Society and Center for International Earth Science Information Network - CIESIN - Columbia University 2005).
To establish the possible effects of human influence, a current interval of variation of the Human Influence Index (HII) for South America was established, which varies between 0 and 67 (United Nations 2014). To generate projections of this index in the two future scenarios (2050 and 2070) and two different human influence scenarios (moderate and accelerated), the average annual urbanization rate estimated by the United Nations for South America (United Nations 2014), corresponding to 0.3% (moderate scenario) and the urbanization rate of Bolivia (0.6%), that corresponds to the highest rate of urbanization among the South American countries for 2014 (accelerated scenario), were used as a proxy of the future change in the human influence. With the GIS the cells of the original HII raster file were reclassified into five categories to facilitate the projections (Table S2).
Taking into account that the percentage of change for each cell will not be the same, the cells with different coefficients were modified under two assumptions: 1) the percentage of change would be greater in the cells with higher influence indices, and would decrease in the cells of lower current influence index; 2) the change rate would remain constant over time. The entire percentage rate was added (0.3% for moderate scenario and 0.6% for accelerated scenario) to the cells of the high influence category, 75% of the rate to cells of moderate influence, 50% to the cells of low influence and 25% to cells of very low influence. Each percentage was added to each year from 2014 until 2050 or 2070 according to the future scenario. No modification was made to the cells of the very high influence category since they correspond to the areas that have been highly urbanized (Table S2).
For each climate change scenario obtained by the ecological niche analysis, the layers of human influence were clipped with the areas of overlap between the Andean Condor and the Black Vulture. Finally, the proportion of each of the human influence categories was established to determine the possible effect of urbanization on the distribution of species in future scenarios.
Results
Effect of climate change on the distribution areas of the species
According to the GARP algorithm, the area of distribution of the Andean Condor for the current scenario corresponded to 2,560,000 km2 (approximation based on the number of pixels generated by the model). A reduction of the current distribution of 18–22% (2050) and 24–32% (2070) is predicted (Table 2). In all cases, the model predicted that there would be a reduction in geographical distribution over time, particularly with the scenarios of higher greenhouse gas emissions (Table 2). The main areas of reduction of the distribution of the Andean Condor will be from the northern region of the Andes (Venezuela, Colombia and Ecuador) and in the south-eastern Andes in Argentina. There were increases in the Andes of northern Chile, as well as in Patagonia in Argentina (Figure 1).
Table 2. Shifts of the geographic range areas of V. gryphus and C. atratus for each model with the percentage of area lost and compared to the current scenario. ACCESS 1.0: Australian Community Climate and Earth System Simulator, HadGEM2-AO: Hadley Global Environment Model 2 (Atmosphere-Ocean), MIROC 5: Model for Interdisciplinary Research On Climate version 5.


Figure 1. Shifts of the geographic range of V. gryphus (a, b) and C. atratus (c, d) in two scenarios: Current distribution (a, c) and 2070 distribution with RCP 8.5 (b, d). Grey areas in b and d show the regions where there is no shift in the distribution between future scenarios and current scenario (stable); red areas correspond to the portions where the current distribution reduces in the 2070 scenario (loss) and green where the distribution increases (gain). Models were performed with GARP.
The area of distribution of the Black Vulture for the current scenario corresponded to 3,390,000 km2. For future scenarios a reduction of 31–52% (2050) and 15–60% (2070) is predicted (Table 2). The main areas of reduction of Back Vulture distribution would correspond to low areas such as the Colombian and Peruvian Amazon. A displacement of the area of distribution towards large parts of the Andes cordillera is predicted, especially in the projected scenarios for 2070 (Figure 1).
According to the MaxEnt algorithm, the area of distribution of the Andean Condor for the current scenario corresponded to 1,800,000 km2 (29.5% less with respect to the GARP algorithm) and decreasing between 14% and 37% (2050) and between 21% and 35% (2070) (Table 2).
For the Black Vulture, the area of distribution in the current scenario was 2,700,000 km2 (20% less compared to the GARP algorithm). The projected reduction for 2050 varies between 19% and 53% and for 2070 between 17% and 51%. In all cases, the reduction increases in RCP 4.5 and 8.5.
Overlap of the areas of distribution
According to the GARP algorithm for the current scenario, the model predicts an overlap of 260,000 km2 (10% of the distribution of the Andean Condor) located mostly in the northern Andes (Ecuador, Colombia), in some sectors of the Bolivian Andes and on the Chilean coast (Table 3, Figure 2). In all models obtained for the future scenarios, a reduction is predicted in the area of overlap, varying between 44% and 70% for 2050 and 30% and 53% for 2070 with respect to the area of overlap of the current scenario. The greatest reductions in the overlap are seen when using the MIROC 5 models (Figure S2). The models obtained for the future scenarios suggest a displacement of the areas of overlap towards higher elevations that vary between 250 and 1,500 m on the altitudinal gradient. This displacement is higher in the scenario of higher emissions (RCP 8.5) in 2070 (Figure S3).
Table 3. Shifts in overlap areas between V. gryphus and C. atratus in different climatic change scenarios and regions (Northern Andes, Central Andes and Austral Andes). Models performed with GARP for ACCES 1.0 scenarios. Areas in square kilometers.

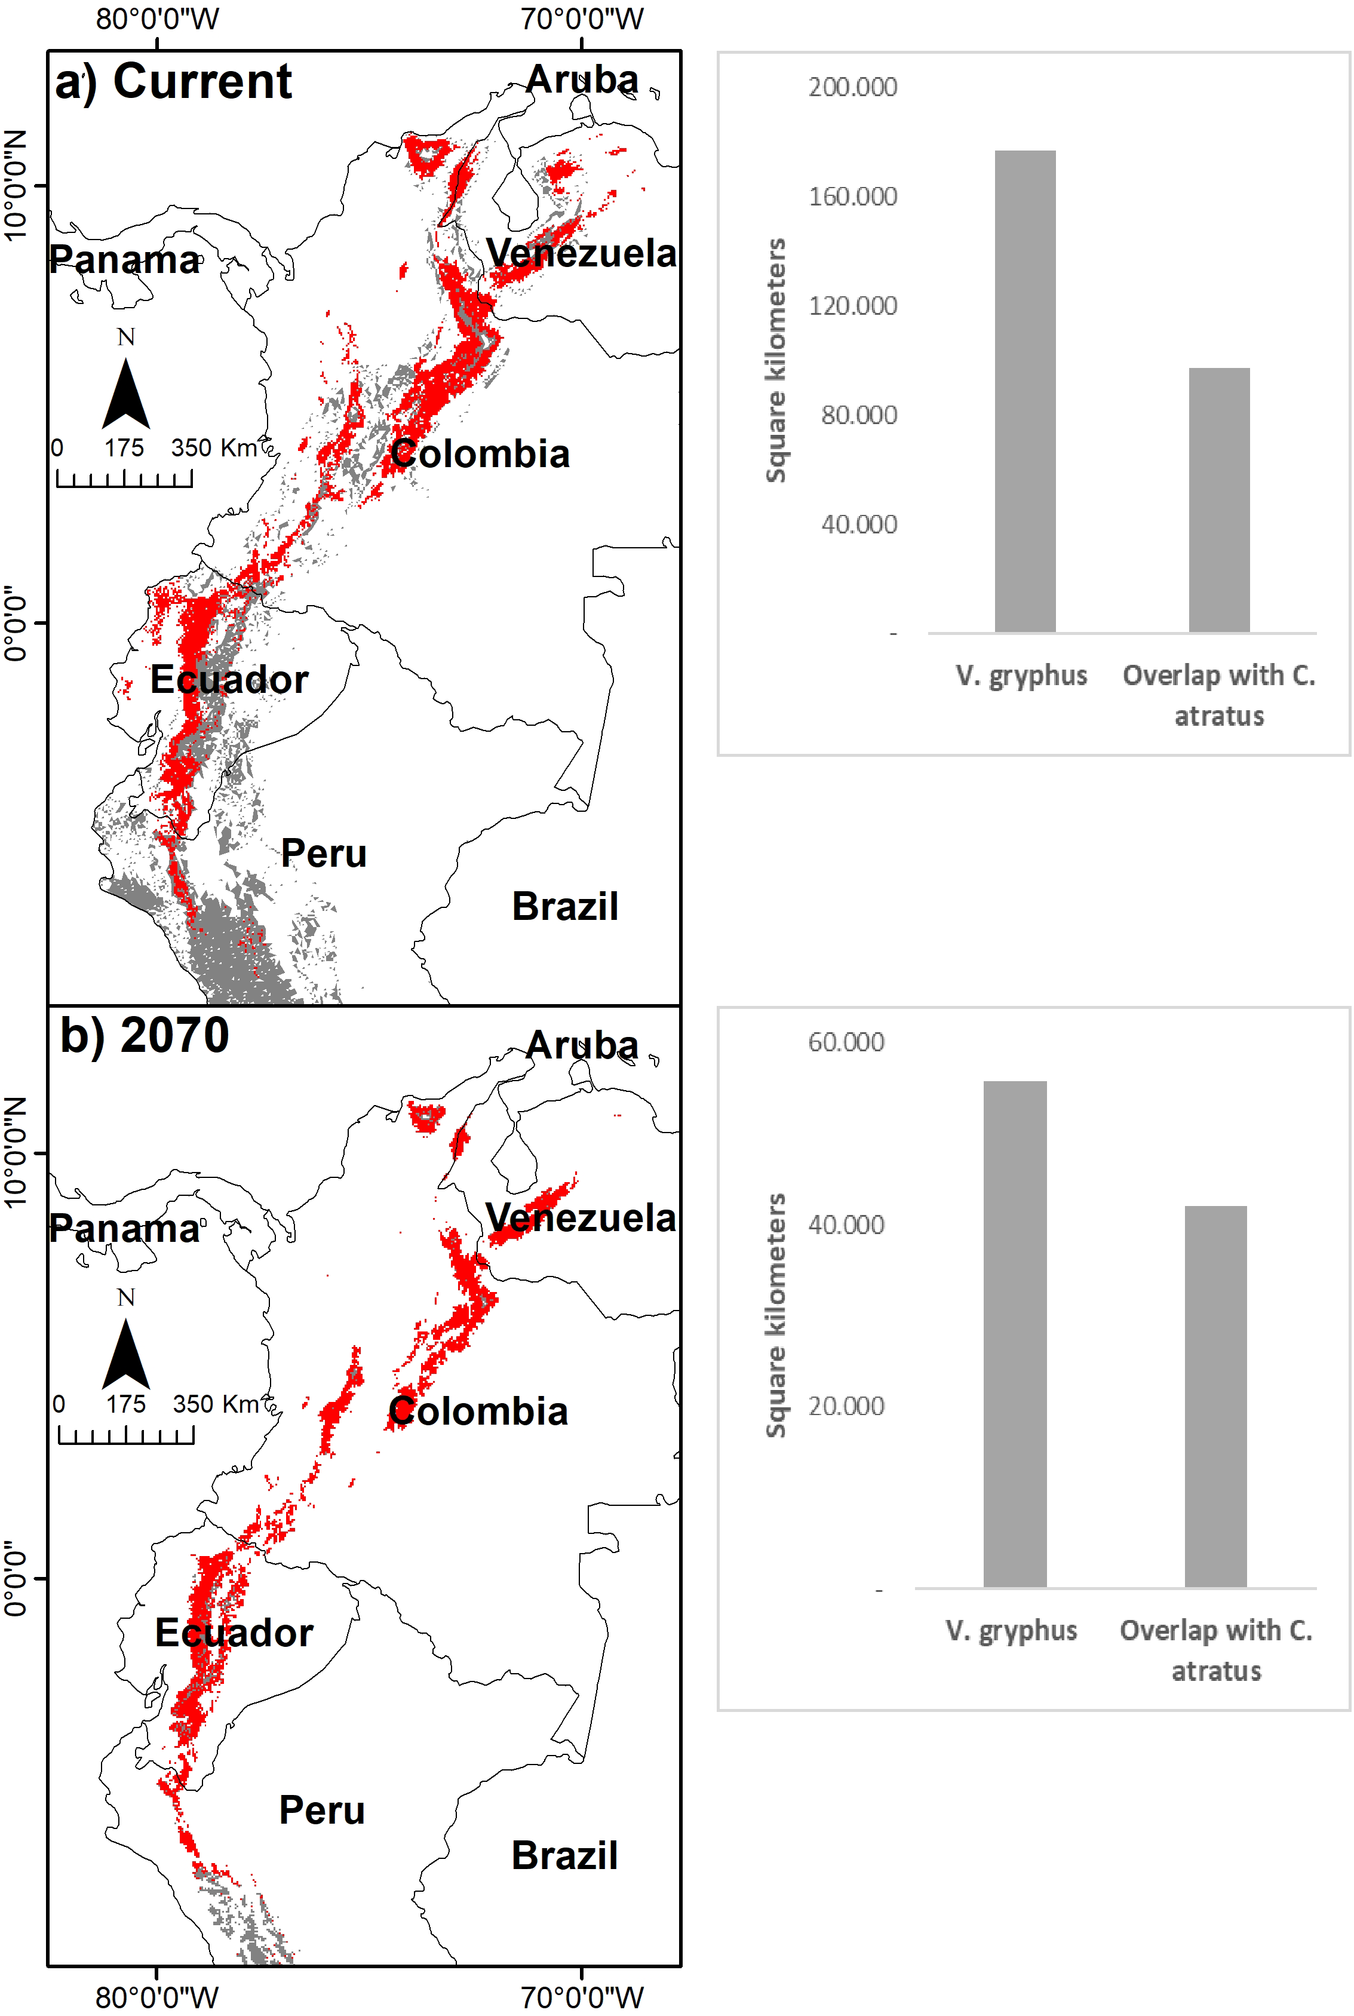
Figure 2. Overlapping potential areas obtained with GARP between V. gryphus and C. atratus in Northern Andes under a current scenario (a) and under 2070 scenario (ACCES 1.0, RCP 8.5) (b). Red colour represents overlapping areas and grey represents the geographic range areas of V. gryphus for each scenario. Bars to the right show the geographic range and areas of overlap in approximate square kilometers for each scenario.
According to the MaxEnt algorithm, the area of overlap predicted for the current scenario was approximately 400,000 km2 (22% of Andean Condor distribution for the current scenario and 36% greater than the area predicted by GARP). All models obtained using MaxEnt suggest a reduction in the areas of overlap of the two species in future scenarios. However, most models show greater reductions in the 2070 scenarios. The reductions in overlap vary between 7% and 27% by 2050 and between 9 and 28% by 2070 with respect to the current scenario. Although some scenarios predict a shift to higher areas of overlap in the future (e.g. HadGEM2-AO), this trend is not as evident as that found with the GARP algorithm (Figure S3).
When considering all the countries that make up the Andes, we predict that the overlap between species tends to be reduced in future. When performing analysis by region the trend remains, however the Northern Andes shows higher percentages of overlap in all scenarios (39–75%), especially in the model obtained for the year 2070 with RCP 8.5 (Table 3). The central and austral Andes showed overlap areas of less than 15% (Table 3).
Measurement of niche overlap
The niche equivalency and similarity tests suggest that the ecological niches of the Andean Condor and the Black Vulture are more different than the expected by the null model (Figure 3). The PCA also showed that 67% of the environmental variation is explained by the first two components (Figure 3). The presence density surfaces suggest that the two species are distributed mainly in the environmental gradient of the first component; the Andean Condor prefers environments with low temperatures and low precipitation as well as more homogeneous seasonality in precipitation and the Black Vulture is found in more variable precipitation and temperature environments (Figure 3).

Figure 3. Measurement of niche overlap between the two species in environmental space. Principal Component Analysis (top right) and the representation of the ecological niches in the first two axes using a smoothed kernel density function of observed occurrences of the Black Vulture (top centre) and Andean Condor (top left). The grey-to-black shading represents the grid cell density of the species’ occurrences (black being the highest density) while a white background color indicates the environmental conditions in which the species were not recorded. The first dashed line represents the 50% of the available environment and the solid line represents the 100% (top). In the bottom (left) is the histogram showing the results of equivalency test; and the niche similarity test between the Black Vulture vs. the Andean Condor (center) and the Andean Condor vs. the Black Vulture (right).
Effect of human influence on the distribution areas of the species
The analysis of change of human influence in the areas of overlap of the species did not show a clear trend between the evaluated scenarios. When considering the categories of greatest influence (moderate, high and very high), human influence in the areas of overlap will be greater for the northern Andes (< 15%), with intermediate influences in the southern Andes (< 12%) and low influence in the central Andes (< 5%) (Figure S4).
Discussion
Through dispersal, species can follow favourable climatic conditions (both latitudinally or altitudinally) as an adaptive response to climate change (Bellard et al. Reference Bellard, Bertelsmeier, Leadley, Thuiller and Courchamp2012). There have been changes in the latitudinal or altitudinal ranges in more than 1,000 species, especially in those with high dispersion capacities (Parmesan Reference Parmesan2006). However, it should be considered that these displacements could also imply a reduction in populations and an increase in the risk of extinction. This is particularly important for the Andean Condor which has more specific ecological requirements, compared to the Black Vulture. In addition, it has been proposed that species of large body size and with low reproductive rates (as in the case of the Andean Condor) will be more prone to extinction (Pimm et al. Reference Pimm, Raven, Peterson, Şekercioğlu and Ehrlich2006, Dirzo et al. Reference Dirzo, Young, Galetti, Ceballos, Isaac and Collen2014).
Our analyses showed that the Black Vulture uses diverse environments, from tropical to temperate, in comparison with the Andean Condor that is restricted to colder environments. In addition, the results suggest changes in the distributions and in the altitudinal ranges of both the Andean Condor and the Black Vulture as a consequence of possible future climate changes. These changes also suggest the increase in the percentage of overlap between the two species in the Northern Andes under some climate change scenarios, which in conjunction with human intervention may exacerbate the impact that these changes can have on species and their interactions (Travis Reference Travis2003).
The geographic displacement of the climatic niches results in either the species moving towards regions that meet those conditions or that they are extirpated locally, since the possibility of adaptation (due to temporary restrictions in the modification of their physiology and other life history traits) is unlikely in such short periods (Bellard et al. Reference Bellard, Bertelsmeier, Leadley, Thuiller and Courchamp2012, Jezkova and Wiens Reference Jezkova and Wiens2016). Using the models obtained, displacements in the areas of distribution of the two species are predicted under all scenarios, whereby the Andean Condor tends to move towards areas of lower elevation and the Black Vulture tends to move towards higher elevations. It has been shown that some species, including 361 bird species in Great Britain, Finland and North America (Chen et al. Reference Chen, Hill, Ohlemüller, Roy and Thomas2011), have already moved latitudinally at an average rate of 16.9 km per decade poleward and altitudinally they have moved upwards at an average rate of 11 m per decade. These trends increase with higher levels of warming.
In all models, there is a tendency towards a reduction in the area of distribution of both species. In the case of the Andean Condor this loss is marked both in areas where wild populations of condors are currently found as well as in areas where reintroductions have been carried out, such as the central mountains of Argentina and the Patagonian steppes (eastern Argentina), the Illescas peninsula in Peru, and the Sierra Nevada de Santa Marta and the eastern mountain ranges of Colombia. In the case of the Black Vulture, all the models suggest a range in the Amazonian region and in the foothills of the eastern slope of the central Andes between Peru and Bolivia.
The models also predict important displacements in the distribution of the Black Vulture from flat areas towards the Andes cordillera that could reach more than 1,000 km for the scenarios with the highest emissions in 2070 (Figure 1). This trend is related to the low climatic variability that occurs in flat and low areas compared to the mountainous areas where the climatic variation is more pronounced (Hijmans et al. Reference Hijmans, Cameron, Parra, Jones and Jarvis2005). Although the Black Vulture is more abundant in flat and low areas, it also uses mountain environments. It has been recorded in high areas of Peru, Bolivia and Colombia, feeding at landfills at more than 4,000 m (Márquez et al. Reference Márquez, Bechard, Gast and Vanegas2005, Carrete et al. Reference Carrete, Lambertucci, Speziale, Ceballos, Travaini, Delibes and Donázar2010). In contrast the Andean Condor, due to its size, needs steep areas and deep canyons to be able to fly, and these are less frequent conditions in areas of lower elevation (Ferguson-Lees and Christie Reference Ferguson-Lees and Christie2001, Lambertucci Reference Lambertucci2007, Shepard et al. Reference Shepard, Wilson, Rees, Grundy, Lambertucci and Vosper2013).
All climate change scenarios predict a decrease in the areas of overlap between both species in the future. However, the projected decrease in the range of the Andean Condor could generate greater percentages of overlap in the region of the Northern Andes where the species is at greater risk of extinction (Lambertucci Reference Lambertucci2007, Renjifo et al. Reference Renjifo, Amaya-Villarreal, Burbano-Girón and Velásquez-Tibatá2016). Particularly in the northern Andes, an increase in human influence is expected in future scenarios (United Nations 2014). The combined effect of climate change with ecosystem transformation could generate greater changes in the distribution and ecological interactions between both species, further threatening this synergistic effect on the Andean Condor, whose ecological requirements are very specific (Travis Reference Travis2003, Brook et al. Reference Brook, Sodhi and Bradshaw2008).
The changes in the area of distribution of the Andean Condor, together with an increase in the amount of overlap with the Black Vulture in the northern Andes, could increase the probability of local disappearance of the Andean Condor and in the long term could result in the species´ total extinction as a result of competition. Nevertheless, the real effect of competition needs further research, as in this study we prove only a possible increase in geographic overlap.
The displacement of the Andean Condor could increase the probability of conflict with humans in areas of lower elevation, where there are more human settlements. Temperature increases could facilitate the expansion of human activities towards higher zones, increasing conflicts with the Andean Condor, which according to our results will be more striking in the northern Andes.
It has been suggested that most of the variations in the distribution of tropical bird species will occur in mountainous regions of Central America and in the Andes region where mountain-dwelling species are more vulnerable to the effects of climatic change, increasing the risk of extinction (Sekercioglu et al. Reference Sekercioglu, Schneider, Fay and Loarie2008, Reference Sekercioglu, Primack and Wormworth2012). Although it is predicted that the Andean Condor will have a wider altitudinal range (expansion towards lower areas of the Andes: 1,000–2,000 m in the Northern Andes and 0–1,000 m in some sectors of the Southern and Central Andes), it should be considered that it is precisely in the lower regions where there is greater transformation and human presence, and this would increase the risk of extinction for the Andean Condor due to conflicts with humans.
Particularly in the northern Andes, the most transformed areas are between 1,500 and 3,000 m (Martínez et al. Reference Martínez, Becerra, Cuesta and Qiñonez2009) and this would increase the possibility of contact between human communities and Andean Condor according to our results for future scenarios. At this elevation, the models predict greater overlap between the two species (Figure S3). In this scenario, the Black Vulture is expected to be more successful, considering that it is favoured by the presence of humans (del Hoyo et al. Reference Del Hoyo, Elliot and Sargatal1994, Carrete et al. Reference Carrete, Lambertucci, Speziale, Ceballos, Travaini, Delibes and Donázar2010, Barbar et al. Reference Barbar, Werenkraut, Morales and Lambertucci2015), in contrast to the Andean Condor whose main threats are related to anthropogenic intervention (poisoning, hunting and collision with power lines) (Lambertucci Reference Lambertucci2007, Lambertucci et al. Reference Lambertucci, Speziale, Rogers and Morales2009, Reference Lambertucci, Donázar and Hiraldo2010, Reference Lambertucci, Donázar, Huertas, Jiménez, Sáez, Sanchez-Zapata and Hiraldo2011). Additionally, the northern region of the Andes, where the models predict a greater variation in distribution, coincides with the areas where the highest growth rates of the human population are found and where the economy is based on the use of natural resources (Dirzo et al. Reference Dirzo, Young, Galetti, Ceballos, Isaac and Collen2014, Beaudrot et al. Reference Beaudrot, Ahumada, O’Brien, Alvarez-Loayza, Boekee, Campos-Arceiz and Andelman2016) a situation that increases the risk for a species like the Andean Condor.
When considering the presence density surfaces for the two species, the Andean Condor is restricted to low temperature environments, while the Black Vulture is found in a greater variety of environments. In a scenario of increased temperature, the environments available for the Andean Condor would be more restricted and certainly at higher elevations compared to today.
It has been documented in Africa that in the absence of vultures, the average decay rates of carcasses and the presence of mammals consuming carrion (rats and feral dogs) increases the risk of disease transmission among mammals (Ogada et al. Reference Ogada, Torchin, Kinnaird and Ezenwa2012). Similar situations could occur in South America with the extinction of the Andean Condor and a reduction in the range of other smaller scavenger species such as Black Vulture, as suggested by the results found in this study.
The probable reduction of the geographic range of a widely distributed scavenger like the Black Vulture could have other ecological and economic implications related to the ecosystem services that scavengers provide to human communities (Moleón et al. Reference Moleón, Sánchez-Zapata, Margalida, Carrete, Owen-Smith and Donázar2014). It has been estimated that the Spanish vulture populations could remove more than 200 tons of bones and more than 8,000 tons of meat each year, representing an economic saving of natural carrion removal of 907,679–1,488,719 EUR (Margalida and Colomer Reference Margalida and Colomer2012). Through an ecosystem-based approach, Markandya et al. (Reference Markandya, Taylor, Longo, Murty, Murty and Dhavala2008) assessed the economic impacts of vulture declines on human health and the relation to an increase in feral dogs and rabies transmission with an estimated $34 billion EUR in healthcare costs between 1993 and 2006. The absence of a currently abundant species like the Black Vulture over large areas as projected in future scenarios, could have similar effects on the human well-being of South American communities as those estimated for Spain and India.
Although the results suggest little similarity between the environments occupied by the two species, the ecologically shared areas are more widely represented in geographical space than the non-shared ones, specifically in some regions such as the northern Andes. This ecological and geographical duality or relationship (Hutchinson duality; Hutchinson Reference Hutchinson1957, Colwell and Rangel Reference Colwell and Rangel2009), suggests a potential increase in sympatry. We must also consider that ecological niche similarity analyses only consider climatic variables, so that their geographical representation of the area actually occupied by the species can vary when taking into account other variables such as biotic interactions and human intervention.
Despite the scarcity of information, climate change was recently included in extinction risk assessments (Maclean and Wilson Reference Maclean and Wilson2011). However, more evidence is showing that in the long- term, climate change will be one of the main threats to biodiversity and human well-being (Bellard et al. Reference Bellard, Bertelsmeier, Leadley, Thuiller and Courchamp2012, Pecl et al. Reference Pecl, Araújo, Bell, Blanchard, Bonebrake, Chen and Griffis2017). Although these model predictions may have a high level of uncertainty, they highlight the importance of the possible effects of future anthropogenic intervention and climate change on threatened species such as the Andean Condor. The effect on common and widely distributed species such as the Black Vulture is also evident. Considering the trends observed in the models that we constructed, it is pertinent to consider the possible effects of climate change on the conservation of the Andean Condor. Human intervention should be considered as an important factor in the modeling of future scenarios. In this way, information and arguments will be available to propose and improve strategies for mitigation, adaptation and control of threats to the Andean Condor and other endangered species.
Supplementary Materials
To view supplementary material for this article, please visit http://dx.doi.org/10.1017/S0959270920000271.
Acknowledgements
This research was supported by Fundación Neotropical and Pontificia Universidad Javeriana. The study was partially funded through research grants awarded to the first author by COLCIENCIAS (Francisco José de Caldas 2011 doctoral grant) and by the Jorge Ignacio Hernández Camacho Scholarship Program – Endangered Species Initiative (research grant No. 5 of 2015). We thank Claudio Mota-Vargas for his support with the niche similarity test and Ruben Morales for providing some Andean Condor presence data.


