


Introduction
The intensity of hurricanes is increasing in the warming waters of the wider Caribbean (Goldenberg et al. Reference Goldenberg, Landsea, Mestas-Nuñez and Gray2001, Webster et al. Reference Webster, Holland, Curry and Chang2005, Biasutti et al. Reference Biasutti, Sobel, Camargo and Creyts2012). The 2017 Atlantic hurricane season was the fifth most active on record, with six major hurricanes (i.e. category 3-5 on the Saffir-Simpson scale), including hurricanes Irma (cat. 5, max. wind speed 285 km h−1) and Maria (cat. 5, max. wind speed 280 km h−1; www.nhc.noaa.gov/). The most evident direct effect of major hurricanes to mature forests is structural vegetation damage (Brokaw and Walker Reference Brokaw and Walker1991, Boose et al. Reference Boose, Serrano and Foster2004, Eppinga and Pucko Reference Eppinga and Pucko2018). However, food limitation is an important indirect effect, particularly for fruit/seed-eating, forest-dependent Caribbean birds, such as quail-doves in the genus Geotrygon (Askins and Ewert Reference Askins and Ewert1991, Waide Reference Waide1991, Wauer and Wunderle Reference Wauer and Wunderle1992, Wiley and Wunderle Reference Wiley and Wunderle1993, Wunderle Reference Wunderle1995, Boal Reference Boal2018). Together with other natural and anthropogenic disturbances (e.g. droughts, fires, volcanic activity, unsustainable hunting, non-native invasive species, habitat loss and degradation), major hurricanes can increase the risk of extirpation or extinction of Caribbean birds with restricted distributions and small populations (Rivera-Milán et al. Reference Rivera-Milán, Ruiz, Cruz and Sustache2003, Reference Rivera-Milán, Collazo, Stahala, Moore, Davis, Herring, Steinkamp, Pagliaro, Thompson and Bracey2005, Reference Rivera-Milán, Bertuol, Simal and Rusk2015, Reference Rivera-Milán, Boomer and Martínez2016, Reference Rivera-Milán, Simal, Bertuol and Boomer2018, Wiley et al. Reference Wiley, Gnam, Koenig, Dornelly, Gálvez, Bradley, White, Zamore, Reillo and Anthony2004, Beissinger et al. Reference Beissinger, Wunderle, Meyers, Sæther and Engen2008, Şekercioğlu et al. Reference Şekercioğlu, Primack and Wormworth2012, Oppel et al. Reference Oppel, Hilton, Ratcliffe, Fenton, Daley, Gray, Vickery and Gibbons2014).
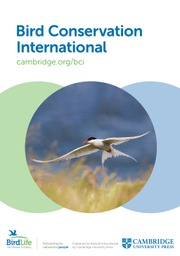
The Bridled Quail-dove Geotrygon mystacea (Figure 1) is a regional endemic with a distribution range stretching from Puerto Rico to St. Lucia (Raffaele et al. Reference Raffaele, Wiley, Garrido, Keith and Raffaele1998, Boal Reference Boal2011, BirdLife International 2008, 2016). Although survey-based abundance estimates are lacking across the distribution range, Bridled Quail-dove populations tend to be small and scattered, and probably were declining on most islands before the 2017 hurricanes (McNair et al. Reference McNair, Yntema, Lombard, Cramer-Burke and Sladen2005, Platenberg et al. Reference Platenberg, Hayes, McNair and Pierce2005, Boal Reference Boal2011, Reference Boal2018, Gemmill Reference Gemmill2015, BirdLife International 2008, 2016). To our knowledge, the only survey-based abundance estimates, corrected for at least one component of detection probability (Buckland et al. Reference Buckland, Anderson, Burnham, Laake, Borchers and Thomas2001, Reference Buckland, Rexstad, Marques and Oedekoven2015, Nichols et al. Reference Nichols, Thomas, Conn, Thomson, Cooch and Conroy2009), were published by Boal (Reference Boal2018) for Bridled Quail-doves on Guana Island, British Virgin Islands, in October 2014 and August 2015. Therefore, we conducted distance-sampling surveys inside and outside the boundaries of the Quill National Park on the island municipality of St. Eustatius, Caribbean Netherlands, each May in 2016-2019.

Figure 1. Bridled Quail-dove Geotrygon mystacea at the Quill National Park, St. Eustatius, Caribbean Netherlands.
Our first objective was to estimate abundance (i.e. density
 $ \hat{D} $
and population size
$ \hat{D} $
and population size
 $ \hat{N} $
), corrected for changes in two components of detection probability (i.e. observer detectability
$ \hat{N} $
), corrected for changes in two components of detection probability (i.e. observer detectability
 $ {\hat{P}}_d $
and Quail-dove availability
$ {\hat{P}}_d $
and Quail-dove availability
 $ {\hat{P}}_a $
), before and after hurricanes Irma and Maria in September 2017. Second, we compared density estimates at transects inside and outside the boundaries of the Quill National Park, as well as along and away from forest trails and three elevation categories within the larger Quill study area. Because of anthropogenic disturbances in foraging habitats (e.g. free-ranging livestock; Debrot et al. Reference Debrot, Hazenbosch, Piontek, Kraft, van Belle and Strijkstra2015, Madden Reference Madden2020), we hypothesized that density estimates would be higher on transects inside than outside the park and away from than along forest trails. In addition, because Quail-doves prefer mature forests and can track changes in fruit/seed production and abundance (Waide Reference Waide1991, Stouffer and Bierregaard Reference Stouffer and Bierregaard1993, Wunderle Reference Wunderle1995, Rivera-Milán Reference Rivera-Milán1996, Steadman et al. Reference Steadman, Robinson, Oswalt, Brandeis, Londono, Reetz, Schelsky, Wright, Hoover, Jankowski, Kratter, Martinez and Smith2009, Boal Reference Boal2018), we hypothesized that density estimates would be higher on transects in middle elevations (range = 201-400 m) with semi-evergreen and evergreen forests (canopy heights > 8 m) than at transects in lower and upper elevations (range = 100-200 and 401-600 m) with semi-deciduous and deciduous-mixed forests (canopy height < 8 m; Van Andel et al. Reference Van Andel, van der Hoorn, Stech and Bantjes2016). Third, we compared pre-hurricane density estimates from the study area in May 2016 and 2017 with Boal’s (Reference Boal2018) density estimates for Guana Island in October 2014 and August 2015. Survey-based abundance estimates, corrected for detection probability, provide much-needed quantitative baselines for assessments of population status and trends on other key conservation sites across the distribution range (e.g. Important Bird Area VG001 on Great Tobago, VI007 on St. John, GP002 on Guadeloupe, KN001 on St. Kitts, and LC002 on St. Lucia; BirdLife International 2008, www.ebird.org/home).
$ {\hat{P}}_a $
), before and after hurricanes Irma and Maria in September 2017. Second, we compared density estimates at transects inside and outside the boundaries of the Quill National Park, as well as along and away from forest trails and three elevation categories within the larger Quill study area. Because of anthropogenic disturbances in foraging habitats (e.g. free-ranging livestock; Debrot et al. Reference Debrot, Hazenbosch, Piontek, Kraft, van Belle and Strijkstra2015, Madden Reference Madden2020), we hypothesized that density estimates would be higher on transects inside than outside the park and away from than along forest trails. In addition, because Quail-doves prefer mature forests and can track changes in fruit/seed production and abundance (Waide Reference Waide1991, Stouffer and Bierregaard Reference Stouffer and Bierregaard1993, Wunderle Reference Wunderle1995, Rivera-Milán Reference Rivera-Milán1996, Steadman et al. Reference Steadman, Robinson, Oswalt, Brandeis, Londono, Reetz, Schelsky, Wright, Hoover, Jankowski, Kratter, Martinez and Smith2009, Boal Reference Boal2018), we hypothesized that density estimates would be higher on transects in middle elevations (range = 201-400 m) with semi-evergreen and evergreen forests (canopy heights > 8 m) than at transects in lower and upper elevations (range = 100-200 and 401-600 m) with semi-deciduous and deciduous-mixed forests (canopy height < 8 m; Van Andel et al. Reference Van Andel, van der Hoorn, Stech and Bantjes2016). Third, we compared pre-hurricane density estimates from the study area in May 2016 and 2017 with Boal’s (Reference Boal2018) density estimates for Guana Island in October 2014 and August 2015. Survey-based abundance estimates, corrected for detection probability, provide much-needed quantitative baselines for assessments of population status and trends on other key conservation sites across the distribution range (e.g. Important Bird Area VG001 on Great Tobago, VI007 on St. John, GP002 on Guadeloupe, KN001 on St. Kitts, and LC002 on St. Lucia; BirdLife International 2008, www.ebird.org/home).
Methods
Study area
St. Eustatius (2,100 ha) has two volcanic centres separated by lowlands inhabited by humans (Collier and Brown Reference Collier, Brown, Wege and Irizarry2008, Van Andel et al. Reference Van Andel, van der Hoorn, Stech and Bantjes2016). Our study area (440 ha) included the Quill National Park (220 ha; Figure 2), which is one of two designated Terrestrial Protected Areas and Important Bird Areas (Collier and Brown Reference Collier, Brown, Wege and Irizarry2008) managed by St. Eustatius National Parks Foundation. The Quill is a dormant stratovolcano that rises to 602 m (Collier and Brown Reference Collier, Brown, Wege and Irizarry2008). The floristic diversity of the study area includes 617 vascular plants (Axelrod Reference Axelrod2017). The vegetation of the study area is similar to other islands across the distribution range of the Bridled Quail-dove (Rivera-Milán Reference Rivera-Milán1996, Rivera-Milán et al. Reference Rivera-Milán, Ruiz, Cruz and Sustache2003, Gemmill Reference Gemmill2015, Steadman et al. Reference Steadman, Robinson, Oswalt, Brandeis, Londono, Reetz, Schelsky, Wright, Hoover, Jankowski, Kratter, Martinez and Smith2009, Van Andel et al. Reference Van Andel, van der Hoorn, Stech and Bantjes2016, Boal Reference Boal2018).

Figure 2. Map of St. Eustatius showing 20-m elevation contour lines, terrestrial protected areas, and the paths of transects surveyed inside and outside the boundaries of the Quill National Park in May 2016-2019. The study area (440 ha) is within the Quill Important Bird Area AN008 (470 ha; 17°29′ N, 62°58′W; Collier and Brown Reference Collier, Brown, Wege and Irizarry2008).
Common plants that may be important food sources for the Bridled Quail-dove include Eugenia spp., Samyda dodecandra, Bursera simaruba, Coccoloba swartzi, Capparis spp., Ternstroemia peduncularis, Erythroxylum havanense, Maytenus laevigata, Coffea arabica, Ardisia obovata, Zanthoxylum martinicense, Guettarda scabra, Bourreria baccata, Chionanthus compactus, Ficus spp., and Ceiba pentandra. However, although primarily a fruit/seedeater, the Bridled Quail-dove also consumes flowers, molluscs, invertebrates, and small vertebrates (Seaman Reference Seaman1966, Boal Reference Boal2008, Reference Boal2011, Steadman et al. Reference Steadman, Robinson, Oswalt, Brandeis, Londono, Reetz, Schelsky, Wright, Hoover, Jankowski, Kratter, Martinez and Smith2009). Foraging habitats in the study area are characterised by partially closed forests with fallen branches and leaves, as well as bare ground with rocks and exposed soil (Figure 3). The 2017 hurricanes caused severe structural vegetation damage (Figure 4; Eppinga and Pucko Reference Eppinga and Pucko2018).

Figure 3. Bridled Quail-dove typical foraging habitat at the Quill study area.

Figure 4 Vegetation at the Quill study area before (A) and after (B) hurricanes Irma and Maria in September 2017.
Distance sampling
Distance sampling is based on estimation of a detection function,
 $ \hat{g}(x) $
in the case of line transects, which decreases with distance x and is needed to estimate detection probability for single individuals or clusters of individuals in the surveyed area (Buckland et al. Reference Buckland, Anderson, Burnham, Laake, Borchers and Thomas2001, Reference Buckland, Rexstad, Marques and Oedekoven2015, Nichols et al. Reference Nichols, Thomas, Conn, Thomson, Cooch and Conroy2009). We modelled detection as a function of distance x and covariates represented by vector z (i.e. g[x, z]; Marques et al. Reference Marques, Thomas, Fancy and Buckland2007, Buckland et al. Reference Buckland, Rexstad, Marques and Oedekoven2015). We estimated density as
$ \hat{g}(x) $
in the case of line transects, which decreases with distance x and is needed to estimate detection probability for single individuals or clusters of individuals in the surveyed area (Buckland et al. Reference Buckland, Anderson, Burnham, Laake, Borchers and Thomas2001, Reference Buckland, Rexstad, Marques and Oedekoven2015, Nichols et al. Reference Nichols, Thomas, Conn, Thomson, Cooch and Conroy2009). We modelled detection as a function of distance x and covariates represented by vector z (i.e. g[x, z]; Marques et al. Reference Marques, Thomas, Fancy and Buckland2007, Buckland et al. Reference Buckland, Rexstad, Marques and Oedekoven2015). We estimated density as
 $$ \hat{D}\hskip0.5em =\hskip0.5em \frac{n\overline{s}}{2 wl{\hat{P}}_a{\hat{P}}_d\left({\mathbf{z}}_i\right)}, $$
where
 $ \hat{\mathrm{D}} $
was the number of individuals ha−1; n was the number of detections of singles or clusters;
$ \hat{\mathrm{D}} $
was the number of individuals ha−1; n was the number of detections of singles or clusters;
 $ \overline{\mathrm{s}} $
was the sample mean, which we used as an unbiased estimator of average cluster size, when cluster detection was not size biased; and l was the number of transects per survey occasion in May 2016-2019. After exploratory data analysis (Buckland et al. Reference Buckland, Anderson, Burnham, Laake, Borchers and Thomas2001, Reference Buckland, Rexstad, Marques and Oedekoven2015, Marques et al. Reference Marques, Thomas, Fancy and Buckland2007), we right truncated the distance data (w = 60 m) and estimated detection probability of available singles and clusters as
$ \overline{\mathrm{s}} $
was the sample mean, which we used as an unbiased estimator of average cluster size, when cluster detection was not size biased; and l was the number of transects per survey occasion in May 2016-2019. After exploratory data analysis (Buckland et al. Reference Buckland, Anderson, Burnham, Laake, Borchers and Thomas2001, Reference Buckland, Rexstad, Marques and Oedekoven2015, Marques et al. Reference Marques, Thomas, Fancy and Buckland2007), we right truncated the distance data (w = 60 m) and estimated detection probability of available singles and clusters as
 $$ {\hat{P}}_d\left({\mathbf{z}}_i\right)=\frac{1}{w}\underset{0}{\overset{w}{\int }}\hat{g}\left(x,{\mathbf{z}}_i\right) dx. $$
When cluster detection was size-biased (Pearson’s correlation coefficient r, P < 0.15), we regressed
 $ \log \left({s}_i\right) $
on
$ \log \left({s}_i\right) $
on
 $ \hat{g}\left({x}_i\right) $
to estimate the value of expected cluster size
$ \hat{g}\left({x}_i\right) $
to estimate the value of expected cluster size
 $ \hat{E}(s) $
where
$ \hat{E}(s) $
where
 $ \hat{g}\left({x}_i\right)\hskip0.5em =\hskip0.5em 1 $
; and we used
$ \hat{g}\left({x}_i\right)\hskip0.5em =\hskip0.5em 1 $
; and we used
 $ \hat{E}(s) $
instead of
$ \hat{E}(s) $
instead of
 $ \overline{s} $
to estimate density (Buckland et al. Reference Buckland, Anderson, Burnham, Laake, Borchers and Thomas2001). We defined a cluster as two or more individuals 10 m from each other, showing similar behaviour (e.g. ground foraging). We used a compass to measure sighting angles and a tape measure or rangefinder to measure detection distances from transect centrelines to singles and cluster centres. When perpendicular distances could not be measured directly, we used sighting angles and radial distances (i.e. perpendicular distances = sine of sighting angles × radial distances). For individuals heard calling but not seen, we measured distances to nearest locations and used the midpoints of distance categories 0–10, 11–20, 21–30, 31–40, 41–50, 51-60 and 61-70 m. Moving individuals were not included in density estimates, unless we measured detection distances to initial locations.
$ \overline{s} $
to estimate density (Buckland et al. Reference Buckland, Anderson, Burnham, Laake, Borchers and Thomas2001). We defined a cluster as two or more individuals 10 m from each other, showing similar behaviour (e.g. ground foraging). We used a compass to measure sighting angles and a tape measure or rangefinder to measure detection distances from transect centrelines to singles and cluster centres. When perpendicular distances could not be measured directly, we used sighting angles and radial distances (i.e. perpendicular distances = sine of sighting angles × radial distances). For individuals heard calling but not seen, we measured distances to nearest locations and used the midpoints of distance categories 0–10, 11–20, 21–30, 31–40, 41–50, 51-60 and 61-70 m. Moving individuals were not included in density estimates, unless we measured detection distances to initial locations.
Survey effort L accounted for transect lengths (range 50-165 m) and the number of visits per transect each survey occasion (range 2-10). Because Bridled Quail-doves are year-round residents in the study area, detection probability has two components (i.e.
 $ {\hat{P}}_{da} $
=
$ {\hat{P}}_{da} $
=
 $ {\hat{P}}_d $
×
$ {\hat{P}}_d $
×
 $ {\hat{P}}_a $
; Buckland et al. Reference Buckland, Anderson, Burnham, Laake, Borchers and Thomas2001, Reference Buckland, Rexstad, Marques and Oedekoven2015, Nichols et al. Reference Nichols, Thomas, Conn, Thomson, Cooch and Conroy2009). Repeated visits to fixed transects per survey occasion allowed us to estimate both components of detection probability using distance sampling and N-mixture models (Royle Reference Royle2004, MacKenzie et al. Reference MacKenzie, Nichols, Royle, Pollock, Bailey and Hines2006, Burton and Rivera-Milán Reference Burton and Rivera-Milán2014). We included availability
$ {\hat{P}}_a $
; Buckland et al. Reference Buckland, Anderson, Burnham, Laake, Borchers and Thomas2001, Reference Buckland, Rexstad, Marques and Oedekoven2015, Nichols et al. Reference Nichols, Thomas, Conn, Thomson, Cooch and Conroy2009). Repeated visits to fixed transects per survey occasion allowed us to estimate both components of detection probability using distance sampling and N-mixture models (Royle Reference Royle2004, MacKenzie et al. Reference MacKenzie, Nichols, Royle, Pollock, Bailey and Hines2006, Burton and Rivera-Milán Reference Burton and Rivera-Milán2014). We included availability
 $ {\hat{P}}_a $
as a multiplier in the density estimator (Buckland et al. Reference Buckland, Anderson, Burnham, Laake, Borchers and Thomas2001, Thomas et al. Reference Thomas, Buckland, Rexstad, Laake, Strindberg, Hedley, Bishop, Marques and Burnham2010, Thomas and Marques Reference Thomas and Marques2012). We used nonparametric bootstrapping to estimate detection probability standard errors (Efron and Tibshirani Reference Efron and Tibshirani1993, Buckland et al. Reference Buckland, Anderson, Burnham, Laake, Borchers and Thomas2001, Reference Buckland, Rexstad, Marques and Oedekoven2015).
$ {\hat{P}}_a $
as a multiplier in the density estimator (Buckland et al. Reference Buckland, Anderson, Burnham, Laake, Borchers and Thomas2001, Thomas et al. Reference Thomas, Buckland, Rexstad, Laake, Strindberg, Hedley, Bishop, Marques and Burnham2010, Thomas and Marques Reference Thomas and Marques2012). We used nonparametric bootstrapping to estimate detection probability standard errors (Efron and Tibshirani Reference Efron and Tibshirani1993, Buckland et al. Reference Buckland, Anderson, Burnham, Laake, Borchers and Thomas2001, Reference Buckland, Rexstad, Marques and Oedekoven2015).
We evaluated the fit of uniform, half-normal, and hazard-rate detection models with goodness-of-fit tests (e.g. Kolmogorov-Smirnov test Dn, P < 0.05); and we used Akaike Information Criterion (AIC) for stepwise model selection (Buckland et al. Reference Buckland, Anderson, Burnham, Laake, Borchers and Thomas2001, Reference Buckland, Rexstad, Marques and Oedekoven2015, Marques et al. Reference Marques, Thomas, Fancy and Buckland2007). We used the half-normal and hazard-rate key functions without series expansions to model the effects of the following covariates: cluster size (continuous, ≥ 2 individuals), detection mode (categorical, 0 = audio, 1 = visual), detection angle (continuous, 0-359°), survey occasion (categorical, 0 = May 2016, 1 = May 2017, 2 = May 2018, 3 = May 2019), time of day (continuous, 07h07-15h05), transect survey time (continuous, end - start time), transect location (categorical, 0 = along, 1 = away trail), transect elevation (categorical, 0 = 100-200, 1 = 201-400, 2 = 401-600 m), horizontal and vertical vegetation cover (categorical, 0 = none-low, 1 = medium-high), and observer (categorical, 0 = HM alone, 1 = HM-FFRM, 2 = HM-KV, 3 = HM-OJ, 4 = HM-AP). We recorded elevation and cover at transect start, middle and end points; and we used the mean and mode for category definition. We modelled quadratic terms for time of day and mean elevation.
We stratified (e.g. 0 = inside, 1 = outside park) and post-stratified (e.g. 0 = May 2016 and 2017, 1 = May 2018 and 2019) the distance data to compare density estimates using the two-sample z test (Buckland et al. Reference Buckland, Anderson, Burnham, Laake, Borchers and Thomas2001, Reference Buckland, Rexstad, Marques and Oedekoven2015, Crawley Reference Crawley2007). We also used the two-sample z test to compare Guana Island density estimates (Boal Reference Boal2018) with our study area pre-hurricane density estimates. For density comparisons, we accepted statistical significance at P < 0.05. We present results as original means and bootstrapped standard errors for all parameter estimates, with 2.5% and 97.5% quantiles provided for population size estimates per survey occasion across the study area (i.e.
 $ \hat{N}=\hat{D}\times \mathrm{A} $
, where A = 440 ha). For data analysis, we used programs DISTANCE ver. 7.3 rel. 1 (Thomas et al. Reference Thomas, Buckland, Rexstad, Laake, Strindberg, Hedley, Bishop, Marques and Burnham2010) and R ver. 3.5.3 (R Development Core Team 2019) with package UNMARKED ver 0.13-2 (Fiske and Chandler Reference Fiske and Chandler2011).
$ \hat{N}=\hat{D}\times \mathrm{A} $
, where A = 440 ha). For data analysis, we used programs DISTANCE ver. 7.3 rel. 1 (Thomas et al. Reference Thomas, Buckland, Rexstad, Laake, Strindberg, Hedley, Bishop, Marques and Burnham2010) and R ver. 3.5.3 (R Development Core Team 2019) with package UNMARKED ver 0.13-2 (Fiske and Chandler Reference Fiske and Chandler2011).
Results
Overall, we made 141 audio and 105 visual detections on 255 transects in May 2016-2019 (Figure 5a,b). Cluster size  $ \overline{s} $ averaged 1.024 ± 0.011 and cluster detection was not size biased (Pearson’s r = -0.01, df = 244, P =0.43). Encounter rate n/L (i.e. 246/82 000) averaged 0.003 ± 0.0005. Based on goodness-of-fit tests and minimisation of AIC, the hazard-rate key function without series expansion provided the best fit to the distance data (e.g. Dn = 0.11, P = 0.50; Table 1, Figure 5a). Detection mode was the most important detection covariate, with others receiving no support from the distance data (Table 1, Figure 5b). For survey occasions combined, observer detectability
 $ {\hat{P}}_d $
averaged 0.957 ± 0.114 for audio detections and 0.434 ± 0.052 for visual detections (Figure 5b). For detection modes combined,
$ {\hat{P}}_d $
averaged 0.957 ± 0.114 for audio detections and 0.434 ± 0.052 for visual detections (Figure 5b). For detection modes combined,
 $ {\hat{P}}_d $
averaged 0.693 ± 0.064 (Figure 5a) and ranged from 0.692 ± 0.075 to 0.699 ± 0.086 (Table 2). Effective strip width
$ {\hat{P}}_d $
averaged 0.693 ± 0.064 (Figure 5a) and ranged from 0.692 ± 0.075 to 0.699 ± 0.086 (Table 2). Effective strip width
 $ E\hat{S}W $
(i.e.
$ E\hat{S}W $
(i.e.
 $ w\times {\hat{P}}_d $
) averaged 41.58 ± 3.84 and ranged from 41.52 ± 4.50 to 41.94 ± 5.16 m. For survey occasions and detection modes combined, Quail-dove availability
$ w\times {\hat{P}}_d $
) averaged 41.58 ± 3.84 and ranged from 41.52 ± 4.50 to 41.94 ± 5.16 m. For survey occasions and detection modes combined, Quail-dove availability
 $ {\hat{P}}_a $
averaged 0.475 ± 0.138 and ranged from 0.410 ± 0.125 to 0.585 ± 0.191 (Table 2). The product of detection components
$ {\hat{P}}_a $
averaged 0.475 ± 0.138 and ranged from 0.410 ± 0.125 to 0.585 ± 0.191 (Table 2). The product of detection components
 $ {\hat{P}}_{da} $
averaged 0.329 ± 0.098 and ranged from 0.284 ± 0.081 to 0.402 ± 0.103 (Table 2).
$ {\hat{P}}_{da} $
averaged 0.329 ± 0.098 and ranged from 0.284 ± 0.081 to 0.402 ± 0.103 (Table 2).

Figure 5. Detection probability g(x) based on the hazard-rate key function without series expansion for audio and visual detections combined (A) and separated (B) of Bridled-Quail doves at transects surveyed in the Quill study area each May in 2016-2019. Distance data right truncated at w = 60 m.
Table 1. Top five-ranked detection models using conventional (CDS) and multiple-covariate (MCDS) distance sampling for Bridled Quail-dove line transect surveys at the Quill study area each May in 2016-2019. Distance data right truncated at w = 60 m.

a HR = hazard-rate, HN = half-normal key function
b COS = cosine, SP = simple polynomial, HP = Hermite polynomial series expansion
c OB = observer, DM = detection mode, TL = transect location, ST = starting time, TE = transect elevation.
d Number of parameters
Table 2. Bridled Quail-dove estimates of detection probability at the Quill study area in May 2016-2019. Distance data right truncated at w = 60 m.

a Observer detectability
b Quail-dove availability
c Product of detection probability components
For survey occasions and detection modes combined, density (
 $ \hat{D} $
= individual ha-1) averaged 1.459 ± 0.277 and ranged from 0.540 ± 0.211 to 2.361 ± 0.307 (Table 3). That is, population size (
$ \hat{D} $
= individual ha-1) averaged 1.459 ± 0.277 and ranged from 0.540 ± 0.211 to 2.361 ± 0.307 (Table 3). That is, population size (
 $ \hat{N} $
= individuals in 440 ha) averaged 642 ± 122 (2.5% and 97.5% quantiles = 449, 913) and ranged from 238 ± 93 (118, 390) to 1039 ± 135 (806, 1339; Table 3). Density declined by 76% between May 2017 and 2018 (i.e. rate of change
$ \hat{N} $
= individuals in 440 ha) averaged 642 ± 122 (2.5% and 97.5% quantiles = 449, 913) and ranged from 238 ± 93 (118, 390) to 1039 ± 135 (806, 1339; Table 3). Density declined by 76% between May 2017 and 2018 (i.e. rate of change
 $ \hat{R}={\hat{D}}_{2018}/{\hat{D}}_{2017} $
- 1 = -0.757 ± 0.329; z = 2.67, p = 0.008; Table 3). Density remained low in May 2019 (Table 3).
$ \hat{R}={\hat{D}}_{2018}/{\hat{D}}_{2017} $
- 1 = -0.757 ± 0.329; z = 2.67, p = 0.008; Table 3). Density remained low in May 2019 (Table 3).
Table 3. Bridled Quail-dove estimates of density and population size at the Quill study area in May 2016-2019. Distance data right truncated at w = 60 m.

a Individuals hal
b Individuals in 440 ha
Density did not differ along (0.683 ± 0.204, n = 47) and away (0.776 ± 0.158, n = 199) from forest trails (z = -0.36, p = 0.72). However, density was higher inside (1.216 ± 0.205, n = 217) than outside the park (0.244 ± 0.184, n = 29; z = 3.53, P = 0.004). Density also was higher at elevations within 201-400 (1.016 ± 0.181, n = 197) than 100-200 (0.120 ± 0.088, n = 32) and 401-600 m (0.324 ± 0.127, n = 17; all z scores > 3.13, P values < 0.002); but density did not differ between 401-600 and 100-200 m (z = 1.32, P = 0.19). Lastly, Boal’s Guana Island densities for two survey periods combined (reported as 1.48 ± 0.20) did not differ from our study area pre-hurricane densities combined (2.360 ± 0.468; z = 1.73, P = 0.08; Table 3).
Discussion
Application of line-transect distance sampling depended on the following basic assumptions: (1) single individuals and clusters of individuals were distributed independently of transects; (2) singles and clusters at transect centrelines were not missed (i.e. g[0] = 1); (3) perpendicular distances and/or distance categories were correct; (4) singles and clusters were detected at initial locations; and (5) cluster size estimation was unbiased. Detection probability and abundance estimation were not influenced by transects along and away from forest trails. Transects provided adequate coverage of foraging habitats inside and outside the park and three elevation categories across the study area. We often detected Bridled Quail-doves calling from low branches or while walking slowly ground foraging; and their initial locations were easily spotted before any responsive movement, which was characterised by distinguishable wing beats and/or rustle of leaf litter. Detection mode was the most important covariate, but audio and visual detections did not show extreme heterogeneity in the detection function (e.g. compare our Figure 5b with Figure 3 in Marques et al. Reference Marques, Thomas, Fancy and Buckland2007). The hazard-rate key function without series expansion adequately described audio and visual detections, with nearly a complete count or census (i.e. mean
 $ {\hat{P}}_d $
= 0.957) for calling individuals and sufficiently high detectability (i.e. mean
$ {\hat{P}}_d $
= 0.957) for calling individuals and sufficiently high detectability (i.e. mean
 $ {\hat{P}}_d $
= 0.434) for non-calling individuals available within 60 m of transect centrelines. In addition, availability remained sufficiently high during survey occasions (i.e. mean
$ {\hat{P}}_d $
= 0.434) for non-calling individuals available within 60 m of transect centrelines. In addition, availability remained sufficiently high during survey occasions (i.e. mean
 $ {\hat{P}}_a $
= 0.475), clusters tended to be small (usually ≤ 3 individuals ground foraging), and cluster detection was not size biased. Therefore, we likely met the above-mentioned basic assumptions and estimated abundance unbiasedly.
$ {\hat{P}}_a $
= 0.475), clusters tended to be small (usually ≤ 3 individuals ground foraging), and cluster detection was not size biased. Therefore, we likely met the above-mentioned basic assumptions and estimated abundance unbiasedly.
Contrary to what we hypothesized, density did not differ along and away from forest trails. However, as we hypothesized, density was higher inside than outside the park and at elevations within 201-400 m than 100-200 m and 401-600 m. We suggest that density did not differ along and away from forest trails (usually < 5 m wide), because foraging habitats within 60 m of transect centrelines were similar to forest interior areas, and because trails were narrow and there was little disturbance from park visitors during the surveys (see Figure 3). However, the degradation of foraging habitats by free-ranging livestock (mainly goats) can explain density differences inside and outside the park and three elevation categories. For example, Madden (Reference Madden2020) estimated densities between 3.29 ± 0.82 and 2.84 ± 0.93 goats ha−1 at low and high elevations in the study area; and during our surveys, Bridled Quail-doves were not detected in overgrazed areas below 200 m. In addition, we suggest that density was higher within 201-400 than 100-200 and 401-600 m because fruit/seed production and abundance were higher in middle elevation semi-evergreen and evergreen forests than in lower and upper elevation semi-deciduous and deciduous-mixed forests. However, although these are plausible explanations, we did not measure fruit/seed production and abundance, and we agree with Boal (Reference Boal2011, Reference Boal2018) that research is needed on the diet and foraging habitat preferences of the Bridled Quail-dove, as well as on the effects of free-ranging livestock overgrazing.
The Bridled Quail-dove population declined significantly between May 2017 and 2018 and remained low between May 2018 and 2019. Hurricanes Irma and Maria caused severe structural vegetation damage and high tree mortality (Eppinga and Pucko Reference Eppinga and Pucko2018). Therefore, we suggest that major hurricanes together with free-ranging livestock overgrazing degraded foraging habitats and limited food supply, which, in turn, lowered reproduction and/or survival rates, and caused a population bottleneck in the absence of immigration from nearby islands (Rivera-Milán and Schaffner Reference Rivera-Milán and Schaffner2002, Beissinger et al. Reference Beissinger, Wunderle, Meyers, Sæther and Engen2008). In addition, nest predators (mainly black rats Rattus rattus) were abundant in the study area (Madden et al. Reference Madden, Van Andel, Miller, Stech, Verdel and Eggermont2019). Under these circumstances, and considering the life history characteristics of Columbidae (e.g. low survival and high reproductive rates), we recommend control management (e.g. permanent fences and sustained removal) within the park to improve foraging habitats and promote population recovery through successful reproduction (Rivera-Milán Reference Rivera-Milán1996, Rivera-Milán et al. Reference Rivera-Milán, Ruiz, Cruz and Sustache2003, Debrot et al. Reference Debrot, Hazenbosch, Piontek, Kraft, van Belle and Strijkstra2015, Madden et al. Reference Madden, Van Andel, Miller, Stech, Verdel and Eggermont2019, Madden Reference Madden2020).
Boal’s (Reference Boal2018) and our methodologies were similar and can be implemented across the distribution range of the Bridled Quail-dove to assess population status and trends, and monitor population responses to control management actions. However, surveys should be conducted during the peak of calling activity in April-June to maximise Bridled Quail-dove availability and observer detectability (Rivera-Milán et al. Reference Rivera-Milán, Collazo, Stahala, Moore, Davis, Herring, Steinkamp, Pagliaro, Thompson and Bracey2005, Reference Rivera-Milán, Bertuol, Simal and Rusk2015, Reference Rivera-Milán, Boomer and Martínez2016, Reference Rivera-Milán, Simal, Bertuol and Boomer2018). Lastly, with the exception of some possible strongholds, such as Guadeloupe’s Important Bird Area GP002 (Levesque and Mathurin Reference Levesque, Mathurin, Wege and Anadon-Irizarry2008; www.ebird.org/home), we agree with Boal (Reference Boal2011, Reference Boal2018) and other researchers that Bridled Quail-dove populations probably were declining on most islands before the 2017 hurricanes and that population status warrants revision (BirdLife International 2016).
Acknowledgements
St. Eustatius National Parks Foundation granted access to the Quill National Park and the Caribbean Netherlands Science Institute provided logistical support. The United States Fish and Wildlife Service and BirdsCaribbean funded traveling expenses in 2017. O. Jones and A. Pierre assisted with surveys in 2018 and 2019. C. W. Boal reviewed the manuscript before submission. The findings and conclusions are those of the authors and do not necessarily represent the views, determinations, or policies of our respective organizations. The use of trade, firm, or product names does not imply endorsement by the organizations involved in this study.


