

Introduction
Clark and Wells' (Reference Clark, Wells, Heimberg, Liebowitz, Hope and Schneier1995) cognitive model of social anxiety (CWM) has become a point of reference for understanding the maintenance of Social Anxiety Disorder (SAD) and for the development of effective treatment (e.g. Clark et al., Reference Clark, Ehlers, McManus, Hackmann, Fennell and Campbell2003, Reference Clark, Ehlers, Hackmann, McManus, Fennell and Grey2006). Figure 1 illustrates five main components of CWM. Broadly, individuals with SAD have pre-existing negative self-evaluative beliefs. Due to these beliefs, two interpretation biases occur: a cost-evaluation bias (i.e. a tendency to make catastrophic interpretations of social events; e.g. “If I make a mistake they will reject me”); and a likelihood evaluation bias (i.e. a tendency to think that a catastrophe is likely to occur, e.g. “I will probably make a mistake”). The cost-likelihood evaluation bias is a tendency to rate ambiguous social events as being very likely to result in a very negative outcome (Foa, Franklin, Perry and Herbert, Reference Foa, Franklin, Perry and Herbert1996; Hofmann, Reference Hofmann2004; McManus, Clark and Hackmann, Reference McManus, Clark and Hackmann2000; Smits, Rosenfield, McDonald and Telch, Reference Smits, Rosenfield, McDonald and Telch2006). The cost-likelihood evaluation bias shifts the individual's attention towards negative self-imagery and anxiety symptoms (Clark and Wells, Reference Clark, Wells, Heimberg, Liebowitz, Hope and Schneier1995). By focusing on anxiety symptoms, negative cognitions and perception of danger are reinforced. For example, blushing is interpreted as more noticeable and thus more likely to be judged negatively. Safety behaviours (e.g. minimizing eye contact) or avoidance behaviour are then engaged to minimize the interaction with the social danger thus reinforcing negative beliefs and preventing the individual from experiencing an opportunity to modify distorted thinking. Safety behaviours may have inadvertent consequences of affronting others (e.g. avoiding eye contact may be perceived as unfriendly), or exacerbating symptoms (e.g. gripping a glass too tightly to prevent shaking may produce more shaking).
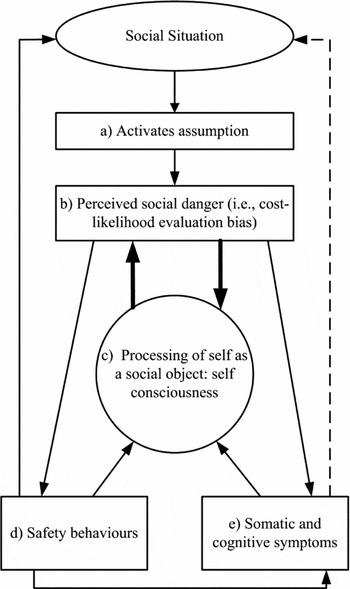
Figure 1. Clark and Wells (Reference Clark, Wells, Heimberg, Liebowitz, Hope and Schneier1995) Cognitive Model of Social Anxiety
Numerous studies have provided support for the inclusion of the selected variables in CWM (e.g. Morgan and Raffle, Reference Morgan and Raffle1999; Smits et al., Reference Smits, Rosenfield, McDonald and Telch2006; Wells et al., Reference Wells, Clark, Salkovskis, Ludgate, Hackmann and Gelder1995), but only one study has tested the variables together. Hodson, McManus, Clark and Doll (Reference Hodson, McManus, Clark and Doll2008) conducted a cross-sectional investigation into the applicability of CWM to young people (aged between 11 and 14; N = 171). Participants were secondary school students, divided into three groups: high levels of social anxiety (n = 47), moderate levels of social anxiety (n = 76) and low levels of social anxiety (n = 48), according to their self-reported social anxiety. In a comparison of groups across measures, individuals in the high social anxiety group scored significantly higher than both the moderate and low social anxiety groups on measures of negative social cognitions (F (2, 168) = 33.23, p < .001), self-focused attention (F (2, 168) = 10.69, p < .01) and safety behaviours (F (2, 168) = 12.19, p < .001). These initial results indicated that several CWM variables are more likely to occur in socially anxious samples than non-socially anxious samples. A comparison of the R 2 values for depression and social anxiety revealed a significant difference (F = 45.23, p < .001) indicating that the variables were more predictive of social anxiety than depression.
Unfortunately, cost-likelihood evaluation bias was not examined in Hodson et al.'s (Reference Hodson, McManus, Clark and Doll2008) study but is a key component of CWM and has been consistently demonstrated to be more likely to occur in socially anxious individuals than in other anxiety disorders and the general community (Stopa and Clark, Reference Stopa and Clark2000). Moreover, given that all the participants in Hodson et al.'s study were from a non-clinical sample of children, there is little information on how adults who vary in levels of social anxiety (e.g. clinical and non-clinical samples of adults) would compare. A comparison of clinical and non-clinical samples with varying levels of social anxiety would provide some important information regarding differences between clinical and non-clinical groups and address concerns relating to generalizability. Student samples have been used in studies examining aspects of CWM including self-report measures of negative evaluative cognitions (e.g. Wong and Moulds, Reference Wong and Moulds2009) and self-focus (e.g. Mellings and Alden, Reference Mellings and Alden2000), experimental tasks measuring degrees of post-event processing (Field, Psychol and Morgan, Reference Field, Psychol and Morgan2004) and attention bias (e.g. Mansell, Clark, Ehlers and Chen, Reference Mansell, Clark, Ehlers and Chen1999). As several studies have tended to use student samples and generalize findings to clinical populations, examining the differences between clinical and student samples with similar levels of social anxiety would provide important information in relation to how generalizable these findings are to clinical populations.
The present study
The present study compared three groups: a clinical sample of individuals diagnosed with SAD (ClinS), a highly socially anxious student sample (HSA), and a sample of students with low levels of social anxiety (LSA) on variables in CWM. Given that depression and social anxiety are highly correlated (Lampe et al., Reference Lampe, Slade, Issakidis and Andrews2003), depression was also included as a covariate. Controlling for depression assists researchers in being more confidently able to identify unique relationships between social anxiety and CWM variables. Specifically, the following hypotheses were tested.
-
• The ClinS group will score significantly higher on all five variables of CWM compared to both HSA and LSA groups.
-
• The HSA group will score significantly higher on all five variables of CWM compared with the LSA group.
-
• These relationships will remain after controlling for depression.
Method
Participants and procedure
Student sample
Participants included students from The University of Melbourne (N = 348, mean age = 19.80 years, SD = 4.13) who volunteered to participate in a larger study (Skocic, Reference Skocic2013). The means and standard deviations for the entire student sample on the Social Interaction Anxiety Scale (SIAS; Mattick and Clarke, Reference Mattick and Clarke1998; M = 25.15, SD = 11.11) and the Social Phobia Scale (SPS; Mattick and Clarke, Reference Mattick and Clarke1998; M = 19.03, SD = 12.52) were below the cut-off indicative of the presence of SAD (i.e. scores above 34 in the SIAS indicates the presence of a specific form of SAD, and scores above 43 indicate the presence of generalized SAD; Mattick and Clarke, Reference Mattick and Clarke1998).
An even split was used to form two groups from a student sample (N = 348) on the basis of the highest (11.4%, n = 40) and lowest (11.4%, n = 40) scores from the social anxiety composite scores (which were calculated from the SPS and SIAS). For the highly socially anxious group (HSA), mean scores for the SPS and SIAS were M = 41.13 and M = 47.53, respectively. The majority of the HSA sample were Australian (52%, n = 21) and female (77%, n = 31). Other participants in the HSA sample were from a range of cultural backgrounds (Indonesia n = 4; China n = 3; Hong Kong n = 3; Singapore n = 2; Malaysia n = 2; Vietnam n = 1; Poland n = 1; Macedonia n = 1; Brunei n = 1; United Kingdom n = 1). Students with low scores on the SPS/SIAS composite were selected for the non-anxious group (LSA). For the non-anxious group, mean scores for the SPS and SIAS were M = 3.68 and M=10.63, respectively. The majority of the LSA sample were Australian (52%, n = 21) and female (63%, n = 25). Other participants in the LSA sample were from a range of cultural backgrounds (China n = 3; Yugoslavia n = 2; Korea n = 2; Vietnam n = 2; Indonesia n = 2; Turkey n = 1; Lebanon n = 1; Malaysia n = 1; Afghanistan n = 1; Denmark n = 1; Sweden n = 1; Singapore n = 1; Taiwan n = 1).
Clinical sample
Individuals diagnosed with SAD (n = 40, mean age = 34.4 years) who were either seeking treatment or were currently in treatment for SAD at a specialist clinic in Melbourne (Reconnexion) also agreed to participate in the study. The clinical participants were able to take part in the study but prior to engaging in group treatment that was based on CWM. All ClinS participants met full criteria for SAD at the time of testing. Moreover, the primary diagnosis (APA, 2000, DSM-IV-TR) was defined as the primary source of current functional impairment. The majority of this clinical sample (ClinS) was female (55%, n = 22) and Australian (73%, n = 29).Other participants in the ClinS sample were from a range of cultural backgrounds (United Kingdom n = 3; Italy n = 2; Vietnam n = 1; Thailand n = 1; Macedonia n = 1; Malta n = 1; France n = 1; Philippines n = 1).
In order to qualify for the study, all participants met the inclusion criteria of being over 18 years of age. Participants were excluded from the study if they had a disability or deficit (e.g. visual impairment) that would obstruct their accurate reporting on self-report measures or if they were experiencing psychotic symptoms or had any evidence of cognitive disorder at the time of interview. The clinical sample was not screened for other comorbid disorders.
The study was approved by The University of Melbourne Human Research Ethics Committee (HREC, ID No. 1034452). All the measures were written into INQUISIT 1.32 online survey software program (Draine, Reference Draine2001) and accessed by participants on computers. For the ClinS only, confirmation of the diagnosis of SAD was through individual interview (ADIS). ADIS was completed at the time of the self-report questionnaires. The mean scores for SPS and SIAS for this sample were M = 34.93 and M = 47.68, respectively.
Measures
Demographic questionnaire
Participants were asked to answer demographic questions related to age and gender.
Self-report measures of the components of CWM
The Social Phobia Scale (SPS; Mattick and Clarke, Reference Mattick and Clarke1998) is a 20-item scale that assesses fears of being scrutinized by others during routine activities. Items are rated on a 5-point Likert scale where 0 = not at all characteristic or true of me, and 4 = extremely true or characteristic of me. The SPS has been found to have good convergent validity with the Social Interaction Anxiety Scale (r = .73), strong internal consistency (a = .89) and test-retest reliability (a = .93; Mattick and Clarke, Reference Mattick and Clarke1998). In the current research, internal consistency was found to be acceptable (Guttman's lambda = 0.92).
The Social Interaction Anxiety Scale (SIAS; Mattick and Clarke, Reference Mattick and Clarke1998) is a 20-item scale that assesses cognitive, emotional and behavioural reactions in more general social interactions. Items are rated on a 5-point Likert scale where 0 = not at all characteristic or true of me, and 4 = extremely true or characteristic of me. The SIAS has good convergent validity with the SPS (r = .73) and the Social Anxiety and Anxiety Inventory (r = .85; Peters, Reference Peters2000), and test-retest reliability (r = .92; Mattick and Clarke, Reference Mattick and Clarke1998). In the current research, internal consistency was found to be acceptable (Guttman's lambda = 0.93).
Together, the SIAS and SPS measure the central fears of SAD including anxiety related to social interaction and fear of social performance situations. Similar to methods used in previous studies (e.g. Clark et al., Reference Clark, Salkovskis, Hackmann, Middleton, Anastasiades and Gelder1994; Rapee, Abbott, Baillie and Gaston, Reference Rapee, Abbott, Baillie and Gaston2007), the scores on separate scales (in this study SPS/SIAS) were combined to produce a composite score of social anxiety. This method of data analysis kept the number of statistical analyses to a minimum and reduced the Type 1 error rate (Rapee et al., Reference Rapee, Abbott, Baillie and Gaston2007). Moreover, the use of the composite score allowed for an examination of the similarities and differences between three groups according to a range of social anxiety-related behaviours and experiences, not just fear of negative evaluation.
The Social Attitudes Questionnaire-Revised (SAQ-R; Clark, Reference Clark, Crozier and Alden2001) is a 50-item self-report inventory, measured on a 7-point scale (1 = totally agree, to 7 = totally disagree) that assessed negative self-evaluative beliefs. In the current research, internal consistency was acceptable (Guttman's lambda = .97).
The Subtle Avoidance Frequency Examination (SAFE; Cuming et al., Reference Cuming, Rapee, Kemp, Abbott, Peters and Gaston2009) is a 32-item self-report inventory, measured on a 5-point scale that assesses safety behaviours. Higher scores indicate greater frequency and range of safety behaviours (Cuming et al., Reference Cuming, Rapee, Kemp, Abbott, Peters and Gaston2009). Convergent and divergent validity has been reported as acceptable (see Cuming et al., Reference Cuming, Rapee, Kemp, Abbott, Peters and Gaston2009). In the current research, internal consistency was found to be acceptable (Guttman's lambda = 0.94).
The Self-Consciousness Scale-Revised (SCS-R; Scheier and Carver, Reference Scheier and Carver1985) was used to assess self-focus. Whilst no items from the SCS-R specifically assess the direction of attention, public self-consciousness is arguably very similar to Clark and Wells' (Reference Clark, Wells, Heimberg, Liebowitz, Hope and Schneier1995) description of the self as a social object (Fenigstein, Scheier and Buss, Reference Fenigstein, Scheier and Buss1975; Spurr, and Stopa, Reference Spurr and Stopa2002). The 7-item “public self-consciousness” subscale was utilized in the present study (Cronbach's alpha = 0.84; Scheier and Carver, Reference Scheier and Carver1985). Responses were on a 5-point scale (0 = Extremely uncharacteristic, to 4 = Extremely characteristic). In the current research, internal consistency was acceptable (Guttman's lambda = 0.84).
The Outcome Probability Questionnaire (OPQ) and Outcome Cost Questionnaire (OCQ) were reconfigured by Uren, Szabo, and Lovibond (Reference Uren, Szabo and Lovibond2004) from items previously developed (i.e. Butler and Mathews, Reference Butler and Mathews1983; Foa et al., Reference Foa, Franklin, Perry and Herbert1996). The 12-item subscale assessing social-related items was used in the present study in order to assess the presence and severity of a cost-likelihood evaluation bias in participants. Responses were made on a 5-point scale (0 = Undesirable, to 4 = The worst sort of thing that could happen). Mean scores for cost evaluation bias and likelihood evaluation bias were calculated separately for 12 social items each. In the current research, internal consistency was acceptable for both OPQ (Guttman's lambda = 0.91) and OCQ (Guttman's lambda = 0.87).
Measure of depression
The Center for Epidemiologic Studies Depression Scale (CESD; Radloff, Reference Radloff1977) is a 20-item scale that measures the frequency of depressive symptoms experienced during the past week. Items are rated on a 4-point Likert scale where 0 = rarely and 3 = most of all of the time. Studies examining convergent validity have found strong correlations between the CESD and Hamilton rating scale of depression (r = .50 - .80; Eaton, Smith, Ybarra, Muntaner and Tien, Reference Eaton, Smith, Ybarra, Muntaner and Tien2004). Strong internal consistency (a = .84 - 90) and test-retest reliability (r = .51 to .67) from 2–8 weeks has been displayed (Eaton et al., Reference Eaton, Smith, Ybarra, Muntaner and Tien2004). In the current research, internal consistency was acceptable (Guttman's lambda = 0.91).
Diagnosis of Social Anxiety Disorder
Anxiety Disorders Interview Schedule (ADIS; Di Nardo and Barlow, Reference Di Nardo and Barlow1988). The ADIS is a structured interview used to determine the presence of anxiety disorders including Social Anxiety Disorder (according to the DSM-IV criteria). The ADIS section for SAD was used to confirm the reliability of an accurate diagnosis of SAD for ClinS only. SS and CF administered the ADIS. Reliability ratings have been reported to be within a range of (r = .80-.86) for clinical severity, situational avoidance and situational fear (Brown, Di Nardo, Lehman and Campbell, Reference Brown, Di Nardo, Lehman and Campbell2001).
Results
Data were analysed using PASW statistics 17.0 (SPSS Inc., Chicago, IL). Statistical significance was accepted at the 5% level (p < .05). To maximize the potential to meet the assumption of homogeneity of variance, equal cell sizes were obtained by an even split of the entire student sample (N = 348) into HSA and LSA groups on the basis of the highest (11.4%, n = 40) and lowest (11.4%, n = 40) scores from the social anxiety composite scores (which are made of SPS and SIAS). Only data from these two student samples and the clinical sample were used for the analysis. According to Cohen (Reference Cohen1992), with power at .80, significance at .05, then an n of 21 per group is required to detect a large effect size between pairs of the three groups.
Table 1 presents the means and standard deviations for the social anxiety measures SIAS/SPS by group. As can be seen in Table 1, both ClinS and HSA groups scored above the clinical cut-off for social anxiety disorder on the SIAS. The majority of the participants in the ClinS sample scored above the clinical cut-off for generalized-SAD (n = 31; 77.5%), the rest of the sample scored above the clinical cut-off for specific-SAD (n = 9; 22.5%). In the HSA sample, the majority scored above the clinical cut-off for generalized-SAD (n = 28; 70%) and the rest of the sample (n = 12; 30%) scored above the clinical cut-off for specific-SAD.
Table 1. Means and standard deviations for social anxiety measures SIAS/SPS by group

A MANOVA was conducted prior to the MANCOVA to determine whether differences existed between the groups on the dependent variables prior to controlling for covariates of interest. Preliminary assumption checking revealed that data were normally distributed, as assessed by Shapiro-Wilk's test (p < .05). Whilst homogeneity of variance-covariance matrices, assessed by Box's M, was significant, given that the three groups were of equal sample size the analysis commenced regardless. However, given the significant Box's M result, Pillai's trace was used, as it is more robust.
A significant multivariate effect was found between groups (Pillai's Trace (F(12,224) = 38.01, p < .001; Wilk's λ = .108; partial η2 = 0.67), indicating an overall difference between the groups on a combination of dependent variables. Results of the MANOVA appear in Table 2. As can be seen in Table 2, univariate results for this relationship demonstrated significant effects for all five CWM variables. No significant effect was found for gender. The relative importance of the effect was measured using Partial eta-squared (Partial η2) also found in Table 2. These data indicated that scores on safety behaviours accounted for 64% of the group difference plus associated error variance.
Table 2. Multivariate analysis of variance

***p < .001, ** = p < .01, * = p < .05
ClinS (M = 34.4 years) were significantly older than both LSA (20.6 years) and HSA (19.47 years) (F (2,117) = 70.29, p < .001; post hoc, p < .001), but HSA and LSA did not differ (p = .702). LSA scored significantly lower on CESD (7.22) than HSA (27.32) and ClinS (25.25) (F (2,117) = 57.45, p < .001); post hoc, p < .001), but HSA and ClinS did not differ (p = .574). As a result of these significant differences, both age and depression scores were entered as covariates into a MANCOVA. Results of the MANCOVA appear in Table 3: p values for multivariate tests (i.e. Pillai's Trace) indicated significant effects of independent variables on all dependent variables considered as a group after controlling for age and depression.
Table 3. Multivariate analysis of covariance

***p < .001, ** = p < .01, * = p < .05
The groups did not differ significantly on likelihood evaluation bias. The relative importance of the effect was measured using Partial eta-squared (Partial η2), also reported in Table 3. These data indicated that scores on safety behaviours accounted for 47% of the group difference plus associated error variance.
Descriptive statistics and planned comparisons presented in Table 4 show that hypotheses were only partially supported. Evaluation of the descriptive statistics indicated that prior to controlling for covariates, mean scores for likelihood evaluation bias were statistically significantly different between ClinS and HSA (p < .05), ClinS and LSA (p < .001) and HSA and LSA (p < .001). Further significant differences were found with cost evaluation bias between ClinS and LSA, LSA and HSA (ps < .001), but not between ClinS and HSA (p = 0.30). Significant differences were also found for scores on: negative self-evaluative cognitions between ClinS and HSA (p < .05), ClinS and LSA (p < .001) and HSA and LSA (p < .001); self focus between ClinS and LSA (p < .001) and HSA and LSA (p < .001) but not between ClinS and HSA (p = 0.142); and safety behaviours between ClinS and HSA (p < .001), ClinS and LSA (p < .01) and, HSA and LSA (p < .001).
Table 4. CWM variables in individuals with clinical, high and low levels of social anxiety

Note: Means are raw unadjusted scores
As can be seen in Table 4, after controlling for covariates age and depression, the mean scores for likelihood evaluation bias were statistically significantly different between HSA and LSA (p < .05) and HSA had similar levels of likelihood evaluation bias when compared with ClinS. The mean scores on cost evaluation bias were significantly different between ClinS and LSA, LSA and HSA (ps < .001), but not between ClinS and HSA (p = 0.31). The mean scores on negative self-evaluative cognitions were significantly different between ClinS and HSA (p < .05), ClinS and LSA (p < .001) and HSA and LSA (p < .001). Mean scores for self-focus were significantly different between ClinS and LSA (p < .05) and HSA and LSA (p < .01), but not between ClinS and HSA (p = 0.617). The mean scores for safety behaviours were significantly different between ClinS and HSA (p < .001) and HSA and LSA (p < .001), but not between LSA and ClinS (p = .853).
Discussion
The results from the present study indicated that the CWM variables investigated are specifically related to social anxiety and are able to distinguish between those with high and low levels of social anxiety. The results also provide support for the assertion that these variables are uniquely related to social anxiety over and above variance due to depressive symptoms and suggest that whilst there might be some minor differences in information processing and behaviour between clinically diagnosed adults and highly socially anxious students, the use of highly socially anxious student samples would likely generate findings that are generalizable to clinical populations. The results from the comparison of ClinS and the student groups indicated that both ClinS and HSA scored significantly higher than LSA on all CWM variables except safety behaviours. The results are largely consistent with literature asserting the considerable contribution of CWM to understanding the maintenance of social anxiety (Clark and Wells, Reference Clark, Wells, Heimberg, Liebowitz, Hope and Schneier1995; Morgan and Raffle, Reference Morgan and Raffle1999; Smits et al., Reference Smits, Rosenfield, McDonald and Telch2006; Wells et al., Reference Wells, Clark, Salkovskis, Ludgate, Hackmann and Gelder1995) and research into the specific relationship these variables have to social anxiety over depression (Hodson et al., Reference Hodson, McManus, Clark and Doll2008).
Given that the SPS/SIAS scores were similar between HSA and ClinS it was not surprising that variables known to maintain social anxiety would be equally high in similarly anxious samples. This was the case with three of the CWM variables measured. ClinS and HSA scored higher on scales than LSA on self-focus, cost- and likelihood-evaluation bias. As these variables were able to significantly distinguish between LSA and both highly anxious groups they remain important information-processing variables for social anxiety.
Interestingly, ClinS scored higher than HSA and LSA on negative self-evaluative cognitions; this result remained after controlling for covariates. As ClinS and HSA groups scored similarly on SPS/SIAS scales, it seems unlikely that the progression of social anxiety to clinical levels may be associated with the presence of negative self-evaluative cognitions. Alternatively, it may be that high levels of these negative beliefs lead individuals to seek treatment. But this is speculative as it is unclear what percentage of the HSA sample may have been treatment seeking. Broadly, this result suggests that negative self-evaluative cognitions are present in clinical samples, but not necessarily in samples of highly socially anxious individuals who are not treatment seeking.
Unexpectedly, HSA reported significantly more safety behaviours than both LSA and ClinS both before and after controlling for covariates. It is possible that as the SAFE questionnaire does not include items pertaining to certain types of safety behaviours (e.g. putting on a front), it may be that other forms of safety behaviours are dominant in clinical samples. An alternate explanation is that as the SAFE measures both frequency of safety behaviours and range of safety behaviours the higher scores may be more indicative of a broader range of safety behaviours in the HSA sample, rather than a greater frequency or intensity of safety behaviours.
The results of the present study add to the existing literature in the following ways. First, these data indicate that four of the five CWM variables are able to reliably distinguish between highly socially anxious adults and adults who have low levels of social anxiety. The results provide support for the importance of CWM variables as maintaining factors of high levels of social anxiety. Second, the study was able to demonstrate that many of the components of CWM are reflective of high levels of social anxiety regardless of whether the sample is a treatment seeking clinical sample or a highly socially anxious student sample. The findings have implications for research as they indicate that using highly socially anxious student samples for research is likely to produce results that are generalizable to SAD. Third, by incorporating the analysis of cost-likelihood evaluation bias, this study was able to examine a key element of CWM in detail. This particular variable was not previously investigated in Hodson et al.'s study, so this is the first study to report cost-likelihood evaluation bias alongside other CWM variables.
Limitations
Some limitations of the present study should be noted. The HSA and LSA participants were not administered the ADIS, nor were they asked whether they were seeking treatment for social anxiety at the time. Another limitation relates to the cross-sectional nature of the study that meant the trajectory of anxiety symptoms in relation to information-processing variables was not addressed. Future researchers may also be interested in gathering information about the changes experienced in information-processing and behaviour across time.
Distinct similarities between HSA and ClinS may be reflective of variables that maintain social anxiety in clinical and non-clinical groups. The differences between these two highly socially anxious samples may indicate variables that motivate an individual to seek treatment. Future researchers may give consideration to this when designing comparison studies and thereby be able to examine whether maintaining factors of social anxiety (seen in CWM) are able to predict treatment-seeking behaviour.
Acknowledgements
Conflict of interest: The authors have no conflicts of interest with respect to this publication.


Comments
No Comments have been published for this article.