

Introduction
Much research has suggested that anxiety is best understood by conceptually and empirically distinguishing its trait and state facets (e.g. Endler and Kocovski, Reference Endler and Kocovski2001; Kocovski, Endler, Cox, and Swinson, Reference Kocovski, Endler, Cox and Swinson2004; Rapee and Medro, Reference Rapee and Medro1994; Reiss, Reference Reiss1997; Spielberger, Reference Spielberger, Tuma and Maser1985a, b). Spielberger (e.g. Spielberger and Sydeman, Reference Spielberger, Sydeman and Maruish1994) defines state anxiety as a transient response to stress that consists of subjective feelings of tension, apprehension, nervousness, worry, and arousal of the autonomic nervous system. Trait anxiety, on the other hand, is conceptualized as a stable tendency to perceive threat and become state anxious. Spielberger's model of state and trait anxiety is embodied in the State-Trait Anxiety Inventory (STAI: Spielberger, Reference Spielberger1983), with the trait scale of the STAI requiring respondents to indicate how frequently they generally experience various anxiety symptoms, and the state scale requiring them to report how much they are experiencing various anxiety symptoms at the moment of completing the questionnaire.
A separate body of research has suggested that anxiety may comprise distinct symptom dimensions and that their inclusion in the assessment of anxiety is important (e.g. Clark and Watson, Reference Clark and Watson1991; Himadi, Boice, and Barlow, Reference Himadi, Boice and Barlow1985; Koksal and Power, Reference Koksal and Power1990; Koksal, Power and Sharp, Reference Koksal, Power and Sharp1991). Much attention has been focused upon the distinction between cognitive and somatic dimensions of anxiety. The somatic dimension includes self-reported symptoms such as hyperventilation, sweating, trembling, and palpitations. Symptoms of muscle tension and stiffness also fall on this dimension. In contrast, the cognitive dimension reflects symptoms that are associated more directly with thought processes, including worry, intrusive thoughts, and lack of concentration. This distinction has been regarded as an important one by researchers working to determine the experiential components of anxiety (e.g. Endler and Kockovski, Reference Endler and Kocovski2001; Koksal and Power, Reference Koksal and Power1990; Schwartz, Davidson and Guleman, Reference Schwartz, Davidson and Guleman1978). For example, two individuals with the same global anxiety score may display quite different profiles of cognitive and somatic anxiety symptoms, which could have implications for their subjective experiences of anxiety, and for their responses to therapeutic interventions (Koksal et al., Reference Koksal, Power and Sharp1991; Scholing and Emmelkamp, Reference Scholing and Emmelkamp1992).
There has, however, been a common tendency to neglect consideration of the state-trait distinction when endeavoring to differentiate cognitive and somatic dimensions of anxiety (Endler, Cox, Parker and Bagby, Reference Endler, Cox, Parker and Bagby1992: Endler and Kockovski, Reference Endler and Kocovski2001). Recognition of the state-trait distinction is important, however, if the researcher's goal involves predicting how an individual will react under stress (which requires assessment of trait anxiety), or measuring the actual emotional response to stress (which requires assessment of state anxiety). While several self-report instruments have been developed to measure cognitive and somatic facets of anxiety, none have been designed to distinguish these dimensions within both state and trait anxiety. For example, The Cognitive Somatic Anxiety Questionnaire (CSAQ), developed by Schwartz et al. (Reference Schwartz, Davidson and Guleman1978), contains one cognitive and one somatic scale, each of which assesses the degree to which an individual tends to experience cognitive or somatic symptoms when anxious. This scale does not fit well with the conceptions of either state or trait anxiety as defined by Spielberger (Reference Spielberger1985a, Reference Spielberger, Sydeman and Maruish1985b). Another questionnaire that contains cognitive and somatic scales is the Endler Multidimensional Anxiety Scales (EMAS: Endler, Parker, Bagby and Cox, Reference Endler, Cox, Parker and Bagby1991). Consideration of cognitive and somatic dimensions, however, is restricted to the state scale of this questionnaire. Conversely, the Lehrer and Woolfolk Anxiety Questionnaire (LWAQ: Lehrer and Woolfolk, Reference Lehrer and Woolfolk1982) does employ trait instructions to assess both cognitive and somatic aspects of trait anxiety, but this instrument does not contain a state scale.
At present, there are few data supporting the validity of the cognitive-somatic distinction within trait anxiety. The validation of this distinction not only would advance conceptual understanding of anxiety, but could also have important applied implications. For example, assessing distinct cognitive and somatic dimensions of trait anxiety may serve to enhance the prediction of an individual's state anxiety response to stress. The combination of the cognitive-somatic and state-trait distinctions in a single assessment device also provides possible advantages. An explicit test of the validity of the distinction between trait cognitive and somatic anxiety would contribute to knowledge of the factors that comprise trait anxiety and this was the first aim of the present series of studies (studies 1 and 2). After having confirmed the validity of the cognitive-somatic distinction within both state and trait anxiety, the second aim of the present research was to investigate whether each dimension of trait anxiety does indeed differentially predict anxiety responses to stressful situations (studies 3 and 4).
Study 1: Development of the State-Trait Inventory for cognitive and somatic anxiety (STICSA)
The purpose of the first study was to develop a questionnaire to assess cognitive and somatic dimensions of anxiety at the state and trait levels. If the cognitive-somatic distinction is valid for both levels, then items selected to represent either cognitive or somatic anxiety should cluster together to form separate cognitive and somatic factors respectively, on both the state and trait version of this self-report scale.
Method
Construction of the preliminary item list
It was intended that a single set of items would be used to differentiate cognitive and somatic anxiety on each of the trait and state scales (in line with Reiss, Reference Reiss1997; Zuckerman, Reference Zuckerman1983), with the distinction between state and trait anxiety being made by the instructions on the questionnaire, as is the case with the Speilberger State-Trait Anxiety Inventory. An initial pool of 131 items considered to reflect the dimension of either cognitive or somatic anxiety symptoms was generated by experienced clinical psychologists, clinical graduate students, and research psychologists with interests in emotional assessment, who drew upon their knowledge of alternative anxiety questionnaires and their clinical experience. In order to enhance the content validity of the final scale, the initial pool constituted an exhaustive and exclusive list of cognitive and somatic anxiety symptoms, so that the final, statistically selected items would be the best representatives of cognitive or somatic anxiety.
The item pool was then inspected by three clinical psychology graduate students who were provided with definitions of cognitive and somatic anxiety and were asked to add any further items that they considered to describe either cognitive or somatic sensations. No items were added.
Rating of initial item pool
Eight clinical psychology graduate students rated each item in terms of the degree to which it clearly and unambiguously represented either cognitive or somatic anxiety. From the pool of 131 items, a total of 62 items were judged by raters to be particularly distinctive in this regard, and these were incorporated in the preliminary questionnaire.
Development of the preliminary questionnaire
The preliminary questionnaire consisted of the 62 cognitive and somatic items, presented on two scales. Please refer to Table 2 for item content. First person statements, rather than individual words, were chosen as the item format in order to enhance the description of each anxiety symptom. The trait instruction was “Please read each statement carefully and circle the number which best indicates how you generally feel, that is, how you feel most of the time”. Respondents were required to rate each item on a scale ranging from 1–4 according to the degree to which the statement was true of them (1) almost never; (2) occasionally; (3) often; (4) almost always. The state instruction was “Please read each statement carefully and circle the number which best indicates how you feel right now, at this moment”. Respondents were required to rate each item on a scale ranging from 1–4 according to the degree to which the statement was true of them: (1) not at all; (2) somewhat; (3) moderately so; (4) very much. The items were presented in the same fixed random order within each scale, and the order in which the two scales were presented was counterbalanced.
Participants
On the basis of Ray and Still (Reference Ray and Still1987) who suggest that a response rate of approximately 25% is to be expected for questionnaire returns, 2500 individuals were contacted individually by post and asked to complete the two 62-item preliminary scales. Participants were drawn from varying samples, including final year high school students, staff from local businesses, and academic and general staff of the University of Western Australia. There was no personal remuneration given for participating. In all studies reported, participants completed all scales in one sitting, and the state version of questionnaires was always administered prior to the trait version.
Results and discussion
Participant characteristics
Of the 2500 preliminary questionnaires distributed, 576 completed questionnaires were returned, giving a response rate of 23%. There was a considerable spread in terms of age of respondents, with the mean age being 34.0 years (SD = 14.43), and the age range being 16–82 years. Fifty-five percent of respondents who reported their sex were female (232 males and 314 females responded, with 30 respondents not identifying their gender).
Item analysis and selection of items for confirmatory factor analysis
Following the administration of the preliminary questionnaires, and prior to factor analysis, it is recommended that items be statistically evaluated (Kline, Reference Kline1986), and this was done using scores on the trait scale. In order to exclude items characterized by floor and ceiling effects, items were retained if they had a mean item score above 1.25 and below 3.75. Further, retained items were correlated above .50 with the relevant dimension (cf DeVellis, Reference Devellis1991; Kline, Reference Kline, Saklofske and Zeidner1995). Finally, in order to reduce item redundancy, items with a correlation of above .45 with any other items on the same scale were examined to determine if this could be explained by highly similar item content (Rapee, Craske, Brown and Barlow, Reference Rapee, Craske, Brown and Barlow1996). If so, then only the item with the mean score closer to the mid-point of the range (i.e. 2.50) was retained.
This screening procedure resulted in the retention of 26 items (14 cognitive and 12 somatic). Lisrel 8.30 was employed to analyse scores on these items with confirmatory factor analysis (CFA) using Weighted Least Squares (WLS) method of estimation (due to non-normal data: Joreskog and Sorbom, Reference Joreskog and Sorbom1993).
Fit indices used in the analysis
The chisquare (χ2)/degrees of freedom ratio and the root mean square error of approximation (RMSEA) were used to assess the overall fit of each model. Model fit is frequently deemed to be acceptable with a chisquare/degrees of freedom ratio below 3 (e.g. Bedford and Deary, Reference Bedford and Deary1997). Lower RMSEA values also indicate superior fit. An RMSEA value of less than .05 indicates very good fit, although values of up to .08 have been considered acceptable (Joreskog and Sorbom, Reference Joreskog and Sorbom1993). The Adjusted Goodness of Fit Index (AGFI) is an indicator of overall fit and values of above .90 (Schumacker and Lomax, Reference Schumacker and Lomax1996) indicate good fit. The Comparative Fit Index (CFI) is used to compare models and values above .90 indicate good fit (Schumacker and Lomax, Reference Schumacker and Lomax1996). Finally, The Parsimonious Normed Fit Index (PNFI) is used to assess and compare the parsimony of models with different degrees of freedom, with higher values indicating good fit. There is no standard for how high this value should be to indicate parsimonious fit; rather, this index is best used to compare two competing models.
Trait scale confirmatory factor analysis
Sample size
The sample size after removal of cases with missing values was 538 for the trait scale.
Model estimation and testing the fit
In the initial analysis, with all 26 items included, a correlated two-factor model (an oblique model), but not a one-factor model provided acceptable fit to the data. The chisquare/degrees of freedom ratio was above 5.0 for the one-factor model, but was acceptably low for the two-factor model. The chisquare difference between the two models was large and significant (χ2(1) = 711.13, p < .001), in favour of the two-factor model. The other goodness of fit indices consistently suggested superior fit for the two-factor model. All t-values for the factor loadings were significant at the p < .01 level in both models, with a range in loadings of 0.64–0.87, (t = 32.04–87.70) for the one-factor model and 0.63–0.81, (t = 30.49–85.95) for the two-factor model.
Respecifications
Items were eliminated if the modification indices showed that they loaded on both factors (i.e. if they crossloaded). This resulted in the further deletion of four cognitive items and one somatic item. The final correlated two-factor model (see Table 1) fits the data well, with no items cross-loading, as determined by the modification indices. All loadings on the specified factor were significant at the p < .01 level, with a range in loadings of 0.63–0.89 (t = 24.26–58.97). All loadings on the alternative factor were fixed at zero. The chisquare/degrees of freedom ratio was well below 3, indicating good fit. This correlated two-factor model was compared to a single-factor model and also a two-factor orthogonal model, and the fit statistics indicated superiority of the correlated two-factor model in both cases (see Table 1). The chisquare difference between the one factor and correlated two-factor models was significant (χ2 (1) = 139.47, p < .01) in favour of the correlated two-factor model. The chisquare difference between the correlated and orthogonal models was also significant in favour of the correlated model (χ2(1) = 1893.89, p < 01).
Table 1. Goodness of fit statistics for the one and two-factor models for the final state and trait scales: development sample

One-factor model: all items represent a single latent variable.
Two-factor correlated model: items relating to somatic anxiety symptoms represent one latent variable, and items relating to cognitive anxiety symptoms represent a second, correlated latent variable.
Two-factor orthogonal model: items relating to somatic anxiety symptoms represent one latent variable, and items relating to cognitive anxiety symptoms represent a second, uncorrelated latent variable.
The correlation between sums of scale scores for the cognitive and somatic factors was also calculated, and equalled 0.66, indicating about 56% unshared variance. The split-half reliability coefficient was 0.87 for the cognitive factor, and 0.84 for the somatic factor. The coefficient of determination was 0.94 for each of the cognitive and somatic subscales. These reliability estimates suggest that the trait sub-scales were reliable indicators of their relevant constructs (Osman, Barrios, Aukes, Osman and Markwa, Reference Osman, Barrios, Aukes, Osman and Markway1993). See Table 2 for final item content and factor loadings.
Table 2. Item loadings for the two-factor correlated trait and state models
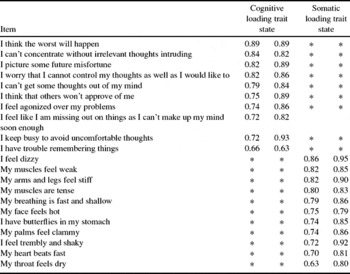
* = loading fixed to zero
State scale confirmatory factor analysis
Sample size
Following removal of cases that contained missing items, the sample size was 556 for the state scale.
Model estimation, and testing the fit
The state scale data were analysed using the 21 items shown in Table 2. One-factor, correlated two-factor, and two-factor orthogonal models were run on this data set. The correlated two-factor model (see Table 1) fit the data well, with no items cross-loading, as determined by the modification indices. All loadings on the specified factor were significant at the p < .01 level, with a range in loadings of 0.63–0.95 (t = 24.26–68.97). The fit statistics indicated superiority of the correlated two-factor model in both cases (see Table 1). The chisquare difference between the one factor and correlated two-factor models was significant (χ2 (1) = 103.70, p < .01) in favour of the correlated two-factor model. The chisquare difference between the correlated and orthogonal models was also significant in favour of the correlated model (χ2(1) = 3780.39, p < 01).
The correlation between the scale scores for the cognitive and somatic factors was .73, indicating about 47% unshared variance. The split half reliability for the cognitive scale was 0.90, and the 0.88 for the somatic scale. The coefficient of determination was 0.97 for each of the cognitive and somatic scales. See Table 2 for the item loadings on each of these two state factors.
In summary, this study has yielded strong support for the validity of the distinction between cognitive and somatic dimensions within both trait and state anxiety.. Furthermore, it has resulted in the development of a questionnaire instrument capable of assessing these dimensions. Before proceeding to investigate the capacity of the two trait forms to predict the degree to which different stressors impact on state anxiety responses, it was considered prudent to ensure that the factor structure of this new instrument is reliable.
Study 2: Replication of the STICSA factor structure
The primary aim of this second study was to determine whether the factor structure of the trait and state scales obtained in Study 1 can be replicated. In testing the reliability of the factor structure of the STICSA in Study 2, we considered it desirable to test generalizability by carrying out the replication on a population of participants that differed from those in Study 1. Students were a readily accessible population that differed from the original population, and so permitted this.
Method
Participants, materials, and procedure
A total of 941 undergraduate psychology students participated in the current study, in return for course credit. The trait scale of the STICSA was administered to 712 undergraduate students whose mean age was 19.13 years (SD = 6.88). The state scale of the STICSA was administered to a further 229 undergraduate students (66 males and 163 females) whose mean age was 19.52 years (SD = 7.45).They participated in groups of approximately 25 during their usual laboratory class.
Results and discussion
STICSA trait scale confirmatory factor analysis
The sample size after deletion of missing values was 687. Scores were subjected to a confirmatory factor analysis using an identical method of estimation to that employed in Study 1. The correlated two-factor model (see Table 3) fit the data well, with no items cross-loading, as determined by the modification indices. All loadings on the specified factor were significant at the p < .01 level, with a range in loadings of 0.66--.94. All loadings on the alternative factor were fixed at zero. The fit statistics indicated superiority of the correlated two-factor model (see Table 3). The chisquare difference between the one factor and correlated two-factor models was significant (χ2 (1) = 103.70, p < .01) in favour of the correlated two-factor model. The chisquare difference between the correlated and orthogonal models was also significant in favour of the correlated model (χ2(1) = 956.11, p < 01).
Table 3. Goodness of fit statistics for the one-factor, two-factor orthogonal and two-factor correlated models for the trait and state scales: replication sample

1In the state scale model, the AGFI and NFI fell below the common benchmarks of acceptability. An adjustment was performed on the AGFI statistic that estimates what the value would be given a large sample size (Steiger, 1995). The adjusted AGFI indicated adequate fit of the correlated two-factor model (.94), suggesting small sample size to be the reason for low AGFI value.
The correlation between the scale scores for the cognitive and somatic factors was .59. The total coefficients of determination were calculated and found to be 0.94 for the trait somatic scale and .95 for the trait cognitive scale, indicating a high level of reliability.
STICSA state scale confirmatory factor analysis
Of the 229 participants who completed the state version of the STICSA, the sample size after deletion of missing values was 225. The 21 items were subjected to a confirmatory factor analysis using an identical method of estimation as above. The correlated two-factor model (see Table 4) fit the data well, with one item (“I picture some future misfortune”) loading negatively on the somatic factor as well as positively on the cognitive factor. All loadings on the specified factor were significant at the p < .01 level, with a range in loadings of 0.52–0.83 (t = 5.74–20.7). All loadings on the alternative factor were fixed at zero. The chisquare/degrees of freedom ratio was well below 3, indicating good fit. The fit statistics indicated superiority of the correlated two-factor model in both cases (see Table 3). The chisquare difference between the one factor and correlated two-factor models was significant (χ2 (1) = 136.27, p < .01), in favour of the correlated two-factor model. The chisquare difference between the correlated and orthogonal models was also significant in favour of the correlated model (χ2(1) = 32.62, p < 01). The correlation between the cognitive and somatic factors was again .59. The total coefficients of determination were calculated and found to be 0.94 for the state cognitive sale and 0.92 for the state somatic scale, indicating a high level of reliability.
Table 4. Descriptive statistics for the STICSA in Study 3

Convergent and discriminant validity of the STICSA
Correlation coefficients between the STICSA and measures of anxiety and depression were statistically compared in the manner recommended by Meng, Rosenthal and Rubin (Reference Meng, Rosenthal and Rubin1992). This procedure involves performing a Fisher Z transformation on the correlation coefficients so that they can be compared via a t-test. It was revealed that the STICSA-state cognitive and somatic scales correlated more with STAI-state scores, than with BDI-II scores (t (225) = 2.10, p < .05; t (225) =1.63, p < .06 respectively). A similar pattern of results was found for the STICSA-trait sale. It was found that the STICSA-trait cognitive and somatic subscales correlated more with STAI-trait scores, than with BDI-II scores (t (686) = 3.45, p < .01; t (686) =1.40, p < .08 respectively). This indicates that the STICSA converges more with an existing measure of anxiety than with an existing measure of depression. This result has also been replicated in a clinically anxious population by Grös, Antony, Simms and McCabe (Reference Grös, Antony, Simms and McCabe2007), who found that the STICSA-trait scale was significantly more correlated to the anxiety scale than to the depression scale of the Depression Anxiety Stress Scales (DASS: Lovibond and Lovibond, Reference Lovibond and Lovibond1995).
In summary, confirmatory factor analyses executed on the state and trait scales of the STICSA supported the presence of two factors within each scale, one representing the cognitive dimension of anxiety and the other the somatic dimension. Once again, these analyses indicated that the data were better explained when cognitive and somatic dimensions of anxiety were present. This replication therefore confirms the reliability of distinct cognitive and somatic anxiety factors at both state and trait levels, and attests to the capacity of the 21-item STICSA to assess these various dimensions of anxiety.Footnote 1 Finally, this study supports the convergence of the STICSA with an existing anxiety measure, and its divergence from an existing depression measure. In the remaining two studies, we employ this questionnaire to investigate the capacity of the two trait measures to predict elevations of the two state measures in response to differing types of stressors.
Study 3: Predictive validity of the STICSA-trait scales #1
The primary aim of the current study was to investigate the construct validity of the state and trait scales of the STICSA, by addressing two questions. First, do the STICSA state scales, and not the trait scales, detect increases in state anxiety when participants are in a situation known to reliably increase anxiety? Second, does the initial level of trait cognitive or trait somatic anxiety predict later changes in state cognitive and somatic anxiety following exposure to a stressful situation? One obvious possibility is that each trait scale will more strongly predict elevations in the corresponding state scale.
Much research has employed exams to investigate the anxiety response, and has shown that exposure to exam situations reliably results in increased state anxiety levels (Busch, King and Guttman, Reference Busch, King and Guttman1994; Calvo, Eysenck, Ramos and Jimenez, Reference Calvo, Eysenck, Ramos and Jimenez1994; Calvo and Miguel-Tobal, Reference Calvo and Miguel-Tobal1998). Furthermore, it has clearly been demonstrated that trait anxiety scores can predict the intensity of the state anxiety reactions to exam situations (e.g. Busch et al., Reference Busch, King and Guttman1994; Zeidner, Reference Zeidner1995). In the present study, therefore, we capitalize upon the established capacity of exam stress to elicit state anxiety elevations, in order to address our two principal questions concerning the STICSA.
Method
Participants
In this study, 129 undergraduate psychology students completed the STICSA trait and state scales during a neutral period (a mid-semester psychology lecture), and again during their end of year examination period (participants completed and returned questionnaires that had been posted to them). The mean age of participants was 21.63 (range 17–45, SD = 5.40) and females constituted 62% of respondents.
Materials and procedure
Students were invited to complete the STICSA at the end of a mid-semester lecture, and were informed that they would receive the questionnaire in the mail a second time in 7 weeks if they provided their contact details. Mid-semester was considered to be a low stress time for students as it did not coincide with deadlines for any heavily-weighted psychology assignments, and will be referred to as the baseline period. The second administration occasion coincided with the commencement of the end-of-year examination period and will be referred to as the exam period. Participants returned completed questionnaires in an addressed, reply paid envelope.
Results and discussion
Stability of the state and trait scales
Table 4 displays the summary statistics for the STICSA state and trait scales across both administrations. The correlation between the scale scores for the trait cognitive and somatic factors at time 1 was .54 indicating about 46% unshared variance. The correlation between the scale scores for the state cognitive and somatic factors at time 1 was .67 indicating about 33% unshared variance. At time 2, the correlation between the scale scores for the trait cognitive and somatic factors was .64 and .58 for the state scale.
A three-way, repeated measures ANOVA with assessment period (baseline vs. exam), anxiety dimension (cognitive vs. somatic), and questionnaire form (state vs. trait) as within subject factors yielded a significant main effect for anxiety dimension, F(1,128) = 257.9, p < .01, indicating that mean cognitive scores, on average, were higher than mean somatic scores. The main effect of assessment period was also significant, with mean scores during examination stress being higher relative to baseline, F(1,128) = 12.58, p < .01. Of greatest importance for our current purpose, however, was the significant two-way interaction between assessment period and questionnaire form, F(1,128) = 16.80, p < .01. A simple effects analysis revealed that mean state anxiety scores at exam time were higher relative to mean state scores at baseline F(1,128) = 172.23, p < .01. In contrast, no significant difference between trait scores at baseline and exam time was observed, F(1,128) = .76, ns. This supports the prediction that the trait scale scores would remain stable in response to stress, while the state scale scores would become elevated by exposure to stress. The non-significant three-way interaction suggests that this pattern did not differ for cognitive and somatic scales, suggesting that the trait and state scales displayed these properties to a similar degree for both cognitive and somatic items. See Table 4 for internal consistency and test-retest correlation statistics.
Predictive capacity of the STICSA trait scales
The next step in the analysis was to determine if baseline STICSA trait scale scores could predict change in state scale scores from baseline to exam time. A sequential multiple linear regression analysis was performed on the data. It was considered important to take account of state baseline scores before entering trait scores into the regression, in order that the capacity of the STICSA trait scales in predicting the change in state scores between non-stressful and stressful conditions could be assessed. Accordingly, state scores at baseline were always entered in the first step of the regression so that they did not hinder the interpretation of variance predicted by the trait scales, which were entered in the second step. This is a stringent test of the predictive validity of the trait scales.
Four multiple regression analyses were performed in order to determine if the trait cognitive and somatic scales differentially predicted state cognitive and somatic scores during examination stress. In the first analysis, the trait cognitive score at baseline predicted an additional 5.2% of variance in state cognitive scores during examination stress, (F(2,126) = 9.18, p < .01, total R2 = .29). Interestingly, trait cognitive scores also predicted a significant amount of additional variance (5.4%) in the state somatic scores during examination stress, (F(2,126) = 8.82, p < .01, total R2 = .23). The trait somatic scale did not account for a significant amount of additional variance for either the state cognitive or somatic scores during examination stress, (F(2,126) = 0.01, ns, total R2 = .24; F(2,126) = 0.01, ns, total R2 = .17, respectively).
In summary, the scores on the trait cognitive scale at baseline predicted elevations in both state cognitive and somatic scores during the examination period, whereas scores on the trait somatic scale at baseline did not predict elevations in either state cognitive or somatic scores during the examination period. These results may suggest that the trait somatic scale of the STICSA could be a poor predictor of state anxiety responses to stress, and so could represent an inadequate trait measure. While the data of the present study are in accord with such an explanation, it may be premature to reach this conclusion. It may be the case that each of the trait scales of the STICSA predict anxiety responses to a particular class of stressful situation. Specifically, it is plausible that trait cognitive anxiety may predict general state anxiety responses to cognitive stressors, while trait somatic anxiety may predict general state anxiety responses to somatic stressors.
A cognitive stressor in the present research is one that ultimately induces general state anxiety (i.e. elevations in both cognitive and somatic state anxiety), but which does so by more directly eliciting the cognitive symptoms of anxiety such as apprehension, lack of concentration, and lack of control over thoughts. These cognitive symptoms may then in turn lead to the somatic symptoms of state anxiety. Examination stress may be an example of a cognitive stressor as this directly elicits cognitive symptoms such as worry (Borkovec, Robinson, Pruzinsky and DePree, Reference Borkovec, Robinson, Pruzinsky and Depree1983), which in turn produces somatic symptoms. A somatic stressor, on the other hand, would be a stressor that more directly elicits somatic symptoms of anxiety such as increased heart and respiration rate, dizziness, and perspiration. Inhalation of carbon-dioxide enriched air is an example of a somatic stressor, which places a somatic stress on the individual and in doing so also elicits state cognitive anxiety in vulnerable individuals (e.g. Beck, Shipherd, and Zebb, Reference Beck, Shipherd and Zebb1996; Rapee and Medro, Reference Rapee and Medro1994).
To determine whether the trait somatic scale of the STICSA is simply a less powerful predictor of state anxiety than is the trait cognitive scale, or whether the trait somatic scale predicts cognitive and somatic state anxiety responses to somatic stressors, it is necessary to conduct a study similar to the present one but in which the stressor is somatic rather than cognitive in nature. It would then be possible to determine whether the trait somatic scale of the STICSA predicts elevations in state cognitive and somatic anxiety following the somatic stress, or whether it again has no predictive capacity. This was the aim of the fourth and final study.
Study 4: Predictive validity of the STICSA-trait scales #2
The current study assessed the capacity of the STICSA-trait scales to predict state anxiety responses to a cognitive and a somatic stressor. The study design will reveal whether the trait cognitive scale would predict state anxiety responses to cognitive but not to somatic stressors, and whether the trait somatic scale would predict state anxiety responses to somatic but not cognitive stressors. The cognitive stressor in this study was, once again, impending university examinations. The somatic stressor that has immediate and direct effects on physiological processes was inhalation of CO2-enriched air. Inhalation of CO2-enriched air is a frequently used somatic stressor (e.g. Eke and McNally, Reference Eke and McNally1996; Forsyth, Palav and Duff, Reference Forsyth, Palav and Duff1999). Response to CO2 inhalation has been found to relate to level of anxiety vulnerability (e.g. Beck, et al., Reference Beck, Shipherd and Zebb1996). Although the STICSA somatic scale enquires about symptoms that are directly elicited by CO2 inhalation, the degree of increase in somatic symptoms on the state scale was expected to be predicted by trait anxiety level.
Method
Participants
Undergraduate psychology students were contacted by telephone and invited to participate in the study in return for course credit. The mean age of the 42 participants was 18.6 years (SD = 3.45) and females constituted 71% of the sample. Participants were tested individually for the laboratory component of the study which involved the administration of CO2-enriched air. Each participant was also invited to complete a second questionnaire-based component of the study, which involved completing the STICSA under both neutral (6 to 7 weeks prior to exams) and cognitive stressor conditions (end of semester examination period). Thirty two participants completed both parts of the study.
Apparatus
STICSA
For the laboratory component of the study, the state and trait scales of the State-Trait Inventory for cognitive and somatic anxiety (STICSA) were administered in paper and pencil fashion. The STICSA was administered on the internet for the exam stress component of the study.
Experimental hardware
Personal computers and Internet
The STICSA state scale was administered on the internet, once 6 to 7 weeks before the examination period, and once during the examination period.
Gas administration equipment
The air mixtures were contained in two standard gas cylinders, one of which contained medical air, the other contained the 5% CO2-enriched medical air. These cylinders were kept out of participants’ view in a room adjoining the testing room, with the tubing from the cylinders entering the testing room through a small hole in the wall. After decompression, the medical air and CO2-enriched air were fed through vinyl tubes to a y-valve which was connected to a tube leading to a demand valve and mouthpiece. This set-up allowed the air mixtures to be changed without interrupting the airflow, such that the change in air mixture was not detectable by participants. The participants breathed via a mouthpiece into the valve, their nose being occluded by a nose clip.
Testing room
The testing space was a small room that contained an armchair, table, and computer. A one-way mirror allowed participants to be monitored at all times without the experimenter being in the participants’ presence.
Procedure
For the examination stress component of the current study, participants were required to complete the STICSA trait and state scales over the internet 6 to 7 weeks prior to mid-year examinations (a low stress time), and complete the state scales again either during the pre-examination study period or during the first week of the examination period (a high stress time). Questionnaires completed after this were not included in the analysis. The laboratory component of the study was conducted over 2 weeks, 6 to 7 weeks prior to the end of semester examination period. Participants were informed that the study was designed to assess the effects of breathing different mixtures of air. On arrival at the laboratory testing session, written consent was gained and the possible effects of CO2 were explained in an innocuous manner. Participants then completed the STICSA state and trait forms. The mouthpiece was introduced to the participants who then took some practice breathes of medical air through it. They then were asked to place the nose-clip on. The experimenter then asked the participant to begin breathing through the mouthpiece, and left the room. During the first 5 minutes (the adaptation phase), the participant breathed only medical air. After 5 minutes had elapsed, the 5% CO2 mixture was introduced and administered for 15 minutes. The participants were aware that they could discontinue the procedure at any time by taking the mouthpiece off if they felt the need.
After 20 minutes, the experimenter returned to the testing room and asked the participant to remove the mouthpiece, and complete the STICSA state scales. Finally, participants were debriefed and reminded to complete the STICSA on the internet during the exam period.
Results and discussion
Predicting state anxiety response to a cognitive stressor (examinations)
A total of 32 participants completed the STICSA state scales on the Internet over the end of semester examination period. Table 5 conveys the mean STICSA state scores on each testing occasion. The STICSA trait scale was completed only at the low stress time and participants obtained a mean score of 19.05 (SD = 3.75) on the cognitive scale, and a mean score of 15.95 (SD = 2.78) on the somatic scale.
Table 5. Descriptive statistics for STICSA state scores in Study 4

A two-way, repeated measures ANOVA on STICSA state scores, with time (baseline vs. exam stress) and anxiety dimension (cognitive vs. somatic) as factors, yielded a significant main effect for time F(1,31) = 7.28, p < .01, with scores under exam stress being higher than scores at baseline. The main effect of anxiety dimension also was significant F(1,31) = 23.72, p < .01, with state cognitive scores being higher than state somatic scores. The interaction was non-significant F(1,31) = 0.07, ns, providing no evidence to indicate that the cognitive and somatic scales became differentially elevated under exam stress, relative to baseline.
The next step was to determine if initial STICSA-trait scores predicted change in STICSA-state scores from baseline to exam stress conditions. The data were subjected to sequential multiple linear regression analyses identical to those performed in the previous study. The pattern of findings revealed by this set of analyses was identical to the pattern of findings obtained in the previous study. First, the STICSA-trait cognitive scale at baseline predicted a significant amount of additional variance in state somatic scores at exam time after state somatic scores at baseline had been accounted for in the first step of the regression (F(1,29) = 12.02, p < .05, total R2 = .31). Trait cognitive scores at baseline also predicted a significant amount of additional variance in the state cognitive scale at exam time (F(1,29) =14.23, p < .01, total R2 = .37). In contrast, scores on the trait somatic scale did not predict a significant amount of additional variance for either the cognitive or the somatic state scores at exam time (F(1,29) = 3.01, ns, total R2 = .2; F(1,29) = 2.08, ns, total R2 = .07 respectively). It is possible that the administration of the STICSA on the Internet may have influenced results. Given that the pattern of results was identical to those in Study 3, this was considered unlikely.
Predicting state anxiety response to a somatic stressor (CO2 inhalation)
Table 5 illustrates the descriptive statistics for the STICSA trait and state scores across baseline and post CO2 administrations. A two-way, repeated measures ANOVA of state scores, with manipulation phase (baseline vs. CO2 stress) and anxiety dimension (cognitive vs. somatic) as factors yielded a significant main effect for manipulation phase F(1,41) = 13.55, p < .01 with state anxiety scores post CO2 exposure being higher than scores at baseline. The main effect of dimension was not significant, F(1,41) = 0.12, p < .8. The interaction was significant F(1,41) = 64.46, p < .01, indicating that the cognitive and somatic scales differentially changed from baseline to post CO2. The increase in somatic scale scores from baseline to post- CO2 was significant t(41) = 6.76, p < .01, whereas there was no significant change in cognitive state scores, t(41) = 1.23, ns. This finding that there was not a significant overall increase in cognitive state anxiety following CO2-inhaltion may reflect that the CO2 manipulation increased cognitive state anxiety only for vulnerable individuals.
The next step was to determine if STICSA-trait scores at baseline could predict change in STICSA-state scores from baseline to post-CO2 inhalation. A set of sequential multiple linear regression analyses identical to those employed on the exam stress data was performed on these data. A search for multivariate outliers revealed that one case obtained a Cook's distance value of greater than 1. Consequently, this case was deleted from the analysis. In the first regression analysis, it was found that baseline STICSA-trait somatic scores predicted a significant amount of additional variance in state somatic scores post CO2-inhalation (F(1,40) = 4.53, p < .05, total R2 = .35). Importantly, trait somatic scores at baseline also predicted a significant amount of additional variance in the state cognitive scale post CO2-inhalation (F(1,40) = 6.24, p < .02, total R2 = .55). In contrast, baseline trait cognitive scores did not account for a significant amount of additional variance in either the cognitive or somatic state scores post CO2-inhalation (F(1,40) = 2.70, ns, total R2 = .51; F(1,40) = 0.06, ns, total R2 = .28, respectively).
In summary, the present study found that baseline trait cognitive scale scores of the STICSA predicted a significant amount of variance in both cognitive and somatic state anxiety responses under examination stress. Baseline STICSA trait somatic scale scores did not predict variance on either state scale in response to this cognitive stressor. However, baseline trait somatic scale scores of the STICSA at baseline did predict a significant amount of variance in both cognitive and somatic state anxiety responses following inhalation of CO2-enriched air. Baseline STICSA trait cognitive scale scores did not predict variance on either state scale in response to this somatic stressor.
General discussion
The first two studies in the present series describe the development of an instrument, the STICSA, designed to assess cognitive and somatic anxiety at state and trait levels. These first two studies suggest that the STICSA is a reliable and valid measure of anxiety in a nonclinical population. A subsequent confirmatory factor analysis employing 709 anxiety patients confirms the factor structure of the trait and state scales in a clinical population (Grös et al., in press). Now that the capacity of the STICSA to distinguish state and trait dimensions of cognitive and somatic anxiety has been established, it would be of potential value for future research to examine the association between the present scales and previous scales developed to assess cognitive and somatic anxiety. This would shed light upon which existing measures of cognitive and somatic anxiety most plausibly assess state aspects, and which assess trait aspects of each dimension.
The third and fourth studies suggest that trait cognitive and somatic anxiety represent not the type of state anxiety an individual will experience under stress, but the type of stressor under which an individual will display elevated state anxiety. A double dissociation was revealed, with the trait cognitive scale predicting state anxiety responses to cognitive but not somatic stressors, and the trait somatic scale predicting state anxiety responses to somatic and not cognitive stressors. This dissociation provides strong evidence for the hypothesis that a match between the vulnerability type assessed by each STICSA trait scale, and the characteristics of the stressor, may moderate the degree to which each STICSA-trait scale predicts increases in state anxiety.
There is evidence from previous research that is consistent with this proposal that a match between vulnerability type and stress type may be important in predicting the state anxiety response. For example, the test anxiety literature, while not commonly reporting multidimensional trait anxiety measures, suggests that there may be a distinct facet of trait anxiety that predicts state anxiety specifically in response to test situations. That is, state anxiety in response to test situations is best predicted by a situation-specific measure of trait anxiety. This conceptualization of trait anxiety suggests that trait anxiety measures not only can predict the magnitude of state anxiety reactions, but also can predict the particular stressful circumstances under which such state anxiety reactions will occur. A person with a high trait test anxiety score would be expected to become more state anxious than a person with low trait test anxiety, specifically in test situations.
Endler and his colleagues have conducted research that directly supports the contention that dimensions of trait anxiety represent the degree to which an individual will become state anxious in response to a corresponding class of stressor. Endler concludes that trait anxiety provides qualitative as well as quantitative information, in that it predicts the type of situation an individual will experience state anxiety in, as well as the degree of state anxiety an individual will experience. This interactional model of anxiety postulates that if there is a match between the situation and vulnerability type, that a state anxiety reaction will be elicited. Endler proposes four dimensions of trait anxiety, which represent situations in which an individual is vulnerable to become state anxious; physical, ambiguous, social, and daily routines. Endler et al. (Reference Endler, Parker, Bagby and Cox1991) suggest that individuals with high social evaluation trait anxiety, for example, will demonstrate an increased generalized state anxiety reaction only to this class of stressful situation. Although Endler and colleagues do not identify cognitive and somatic trait anxiety dimensions, this present research suggests that the distinction between these dimensions also is important for accurate prediction of the state anxiety response. In summary, one implication of the present research is that it has added to our existing understanding of the nature of trait anxiety. First, it has provided strong evidence to indicate that trait anxiety is a multidimensional construct, comprised at least of cognitive and somatic dimensions. Further, the results suggest that each of these trait dimensions represent not what class of symptoms an individual will predominantly experience when state anxious, but rather the kind of stressful situation that will lead to generally elevated state anxiety.
Cognitive and somatic state anxiety in particular are highly correlated. We propose that state cognitive and somatic anxiety are interrelated and feed off one another. For example, an individual with high trait somatic anxiety may respond to physical exercise with increased heart rate that then elicits an increase in state cognitive anxiety (perceiving the increased heart rate as threatening). This serves to further increase state somatic anxiety. This account is consistent with Clark's (Reference Clark1986) cognitive model of panic. It is logically possible that a similar cycle of anxiety may operate in high trait cognitive anxiety individuals, when triggered by an initial cognitive symptom. Such a cycle is consistent with Wells’ (Reference Wells1995) metacognitive model of generalized anxiety. In response to some cognitive stress, an individual high in trait cognitive anxiety responds with elevated cognitive anxiety (worry about worry), which in turn elevates state somatic anxiety. The appraisal of an elevation in cognitive anxiety symptoms as threatening leads to an increase in general state anxiety.
While the current research is consistent with the notion that trait anxiety as assessed by the STICSA represents the type of situation in which an individual will be vulnerable to experience state anxiety, it will be important for future research to investigate the generalizeability of the findings. The cognitive and somatic stressors employed in the current research differed in number of ways aside from their cognitive or somatic quality. For example, the cognitive stressor of examinations was a naturally occurring stressor in a student's life. In contrast, the somatic stressor of CO2 inhalation was contrived in a laboratory. Also, the cognitive stressor's duration was longer than that of the somatic stressor, and so it could be postulated that the trait cognitive scale better predicts state anxiety responses to chronic stressors, while the trait somatic scale better predicts state anxiety responses to acute stressors. Future research should aim to investigate these alternative possibilities. Further, the current research did not investigate whether sex differences exist in terms of symptom reporting on the STICSA and the predictive capacity of this measure.
The validity of the STICSA in new populations is also warranted. Although the development sample of the STICSA was not restricted to the use of undergraduate students, the second, third, and fourth studies employed a university student population. It is therefore important that future research should investigate the generalizability of the current results to other populations, particularly clinical (for which there exists one published study to date, Grős et al, in press).
If such future research upholds our proposed interpretation of the current findings then this will have applied implications, beyond the theoretical issues discussed above. For example, the multidimensional assessment of anxiety may allow more fine-grained investigations of the nature and function of state and trait anxiety, but also may enhance our capacity to predict the anxiety response in different situations. In applied settings this may be of considerable benefit. For example, in selecting candidates for various stressful occupations, it may be useful to predict which individuals will develop disproportionate anxiety responses to the particular stressors associated with each particular position. Implications for clinical setting also exist, as it also is plausible that alternative dimensions of trait anxiety, such as those distinguished by the STICSA may afford researchers with enhanced prediction of responses to different anxiety treatments. The present programme of research has suggested that cognitive and somatic dimensions of trait anxiety represent vulnerabilities to become generally state anxious in response to cognitively or somatically stressful situations respectively. It may also be the case that these dimensions of trait anxiety will predict anxiety reduction in response to cognitively or somatically oriented treatments for anxiety. Specifically, an individual high in trait cognitive anxiety may experience a greater reduction in both cognitive and somatic anxiety symptoms following a cognitively oriented anxiety management technique. Conversely, an individual with high somatic anxiety may respond with a greater reduction in both cognitive and somatic symptoms following a somatically oriented anxiety management technique. This suggests that the greatest reductions in anxiety symptoms may be found when the treatment modality is matched to an individual's primary anxiety vulnerability. Of course, such a proposal is speculative at this stage and this potential application of the STICSA can be established only through future research.
In summary, the present research confirms that state and trait anxiety both are multidimensional, with each including cognitive and somatic dimensions. The findings also suggest that trait cognitive anxiety may represent a vulnerability to experience general state anxiety in response to cognitive stressors, and that trait somatic anxiety may represent a vulnerability to experience general state anxiety in response to somatic stressors. Put concisely, the trait cognitive and somatic scales of the STICSA predict when a state anxiety response will occur, rather than what the qualitative nature of the anxiety response will be. We hope that the STICSA may prove to be of continued value to those many clinical investigators who aspire to enhance our knowledge of anxiety vulnerability, and our capacity to predict anxiety responses to stressful stimuli.


Comments
No Comments have been published for this article.