


Introduction
Reassurance seeking (RS) is a behaviour recognized for its role in maintaining various mental disorders. Despite its prevalence (e.g. Starcevic et al., Reference Starcevic, Berle, Brakoulias, Sammut, Moses, Milicevic and Hannan2012), facets of RS are under-represented in existing measures. The aim of this paper is to present the development, validation and psychometric analyses of a novel measure of RS behaviour.
Individuals with mental disorders including obsessive-compulsive disorder (OCD), depression and anxiety disorders [e.g. generalized anxiety disorder (GAD); social anxiety disorder (SAD)] may seek reassurance in ways that become repetitive and detrimental (e.g. American Psychiatric Association, 2013; Beesdo-Baum et al., Reference Beesdo-Baum, Jenjahn, Höfler, Lueken, Becker and Hoyer2012; Coyne, Reference Coyne1976; Heerey and Kring, Reference Heerey and Kring2007; Parrish and Radomsky, Reference Parrish and Radomsky2010; Warwick and Salkovskis, Reference Warwick and Salkovskis1985). Individuals with such disorders may have biases towards evaluating uncertainty as threatening, and previous research has demonstrated an association between ambiguity and RS (e.g. Boelen and Reijntjes, Reference Boelen and Reijntjes2009; Carleton et al., Reference Carleton, Mulvogue, Thibodeau, McCabe, Antony and Asmundson2012; Dugas et al., Reference Dugas, Freeston and Ladouceur1997; Parrish and Radomsky, Reference Parrish and Radomsky2011; Tolin et al., Reference Tolin, Abramowitz, Brigidi and Foa2003). Across disorders, functions of RS appear largely the same (e.g. Rector et al., Reference Rector, Kamkar, Cassin, Ayearst and Laposa2011). Specifically, RS reduces distress, perceived threat and/or responsibility – at least in the short-term; long-term, it prevents individuals from learning corrective information about perceived threats or their ability to cope (e.g. Coyne, Reference Coyne1976; Halldorsson and Salkovskis, Reference Halldorsson and Salkovskis2017a,b; Parrish and Radomsky, Reference Parrish and Radomsky2010; Salkovskis, Reference Salkovskis1999). This can be problematic if covert, or subtle, safety-seeking behaviours are not identified and subsequently addressed. Furthermore, when RS becomes pervasive, it is associated with consequences including relationship disruption, reduced workplace productivity, and distress (e.g. Coyne, Reference Coyne1976; Kobori et al., Reference Kobori, Salkovskis, Read, Lounes and Wong2012). Given its similarities across disorders, and considering significant co-morbidity rates, there is need for a measure that captures overlapping functions and consequences of RS behaviour (e.g. Kessler and Wang, Reference Kessler and Wang2008).
Conceptualizations of RS across disorders suggest that it is a repetitive safety-seeking behaviour following perceived general or social/relational threats, despite having received the information before (e.g. ‘Are you really sure the door is locked?’, ‘Are you sure you still love me?’; e.g. Beesdo-Baum et al., Reference Beesdo-Baum, Jenjahn, Höfler, Lueken, Becker and Hoyer2012; Coyne. Reference Coyne1976; Heerey and Kring, Reference Heerey and Kring2007; Parrish and Radomsky, Reference Parrish and Radomsky2010; Warwick and Salkovskis, Reference Warwick and Salkovskis1985; see also Rachman, Reference Rachman2002). Notably, the examples above highlight overt, obviously noticeable RS, wherein someone seeks responses from a partner who is conscious of the question. However, reassurance seekers are commonly aware of possibilities for negative interpersonal consequences, and may instead engage in subtle, or covert RS (e.g. Kobori and Salkovskis, Reference Kobori and Salkovskis2013; Parrish and Radomsky, Reference Parrish and Radomsky2010). An example of covert RS would be a person making a statement and waiting to see if another person disagrees, thereafter taking the absence of an objection as reassurance (e.g. ‘I washed, so there are no germs…’; Kobori and Salkovskis, Reference Kobori and Salkovskis2013; Kobori et al., Reference Kobori, Salkovskis, Read, Lounes and Wong2012; Parrish and Radomsky, Reference Parrish and Radomsky2010). Covert RS is viewed as a maintenance factor for mental health disorders in the same vein as overt RS and in vivo checking, by preventing corrective learning (e.g. about threat or one’s ability to cope without receiving reassurance), which in turn may prevent clients from achieving best outcomes in therapy to reduce the behaviour (e.g. Parrish and Radomsky, Reference Parrish and Radomsky2010; Rachman, Reference Rachman2002). The social element of RS behaviour may increase motivation relative to other safety-seeking behaviour to make the behaviour unnoticeable by others; if it is effectively hidden, this may also have the effect of making covert RS unnoticed by clinicians when there is not an effective questionnaire to capture it.
Covert as opposed to overt RS is likely intended to reduce negative consequences, as explained by Coyne’s interactional model (Reference Coyne1976). Coyne’s model suggests that individuals seek reassurance to reduce uncertainty/distress about relationships, self-worth or self-competence. Unfortunately, repeated RS eventually bothers significant others and leads to rejection, thereby confirming core fears (e.g. that they are unwanted/incompetent; Coyne, Reference Coyne1976). Individuals with OCD also report concern about the consequences of RS and that this is a motivation to become covert (Kobori et al., Reference Kobori, Salkovskis, Read, Lounes and Wong2012; Parrish and Radomsky, Reference Parrish and Radomsky2010). Individuals with other disorders probably also use covert RS to avoid negative interpersonal consequences, although this has been under-studied, perhaps due to lack of measures capturing covert RS. For instance, Heerey and Kring (Reference Heerey and Kring2007) found that when non-anxious individuals were paired for conversation with socially anxious individuals, they produced more verbalizations of empathy and support than those paired with other non-anxious individuals, despite the researchers not finding a difference across groups in the pattern of verbal RS leading to empathy and support. This suggests that the socially anxious individuals may have been eliciting support in other ways than verbal RS. Indeed, it may feasibly be the case that individuals who engage in covert RS could be unaware of the extent to which they engage in the behaviour, and may be better able to report on the behaviour by responding to a questionnaire rather than having to freely report symptoms.
Currently, measures exist to assess aspects of RS, namely the (1) Reassurance Seeking Scale (RSS; Rector et al., Reference Rector, Kamkar, Cassin, Ayearst and Laposa2011), a 30-item measure assessing RS about decision-making, social attachment and general threats, but which does not differentiate covert RS; (2) Threat-related Reassurance Seeking Scale (TRSS; Cougle et al., Reference Cougle, Fitch, Fincham, Riccardi, Keough and Timpano2012), consisting of eight items assessing RS in response to perceived general threats/worry or evaluative threats, but which Cougle and colleagues (Reference Cougle, Fitch, Fincham, Riccardi, Keough and Timpano2012) note may lack comprehensiveness; and (3) Reassurance Seeking Questionnaire (ReSQ; Kobori and Salkovskis, Reference Kobori and Salkovskis2013), a measure of RS in OCD consisting of four scales, each with several subscales, assessing reassurance Source (21 items), Trust (18 items), Intensity (16 items) and Carefulness (11 items), which is highly informative but could be too lengthy for use in research or clinical settings.Footnote 1 Beyond these, the Reassurance Questionnaire (Pugh et al., Reference Pugh, Hadjistavropoulos and Sharpe2013; Speckens et al., Reference Speckens, Spinhoven, van Hemert and Bolk2000) was published with the separate intent of assessing whether patients feel reassured by doctors, and the Depressive Interpersonal Relationships Inventory contains a reassurance-seeking subscale (DIRI-RS; Joiner et al., Reference Joiner, Alfano and Metalsky1992) which features only four items assessing overt social/relational RS and does not permit comprehensive assessment. Thus, there is not currently one measure that captures broadly applicable themes of overt and covert, general threat- and social/relational RS (e.g. Coyne, Reference Coyne1976; Parrish and Radomsky, Reference Parrish and Radomsky2010).
Overall, covert RS is presently difficult to identify, as it is intended to be unrecognized and is essentially absent from existing measures. Having a comprehensive measure of both overt and covert interpersonal RS could advance researchers’ ability to identify the behaviour and could eventually help clinicians deliver more targeted interventions. Additionally, validating a measure including covert RS could illuminate the extent to which it is shared across disorders, thereby contributing to a more unified conceptualization of RS. This study therefore aimed to develop a psychometrically sound measure of covert and overt RS behaviour concerning general and/or social/relational threats.
Method
This study was reviewed and received ethical clearance from the University Human Research Ethics Committee at Concordia University (certificate no. UH2006-080-6).
Thirty initial items were developed by a licensed academic clinical psychologist with extensive experience working with individuals with anxiety, obsessive-compulsive and mood disorders in clinical and research contexts in conjunction with an advanced doctoral-level student specializing in RS behaviour. Additional consultation was also provided by a second licensed clinical psychologist with expertise also in anxiety and mood disorders in research and clinical settings, with experience with questionnaire construction for research and clinical purposes. Items were constructed by examining cognitive behavioural theories (e.g. Beck et al., Reference Beck, Rush, Shaw and Emery1979; Coyne, Reference Coyne1976; Rachman and Hodgson, Reference Rachman and Hodgson1980; Salkovskis, Reference Salkovskis1985) and extracting common themes. Anecdotal clinical reports also informed construction, with the first author having many years of experience working clinically with individuals with problematic RS who report similar styles of seeking reassurance (e.g. seeking reassurance subtly to avoid bothering others), as well as overall themes in triggers and methods of seeking reassurance noted by the third author during interviews for other research studies with individuals with problematic RS. Items included RS about general threats (e.g. safety, mistakes), and social/relational threats (e.g. self-worth, relationships), and were constructed to reflect overt and covert/subtle RS. Items were rated on a 5-point, Likert scale from 0 (‘not at all’) to 4 (‘very much’).
All participants were treated in accordance with principles of ethical treatment of human research participants. This study was reviewed by and received clearance from a University Human Research Ethics committee. Participants were debriefed following completion of all questionnaires and were invited to provide feedback as part of the discussion.
Participants
Data for validating the 30-item measure were collected from a sample of undergraduate students (N = 1821). Undergraduates were compensated with course credit. In addition, 30 individuals with a primary diagnosis of depression, 50 individuals with a primary diagnosis of OCD, and 60 individuals with a primary diagnosis of an anxiety disorder (e.g. GAD, SAD) were also tested to provide an initial description of clinical profiles on the measure, and to conduct known-groups analyses. These participants were recruited from the community via advertisements or were contacted through the laboratory’s existing database of clinical participants, and were compensated $40. Primary diagnosis for the clinical groups (i.e. OCD, depression or anxiety) was established via the Anxiety Disorders Interview Schedule for the DSM-IV (ADIS-IV; Brown et al., Reference Brown, DiNardo and Barlow1994). Co-morbidities were permitted, as this better represents realities of clinical populations than would diagnostically ‘pure’ groups. The primary diagnosis was established by the ADIS interviewer by determining the most severe, distressing and/or disabling symptoms. The first author also provided diagnostic consultation.
Measures
ADIS-IV (Brown et al., Reference Brown, DiNardo and Barlow1994)
The ADIS-IV is a semi-structured diagnostic interview assessing the presence and severity of mental disorders in adults. The interview demonstrates good inter-rater reliability (κ = .81; Brown et al., Reference Brown, DiNardo and Barlow1994). Interviewers required a Bachelor’s degree to qualify for administration and completed comprehensive training. Primary diagnosis was the disorder that received the highest severity rating and resulted in the greatest interference/distress.
Vancouver Obsessional Compulsive Inventory (VOCI; Thordarson et al., Reference Thordarson, Radomsky, Rachman, Shafran, Sawchuk and Hakstian2004)
The VOCI is a 55-item measure of obsessive-compulsive symptomatology. The VOCI had excellent internal consistency in the current undergraduate sample (α = .96) as well as in the clinical sample when collapsing across groups (α = .96). Previous research suggests that the VOCI has good to excellent internal consistency in both OCD (α = .85–.96; Thordarson et al., Reference Thordarson, Radomsky, Rachman, Shafran, Sawchuk and Hakstian2004) and student samples (α = .83–.96; Radomsky et al., Reference Radomsky, Ouimet, Ashbaugh, Lavoie, Parrish and O’Connor2006; Thordarson et al., Reference Thordarson, Radomsky, Rachman, Shafran, Sawchuk and Hakstian2004). The VOCI was selected as a convergent measure based on the previously identified prevalence of RS in OCD (e.g. Starcevic et al., Reference Starcevic, Berle, Brakoulias, Sammut, Moses, Milicevic and Hannan2012).
Beck Anxiety Inventory (BAI; Beck and Steer, Reference Beck and Steer1993)
The BAI is a 21-item measure of anxiety symptom severity. The BAI had excellent internal consistency in the current undergraduate and aggregated clinical samples (α = .91–.94). Previous research suggests the BAI has excellent internal consistency (α = .92) and good convergent validity (Beck et al., Reference Beck, Epstein, Brown and Steer1988). The BAI was selected as a convergent measure based on the prevalence of RS across anxiety disorders (e.g. Heerey and Kring, Reference Heerey and Kring2007).
Beck Depression Inventory – Second Edition (BDI-II; Beck, Steer, and Brown, Reference Beck, Steer and Brown1996)
The BDI-II is a 21-item measure of depression symptomatology. The BDI-II had excellent internal consistency in the undergraduate and collapsed clinical samples (α = .91–.94). The BDI-II previously demonstrated good internal consistency in an undergraduate sample (α = .90; Storch et al., Reference Storch, Roberti and Roth2004), and good convergent and divergent validity. The BDI-II was selected as a convergent measure based on the prevalence of RS in depression (e.g. Joiner et al., Reference Joiner, Alfano and Metalsky1992).
Rosenberg Self-Esteem Scale (RSES; Rosenberg, Reference Rosenberg1965)
The RSES is a 10-item measure of global self-esteem. The RSES showed good internal consistency in the undergraduate and collapsed clinical samples (α = .85–.87), and previously demonstrated excellent internal consistency (α = .91; Sinclair et al., Reference Sinclair, Blais, Gansler, Sandberg, Bistis and LoCicero2010). The RSES was selected as a discriminant measure based upon the theorized negative association between RS and self-esteem.
Intolerance of Uncertainty Scale (IUS; Freeston et al., Reference Freeston, Rhéaume, Letarte, Dugas and Ladouceur1994)
The IUS is a 27-item, well-validated measure of perceptions of and reactions to ambiguous or worrying situations. The IUS was employed to provide criterion validity that negative reactions to uncertainty is associated with RS. The English version of the IUS has previously demonstrated excellent internal consistency (α = 0.94) and re-test reliability (r = .74; Buhr and Dugas, Reference Buhr and Dugas2002). The IUS also demonstrated excellent internal consistency in the current undergraduate (α = .96) and collapsed clinical (α = .95) samples.
Results
Data cleaning
Data from the (N = 1821) undergraduate participants were screened for missing/impossible values, of which there were none. Mahalanobis distance was calculated to identify multivariate outliers with p < .001 (Tabachnick and Fidell, Reference Tabachnick and Fidell2007); 183 participants were identified and excluded. A further 12 participants were excluded due to being univariate outliers with standardized CORSI total scores exceeding Z = 3.29 (Field, Reference Field2009; Tabachnick and Fidell, Reference Tabachnick and Fidell2007). This resulted in a final sample size of 1626. Skewness (0.96, SD = 0.061) and kurtosis (0.677, SD = 0.121) were within acceptable limits.
The final sample of undergraduates (N = 1626) was 85.2% (n = 1385) female. Participants averaged 23.2 years old (SD = 6.02), and ranged from 18 to 68 years old. The collapsed clinical sample had a mean age of 38.86 years (SD = 15.10), ranging from 18 to 80 years old, and was 59.0% (n = 82) female.
Half of the undergraduate cases (n = 813) were randomly selected for an exploratory factor analysis (EFA) to determine the CORSI’s latent structure, surpassing typical guidelines for factor analysis sample size requirements (e.g. Gorsuch, Reference Gorsuch1983). The remaining half were reserved for a confirmatory factor analysis (CFA).
Part A. EFA
Principal axis factoring with oblique rotation was employed to determine the proportion of shared variance accounted for by the latent factors, while allowing for intercorrelations (e.g. Costello and Osborne, Reference Costello and Osborne2005; Martin and Savage-McGlynn, Reference Martin and Savage-McGlynn2013). The data were assessed for multi-collinearity by examining the correlation matrix for values surpassing r = .89 (Field, Reference Field2009); however, no values surpassed r = .69 and there was no evidence of singularity. The Kaiser–Meyer–Olkin measure of sampling adequacy (KMO) was .954, in the superb range and indicating that factor analysis will likely yield unique and reliable factors (e.g. Hutcheson and Sofroniou, Reference Hutcheson and Sofroniou1999). Similarly, the KMO statistic for each individual item fell at or above .90. Inspection of Bartlett’s statistic (χ2 (435) = 13911.68, p < .001) indicated that factor analysis was probably appropriate.
The initial EFA produced five factors with eigenvalues greater than 1, with values of 12.173, 2.166, 1.852, 1.339 and 1.186, suggesting a five-factor solution using Kaiser’s (Reference Kaiser1960) greater-than-one rule. Scree plot inflections suggested two-, four-, five- or six-factor models (Cattell, Reference Cattell1966). Additionally, parallel analysis (O’Connor, Reference O’Connor2000) was conducted to compare whether the extracted eigenvalues were larger than the mean of those obtained from randomly generated, uncorrelated data (Horn, Reference Horn1965; Ledesma and Valero-Mora, Reference Ledesma and Valero-Mora2007). The parallel analysis suggested to retain up to seven factors.
Taking the eigenvalues, scree plots and parallel analysis into account, two-, four-, five- and six-factor models were tested. Theoretical models of RS across disorders and the factors’ interpretability were considered while deciding how many factors to retain (Hayton et al., Reference Hayton, Allen and Scarpello2004). Items were considered for retention if a factor loading exceeded .32 and there were no cross-loadings exceeding .32 (Tabachnick and Fidell, Reference Tabachnick and Fidell2007).
Two-factor model
A two-factor model accounted for 44.17% of the variance after extraction. Examination of the factor correlation matrix showed that the factors were moderately correlated (r = .503). One item was significant cross-loaded above .32 (Tabachnick and Fidell, Reference Tabachnick and Fidell2007). Excluding the cross-loaded item, one factor encompassed 25 items whereas the second factor consisted of four items, rendering the factors substantially unbalanced. Additionally, the factors were not clearly interpretable.
Four-factor model
A four-factor model accounted for 52.05% of the variance after extraction. The correlation matrix showed correlations ranging from low (r = .205) to moderately strong (r = .675), indicating that some factors were closely related whereas others were more conceptually distinct. Nine items were cross-loaded at or above .32 (Tabachnick and Fidell, Reference Tabachnick and Fidell2007) and thus were candidated for removal; however, doing so would result in the third factor retaining only two items, too few for a reliable factor.
Five-factor model
A five-factor model accounted for 55.00% of the variance after extraction. Correlations between the factors ranged from r = .208 to .690, suggesting that the factors may be tapping into unique facets of RS. Four items had complex loadings at or above .32 and were considered for removal (Tabachnick and Fidell, Reference Tabachnick and Fidell2007). When excluding the four cross-loaded items, each of the five factors retained three to eight items, captured distinct facets of RS, and were readily interpretable.
Six-factor model
A six-factor model accounted for 57.12% of the variance after extraction. Inspection of the item content revealed a combination of interpretable and unclear factors, while examination of the correlation matrix revealed that the factors’ associations ranged from r = .247 to .703. Three items loaded above .32 onto two factors and would therefore be removed (Tabachnick and Fidell, Reference Tabachnick and Fidell2007), resulting in a total of 27 items.
Final model selection
On the basis of the EFA, consideration of theories (e.g. Coyne, Reference Coyne1976; Kobori and Salkovskis, Reference Kobori and Salkovskis2013; Parrish and Radomsky, Reference Parrish and Radomsky2010), and anecdotal reports/observations from clinical practice, the five-factor model was chosen as the most parsimonious solution. Four items were removed due to significant cross-loadings as noted above resulting in 26 retained items, and the analysis was re-run forcing five factors. Please refer to Table 1 for information about the cross-loadings of the four removed items, and to Table 2 for the initial, extraction and rotation factor descriptions of the 26-item model. Factor loadings of retained items are displayed in Table 3.
Table 1. Items removed from 30-item CORSI due to complex loadings

Items are presented with numbering from the 30-item CORSI. Factor loadings are in parentheses. C-SR, Covert Social/Relational Threat RS; O-SR, Overt Social/Relational Threat RS; O-G, Overt General Threat RS; C-GP, Covert General Threat Passive RS.
Table 2. Exploratory factor analysis of the reduced 26-item CORSI

Table 3. Factor loadings for exploratory factor analysis with Promax rotation of the retained 26 items

Items are numbered from the 30-item CORSI. RS factors: 1, Covert Social/Relational; 2, Overt General; 3, Covert General Passive; 4, Overt Social/Relational; 5, Covert General Active. h 2 = extraction communalities. Loadings below .32 are suppressed for clarity.
The first factor, labeled Covert Social/Relational Threat RS (C-SR), consists of seven items related to subtle RS about relationships/self-worth (e.g. ‘I often try to find out if others care about me without asking them directly’). The second factor, labeled Overt General Threat RS (O-G), includes eight items concerning seeking reassurance openly from others in response to distress from general threats (e.g. ‘I become so anxious when I am uncertain about something that I need to ask my friends or family for reassurance over and over again’). The third factor, labeled Covert General Threat Passive RS (C-G P ), consists of four items assessing subtle RS about general threats, with the person taking a ‘wait-and-see’, observational approach to determine whether a situation/object is safe (e.g. ‘If I am uncertain about the cleanliness of an object, I will wait until somebody else touches it before I do’). The fourth factor, labeled Overt Social/Relational Threat RS (O-SR), consists of three items associated with obviously noticeable RS about relationships/self-competence (e.g. ‘I sometimes threaten to end a friendship in order to see if my friends really care about me’). The fifth factor, labeled Covert General Threat Active RS (C-G A ), consists of four items related to subtle yet active attempts to seek reassurance about general threats in a ‘start-then-check’ manner, (e.g. ‘When I am anxious about doing something, I often start and if nobody around me warns me to stop, I assume it is OK to continue’). Upon consideration of the measure’s factor structure, intended purpose and potential novel contributions, the measure was titled the Covert and Overt Reassurance Seeking Inventory (CORSI; please see Appendix).
Correlations between CORSI factors
A total score for each of the factors was obtained by summing its items. A total CORSI score was obtained by summing all items. Please refer to Table 4 for factor and total score means from the undergraduate EFA sample, and to Table 5 for final correlations between the CORSI factors following removal of the four complex items.
Table 4. CORSI 26-item undergraduate student and clinical sample means

Data are presented with standard deviations in parentheses. CORSI, Covert and Overt Reassurance Seeking Inventory; RS factors: O-G, Overt General; C-GA, Covert General Active; C-GP, Covert General Passive; O-SR, Overt Social/Relational; C-SR, Covert Social/Relational. aStatistically significant difference in clinical group factor scores. Significance indicators represent the comparison between the undergraduate sample and the clinical group heading the column. ‡.10 < p < .05; *p < .05, **p < .01, ***p < .001.
Table 5. Correlations between the final 26-item CORSI factors and related variables

All correlations significant at p < .01. Results are derived from the undergraduate EFA sample. CORSI, Covert and Overt Reassurance Seeking Inventory; O-G, Overt General Threat RS; C-GA, Covert General Threat Active RS; C-GP, Covert General Threat Passive RS; O-SR, Overt Social/Relational Threat RS; C-SR, Covert Social/Relational Threat RS; BDI, Beck Depression Inventory – second edition Total score; BAI, Beck Anxiety Inventory Total score; VOCI, Vancouver Obsessive Compulsive Inventory Total score; IUS, Intolerance of Uncertainty Scale Total score; RSES, Rosenberg Self Esteem Scale.
Internal consistency
Within the collapsed clinical sample, internal consistency was good for the C-SR (α = .88) and O-G factors (α = .90), fair for the C-GP (α = .72), C-GA (α = .67) and O-SR factors (α = .70), and excellent for the overall 26-item measure (α = .93). In the undergraduate sample, internal consistency was good for the C-SR (α = .89) and O-G (α = .90) factors, fair for the C-GP (α = .77), C-GA (α = .75) and O-SR factors (α = .78), and excellent for the 26-item scale (α = .93). Using Haberman’s (Reference Haberman2008) procedure to estimate the proportional reduction in mean squared error based on total scores (PRMSEtot), the values obtained for PRMSEtot based on the undergraduate sample were .87 for O-G, .66 for O-SR, .83 for C-SR, .63 for C-GP and .36 for C-GA, which are lesser than the internal consistency scores and thus indicate that the inclusion of subscales separate from the total score is warranted (see also Reise et al., Reference Reise, Bonifay and Haviland2013).
Convergent validity
For the O-G, C-GA and C-GP factors, which reflect traditional conceptions of anxious/obsessive RS, convergent validity was assessed using the EFA sample by comparing correlations between the factors and the VOCI (Thordarson et al., Reference Thordarson, Radomsky, Rachman, Shafran, Sawchuk and Hakstian2004) and BAI (Beck and Steer, Reference Beck and Steer1993), where positive correlations indicate convergent validity (Hinkin, Reference Hinkin1988). The O-G factor correlated moderately strongly with the VOCI (r = .65, p < .001), as well as with the BAI (r = .49, p < .001); the C-GA factor correlated positively though weakly with the VOCI (r = .28, p < .001) and BAI (r = .17, p < .001); the C-GP correlated strongly and positively with the VOCI (r = .60, p < .001) and BAI (r = .37, p < .001). For the O-SR and C-SR factors, which most strongly reflect depressotypic RS, convergent validity was assessed with the BDI-II (Beck et al., Reference Beck, Steer and Brown1996). The O-SR and C-SR factors correlated moderately strongly with the BDI-II (r = .41 and .49, p < .001). Please refer to Table 5 for correlations between the CORSI and IUS, which was used as an additional measure of concurrent validity.
Divergent validity
Divergent validity was calculated by examining correlations between the CORSI and RSES (Rosenberg, Reference Rosenberg1965), based on theorized negative relations between RS and self-esteem. Results using the EFA sample showed low to moderate negative correlations between RSES and CORSI total score (r = –.43, p < .001), O-G factor score (r = –.42, p < .001), C-GP factor score (r = –.23, p < .001), C-GA factor score (r = –.16, p < .001), O-SR factor score (r = –.32, p < .001) and C-SR factor score (r = –.42, p < .001).
To assess whether the correlations were significantly different between convergent and divergent measures, a series of tests for the difference between dependent correlations were conducted (Lee and Preacher, Reference Lee and Preacher2013; Steiger, Reference Steiger1980). Results using the EFA sample demonstrated significant differences in the values between each of the factors for convergent and divergent measures (z = 5.83 to 22.58, p < .001), suggesting that there are significantly stronger associations between the CORSI and the convergent measures than with the divergent measures.
Known groups validity
Next, t-tests were used to compare the scores of individuals with OCD, anxiety disorders and depression, respectively, to those of the undergraduates (Hattie and Cooksey, Reference Hattie and Cooksey1984). In cases when equal variance could not be assumed based on Levene’s test, corrected estimates were used.
When comparing individuals with primary OCD to undergraduates, there were significant group differences on CORSI total score [t (51.79) = 3.92, p < .001, d = .659], O-G [t (51.78) = 3.49, p = .001, d = .586], C-GP [t (51.26) = 4.89, p < .001, d = .845], O-SR [t (51.57) = 4.02, p < .001, d = .687], C-SR [t (53.06) = 3.11, p < .001, d = .493] factors, and a trend for the C-GA factor [t (861) = 1.82, p = .069, d = .259]. When comparing individuals with primary anxiety disorders with undergraduates, there were significant differences on CORSI total [t (65.89) = 5.84, p < .001, d = .824], O-G [t (65.16) = 4.82, p < .001, d = .694], C-GP [t (871) = 4.17, p < .001, d = .520], C-GA [t (871) = 2.05, p = .041, d = .276], O-SR [t (62.71) = 4.55, p < .001, d = .707] and C-SR [t (65.15) = 5.62, p < .001, d = .809] factors. Results also showed group differences between individuals with primary depression and undergraduates on the CORSI total score [t (840) = 2.01, p < .001, d = .947], O-SR [t (29.14) = 2.97, p = .006, d = .631], C-SR [t (840) = 5.04, p < .001, d = .867], O-G [t (29.11) = 4.20, p < .001, d = .893] and C-GP [t (840) = 2.94, p = .003, d = .523] factors, but was not significant for C-GA [t (840) = 1.19, p = .235, d = .241].
When examining profiles of scores between clinical groups, there was a significant difference between the OCD and anxiety disorders groups on the C-GP factor [t (86.39) = 2.11, p = .038, d = .409] only; there was also a trend towards a difference on this factor between the OCD and depression groups [t (74.66) = 1.89, p = .063, d = .279]. There were no statistically significant differences between the anxiety disorder and depression groups on the total or any factor scores. Please refer to Table 4 for clinical groups’ descriptive statistics.
Part B. CFA
Subsequent to the EFA and in line with best practices (Martin and Savage-McGlynn, Reference Martin and Savage-McGlynn2013), a CFA with maximum likelihood estimation was conducted with the remaining undergraduate data (n = 813) using AMOS 23.0.0.
For the initial, unmodified model, inspection of the fit indicates showed χ2 (289) = 1532.467, p < .001, although chi-square is influenced by sample size such that large samples often yield a significant result. For the unmodified initial model, the goodness of fit index (GFI) = .865, comparative fit index (CFI) = .880, Tucker–Lewis index (TLI) = .865 and root mean square error approximation (RMSEA) = .073, which indicated that the unmodified model did not fit the data sufficiently (Bentler, Reference Bentler1990; Bentler and Bonett, Reference Bentler and Bonett1980; Hooper et al., Reference Hooper, Coughlan and Mullen2008; Hu and Bentler, Reference Hu and Bentler1999; Schreiber et al., Reference Schreiber, Nora, Stage, Barlow and King2006; Steiger, Reference Steiger2007; Steiger and Lind, Reference Steiger and Lind1980; Tucker and Lewis, Reference Tucker and Lewis1973).
Given the conceptual overlap in elements of the CORSI items, modification indices of the covariance matrix were considered to identify whether adding theoretically appropriate covariances between error terms improved model fit. Four covariances were deemed appropriate for addition. Following the addition of the four covariances, the model fit chi-square value was improved to χ2 (285) = 1136.143 (χ2/d.f. = 3.986), p < .001. With the modifications added, the GFI = .897, CFI = .918, TLI = .907 and RMSEA = .061, indicating overall good fit. Please see Fig. 1 for the model estimates.

Figure 1. Confirmatory factor analysis model for the five-factor CORSI using the 26 highest-loading items, including four added covariances. Model shown with standardized parameter estimates.
Discussion
This paper presented the psychometric analyses of a novel measure of RS, the CORSI. The measure assesses major domains of general and social/relational threat-related RS that are seen across disorders. More importantly, the measure assesses overt and covert styles of seeking reassurance. Until now, covert RS has been largely neglected in the literature despite being a maintaining factor in various mental disorders and a potential obstacle to improvement following therapy if left unaddressed. Undergraduate samples were used for the EFA and CFA, and a clinical sample including individuals with OCD, depression and anxiety disorders was obtained for preliminary examination of clinical profiles.
Inspection of fit indices from the EFA, as well as clinical knowledge and theories of RS, were considered in the ultimate selection of the five-factor model. The final 26-item CORSI accounts for a large proportion of variance, with good convergent and divergent validity. The CFA suggests that the model fit well after only minor, theoretically appropriate modifications. This lends confidence to the underlying factor structure and suggests that the CORSI is a robust measure of covert and overt, general threat- and social/relational threat-related RS.
Given that the CORSI was constructed to assess overt and covert, general- and social/relational threat-related in-person RS, the division of the anticipated covert, general threat-related RS factor into two distinct factors was unexpected. Here, the large sample size may have been advantageous as it allowed an active form (C-GA factor) to be differentiated from a passive form (C-GP) of covert, general threat-related RS. Upon inspection of the item content, the C-GA factor identifies individuals who are willing to ‘start and stop’ an activity and thus gain reassurance by the absence of others’ objections to the person continuing the activity. An example of this type of RS would be an individual picking up a knife while subtly checking that their partner does not look nervous. This is in accordance with theory of how covert RS may function (Rachman and Hodgson, Reference Rachman and Hodgson1980). Conversely, the C-GP factor corresponds to a ‘wait and see’ form of RS, wherein someone gains reassurance of safety (etc.) by observing someone else acting before they are willing to do so themselves. An example of this would be an individual who will not eat until after their partner, to feel safe. As the C-GP was the only factor wherein individuals with primary OCD had a higher score than the depressed or anxious clinical groups, it would be intriguing to examine with future research whether C-GP RS relates to obsessional doubt or slowness more strongly than other facets of OCD, and what factors allow a person to feel reassured when they use C-GP RS compared with more active styles. Clinically, one may also hypothesize that individuals who engage in significant C-GP RS may be engaging in other forms of avoidance, more so than clients who are willing to engage with a situation and then seek reassurance (C-GA), which could have a negative effect on engagement with therapy exercises. The present study’s specific focus on covert RS behaviour and inclusion of items tapping different aspects of the behaviour probably allowed these distinctions in covert RS to come to light for the first time, and opens an opportunity for future researchers to examine associations between forms of covert RS and treatment processes.
The CORSI successfully differentiated undergraduate from clinical groups, and there were no significant clinical group differences in total or factor scores, except for the C-GP factor as previously noted. These findings indicate that the CORSI may have utility as a measure of problematic RS across disorders. Examining RS across disorders may allow clinicians and researchers to identify additional similarities in functions and consequences. For instance, low self-confidence and difficulty making decisions are characteristic symptoms of depression, but would logically relate to problematic RS across disorders. Indeed, it is possible that certain core fears in depression, for instance that one is incompetent/worthless (e.g. Beck, Reference Beck1976), may only be ‘checked’ by seeking reassurance from others, thus leading individuals to seek reassurance about both general and relational threats. Furthermore, it is unsurprising that RS about general threats would be pervasive in anxiety disorders, as RS has previously been noted as a common behaviour in disorders including GAD (e.g. American Psychiatric Association, 2013).
Previous research highlighted differences in RS motivations between depression and OCD, but the collective findings now suggest that there is significant overlap in why people seek reassurance across disorders (Cougle et al., Reference Cougle, Fitch, Fincham, Riccardi, Keough and Timpano2012; Parrish and Radomsky, Reference Parrish and Radomsky2010; Rector et al., Reference Rector, Kamkar, Cassin, Ayearst and Laposa2011). Furthermore, these findings suggest that the CORSI may have utility in identifying transdiagnostic aspects of problematic RS, particularly if future research validates its use with larger clinical samples.
Limitations and future directions
In future, the CORSI would benefit from re-test analyses to establish its temporal stability. While the large sample size for the EFA and CFA lend confidence to the interpretation of the CORSI’s structure, the clinical sample was insufficiently large to conduct factor analysis. Factors were labelled by the first and second authors to reflect major themes represented by the items within each; however, it is worth noting that factor labels are also subjective (e.g. Field, Reference Field2009). The age distribution of the undergraduate versus clinical samples was also significantly different, with the undergraduates being younger and including a higher proportion of females. It would be informative to run another CFA in a larger clinical sample to solidify that the factor structure is replicable, as well as to ensure that the current results are developmentally appropriate for adults varying in age.
Comments about RS behaviour from individuals engaging in problematic RS and their partners were considered throughout the development process, yet direct consultation meetings with people with lived experience were not included in the research design process. It would be highly valuable to engage in such discussions in future as a means of further establishing validity. Doing so could also help elucidate whether the present version of the CORSI would benefit from any item restructuring or addition of any items to further highlight RS in disorders such as panic and specific phobia. Moreover, as the CFA was conducted on a sample that had completed the 30-item version, it would be pertinent to re-run the CFA within novel samples using the 26-item CORSI to gain further confidence of the factor structure’s robustness. Further, a potential strength as well as limitation of the current study was the choice to allow co-morbidities in the clinical groups, as it was felt that this best reflects individuals who present to clinical settings and thus maximizes ecological validity. Nonetheless, it would be informative for a future study to replicate the analyses with diagnostically pure samples, to demonstrate whether the factor structure remains stable. As previously noted, the TRSS (Cougle et al., Reference Cougle, Fitch, Fincham, Riccardi, Keough and Timpano2012), RSS (Rector et al., Reference Rector, Kamkar, Cassin, Ayearst and Laposa2011) and ReSQ (Kobori and Salkovskis, Reference Kobori and Salkovskis2013) were each published after the current study was underway, and were thus not available for inclusion in validation analyses. An informative next step would therefore be to include these measures in convergent validity analyses of the CORSI’s psychometric properties.
Broadly, the CORSI focuses on only in-person RS, although RS may also be sought via methods that do not include in-person contact (e.g. repetitively researching information about a medical condition online; seeking reassurance via websites such as Facebook; e.g. Clerkin et al., Reference Clerkin, Smith and Hames2013; Starcevic and Berle, Reference Starcevic and Berle2013). It may be informative for researchers in future to further examine whether RS from sources other than in-person contact is similarly transdiagnostic, or whether it is primarily reflected in health-related and social anxieties.
The present findings suggest that RS about social/relational threats is prevalent across disorders. Given that there is some research suggesting that RS in depression is related to attachment anxiety (Evraire et al., Reference Evraire, Ludmer and Dozois2014; Shaver et al., Reference Shaver, Schachner and Mikulincer2005), which would be logically related to social/relational threat RS, it would be interesting for future research to examine this potential association. Additionally, researchers are increasingly in agreement that intolerance of uncertainty is a cognitive bias evidenced in anxiety disorders, depression and OCD (e.g. Carleton et al., Reference Carleton, Mulvogue, Thibodeau, McCabe, Antony and Asmundson2012; Dugas et al., Reference Dugas, Freeston and Ladouceur1997; Tolin et al., Reference Tolin, Abramowitz, Brigidi and Foa2003). The findings from the present study suggest that intolerance of uncertainty and RS are highly related, which suggests that it would be a transdiagnostic mechanism worthy of future study to allow researchers to better understand cognitive underpinnings of RS.
Conclusions
The 26-item CORSI provides an efficient, comprehensive measure of overt and covert, general threat and social/relational threat RS. The CORSI is freely available for public use (see Appendix), and distinguishes individuals with OCD, anxiety disorders or depression from undergraduates. The measure seems effective in identifying problematic RS across disorders, which may in turn increase the CORSI’s potential utility in clinical practice, but needs further study in clinical samples. Better identifying RS across disorders could improve our knowledge of the behaviour, and ultimately assist clinicians to better help clients reduce problematic RS behaviour.
Acknowledgements
The authors would like to acknowledge Kevin Barber, Dr Michel Dugas and Dr Hannah Levy for their contributions to this study.
Financial support
This research was supported by a Canadian Institutes of Health Research (CIHR) Operating Grant (MOP 102552) awarded to the first author.
Conflicts of interest
The authors have no conflicts of interest with respect to this publication.
Ethics statements
All authors have abided by the Canadian Code of Ethics for Psychologists as set out by the Canadian Psychological Association (CPA) and by the Tri-Council Policy Statement: Ethical Conduct for Research Involving Humans, which are comparable to the Ethical Principles of Psychologists and Code of Conduct of the BABCP and BPS.
Appendix A. Covert and Overt Reassurance Seeking Inventory (CORSI)
Please rate each statement by putting a circle around the number that best describes how much the statement is true of you. Please answer every item, without spending too much time on any particular item.
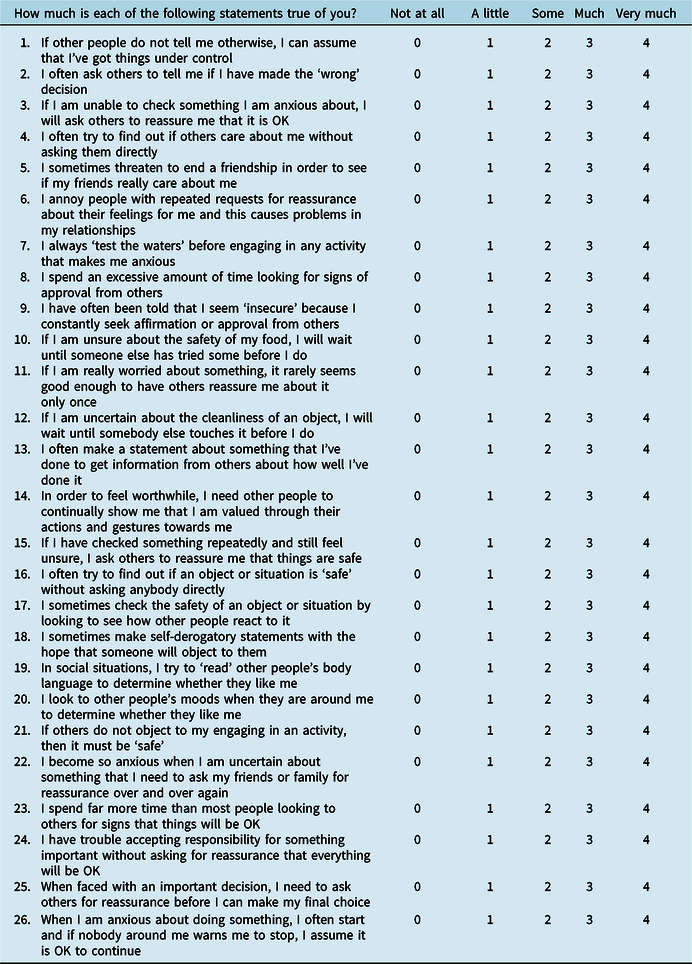
Scoring Information for the Covert and Overt Reassurance Seeking Inventory (CORSI):
To obtain an overall TOTAL score: Sum all responses.
To obtain FACTOR scores, sum each of the responses for the items comprising the five CORSI factors:
1) Overt Social/Relational threat (O-SR): items 5, 6, 9
2) Covert Social/Relational threat (C-SR): items 4, 8, 13, 14, 18, 19, 20
3) Overt General threat (O-G): items 2, 3, 11, 15, 22, 23, 24, 25
4) Covert General threat – Active (C-GA): items 1, 16, 21, 26
5) Covert General threat – Passive (C-GP): items 7, 10, 12, 17


Comments
No Comments have been published for this article.