High-quality early childhood education and care (ECEC) comprising child care and preschool services should be accessible to every child because of the longer-term impact of early years’ experience on developmental outcomes, school readiness, physical and emotional wellbeing, and participation in the community (Australian Institute of Health and Welfare [AIHW], 2020; Commonwealth of Australia, 2019). Three in five Australian children aged under 4 years (approximately 925,900 children) received either regulated or non-regulated forms of childcare in 2017 (AIHW, 2020). Approximately 90% of eligible children (nearly 296,000 children) attended a preschool program either in long day care centres or standalone facilities prior to their compulsory full-time schooling in 2017 (AIHW, 2020). Frameworks such as the Early Years Learning Framework, which provides principles, practices, and outcomes that promote the learning of children, and the National Quality Framework, guide and promote quality ECEC in Australia (AIHW, 2020).
Almost one in five Australian children have additional needs or require further medical, physical, behavioural, emotional, and/or cognitive assessments in the first year of their full-time schooling (Commonwealth of Australia, 2019). In 2013, approximately 2.9% of children across all Australian ECEC services (children birth to 5 years) were identified as having a disability and, in 2012, 5.1% of children in preschools (children 3 to 5 years) across Australia were estimated to have a disability (Productivity Commission, 2014). Although these figures indicate that children with disabilities are underrepresented in ECEC services (Productivity Commission, 2014), they do suggest that ECEC services need to cater for children with a range of abilities. For example, New South Wales (NSW) data indicate that 85% of educators in community preschools work with children with disabilities (Centre for Education Statistics and Evaluation, 2014). These data highlight the important role of early childhood educators in ensuring that children with disabilities and other additional learning needs are not only included in early childhood settings but also develop to their maximum potential in these settings.
Successful inclusion requires more than merely placing children with disabilities into regular educational settings but involves the full participation of children to assist them to achieve their educational goals (Irvin et al., Reference Irvin, Crutchfield, Greenwood, Simpson, Sangwan and Hansen2017; Odom, Buysse, & Soukakou, Reference Odom, Buysse and Soukakou2011). Two peak Australian bodies, Early Childhood Education (ECA) and Early Childhood Intervention Australia (ECIA), support early childhood inclusion, recognising its potential to improve developmental outcomes for every child — those with and without disabilities or additional learning needs (Early Childhood Australia and Early Childhood Intervention Australia, 2012). The ECA Code of Ethics for early childhood professionals reflects the provision of inclusive environments and a meaningful curriculum as well as the importance of decision-making, planning, and assessment practices regarding children’s learning, development, and wellbeing in partnership with their families (ECA, 2016).
In the United States (US), the use of scientific research to assist with decisions regarding education programs and classroom instruction is mandated by the Individuals With Disabilities Education Improvement Act (Ledford et al., Reference Ledford, Barton, Hardy, Elam, Seabolt, Shanks and Kaiser2016). The US Division for Early Childhood of the Council for Exceptional Children recommends the use of data for goal identification, activity planning, and progress monitoring for children with additional needs (Division for Early Childhood, 2014). This recommendation highlights the importance of the effective use of data when programming for children with disabilities or additional needs. Although the Australian Disability Discrimination Act 1992 (Australian Government, 1992, amended 2018) protects the rights of individuals with disability, there is no specific Australian legislation mandating the use of scientific research to guide instructional decision-making. However, evidence-based instructional principles are reflected in guidelines provided by peak bodies such as ECA and ECIA (ECA Code of Ethics, 2016; ECIA National Guidelines, 2016) and are supported by the national framework (Early Years Learning Framework; Department of Education, Employment and Workplace Relations [DEEWR], 2010).
Even interventions with a strong evidence base will not work for every child in every setting (Cook & Odom, Reference Cook and Odom2013); therefore, ongoing data collection is needed to determine if practices are effective and to allow modifications where appropriate (Ledford et al., Reference Ledford, Barton, Hardy, Elam, Seabolt, Shanks and Kaiser2016). Evidence for a causal link between data-based instruction and positive learning outcomes for children with additional needs is emerging (Carter, Stephenson, & Carlon, Reference Carter, Stephenson and Carlon2020). Data can provide educators with information on ways a child responds to teaching approaches, such as universal design for learning and differentiated teaching. Data use is, therefore, a central component when implementing evidence-based practice (Ruble, McGrew, Wong, & Missall, Reference Ruble, McGrew, Wong and Missall2018), especially for children with additional needs, and it is central to high-quality inclusive practice (Love, Horn, & An, Reference Love, Horn and An2019).
Ongoing data collection can also be used to monitor a child’s rate of progress towards an individualised goal (Ledford et al., Reference Ledford, Barton, Hardy, Elam, Seabolt, Shanks and Kaiser2016; Sandall, Schwartz, & Lacroix, Reference Sandall, Schwartz and Lacroix2004; Thomas & Marvin, Reference Thomas and Marvin2016). Monitoring is considered an important component of the provision of quality early childhood services for all children, regardless of the level of their needs. The implementation of an ongoing cycle of assessment and planning for each child’s learning is one key element that is included in the Australian National Quality Standard (NQS 1.3.1) for the provision of high-quality ECEC and after-school-hours care (Australian Children’s Education & Care Quality Authority [ACECQA], 2018a). This element allows educators to purposefully assist children’s learning and development (ACECQA, 2016b). It also enables educators to identify children who require additional support, monitor progress of children towards their goals, evaluate the opportunities for learning, and make instructional decisions and communicate progress (DEEWR, 2010). The inclusion of this element in the NQS means that effective data use is seen as one indicator of program and service quality in Australia. Clearly, therefore, the effective use of data for instructional decision-making is increasingly expected of early childhood professionals for quality service provision (Irvin, Crutchfield, Greenwood, Kearns, & Buzhardt, Reference Irvin, Crutchfield, Greenwood, Kearns and Buzhardt2018; Ledford et al., Reference Ledford, Barton, Hardy, Elam, Seabolt, Shanks and Kaiser2016).
NQS data reported in 2016 demonstrated that 52% of services failing to meet the national standard (i.e., scoring at the level of ‘Significant Improvement Required’, ‘Working Towards’) were rated ‘not met’ for the use of information related to individual children’s learning and development for planning, documentation, and evaluation (ACECQA, 2016a). NQS data from 2017 have revealed that approximately 30% of services did not show improvement in the area relating to educational programs and practice and the area relating to leadership and service management at reassessment (ACECQA, 2018b). These areas include a component (1.3.1 and 7.2.2) relating to an ongoing evaluation, planning, and implementation cycle of children’s learning (ACECQA, 2018a). These data indicate that some providers are struggling to implement data-informed practice.
There has been limited research on data collection in the context of early childhood services. An earlier study conducted in the US by Sandall et al. (Reference Sandall, Schwartz and Lacroix2004) involved early childhood special education teachers, educational assistants, speech pathologists, and occupational therapists. These researchers identified challenges related to data practice such as lack of time, skill, and data management. Special education classroom teachers who participated in a more recent study perceived data collection as important and that data would help students to achieve individual education program (IEP) goals (Ruble et al., Reference Ruble, McGrew, Wong and Missall2018). Teachers also reported that unclear measurement systems were a greater barrier to timely data collection than time or student numbers (Ruble et al., Reference Ruble, McGrew, Wong and Missall2018). In a study by Brawley and Stormont (Reference Brawley and Stormont2014), early childhood teachers were generally found to perceive data-informed practice as important but the reported frequency of such practice was not high.
It appears that there has been consensus for the importance and usefulness of data for instructional decision-making but practitioners and leaders find the implementation challenging (Love et al., Reference Love, Horn and An2019; Schildkamp, Ehren, & Lai, Reference Schildkamp, Ehren and Lai2012). Existing studies (Brawley & Stormont, Reference Brawley and Stormont2014; Sandall et al., Reference Sandall, Schwartz and Lacroix2004) were conducted in a small number of programs in the US; hence the findings cannot necessarily be generalised to the Australian context. It is, therefore, important to understand current Australian early childhood teachers’ data-related practice, specifically the types of data collected, the use of the data, and possible barriers to data-informed practice. The aim of this study was to contribute to a better understanding of Australian early childhood teachers’ perspectives about data collection and data use for children with additional needs. For the purpose of this paper, children with additional needs include both children with disabilities or those at risk of disability or delay. The research questions were as follows:
-
1. What type of data do early childhood educators collect in Australia?
-
2. Are there any differences in the types of data collected for typically developing children and children with additional needs?
-
3. For children with additional needs, how often and why are the data collected?
-
4. Are early childhood educators confident in their ability to collect data for children with additional needs?
-
5. What barriers to data collection are reported by early childhood educators?
Method
Ethics
Approval to conduct the study was obtained from Macquarie University Human Research Ethics Committee (Reference Number 5201800295) prior to data collection.
Research Design
This was a descriptive study using an online survey of early childhood educators. Both quantitative and open-ended responses were collected. A copy of the questionnaire may be obtained from the first author on request.
Participants
The target participant group was early childhood educators who were involved in developing educational plans in ECEC centres in Australia. A total of 134 responses were received. Some respondents (n = 29) only answered demographic questions; therefore, these were excluded from the analysis. As a result, 105 early childhood educators’ responses were included. Table 1 provides demographic characteristics of survey respondents. All except for one indicated that they had a qualification in early childhood, and only four respondents (3.8%) reported that they had a qualification in special education. Approximately a quarter of participants had a qualification below bachelor level.
Table 1. Demographic Characteristics of Respondents

Note. Percentages are rounded to one decimal place. Percentage of resident population was calculated using the following formula: the sum of estimated resident population for the eight states, divided by each state, multiplied by 100.
The mean reported age of respondents was 43.5 years (range: 26–60). The mean length of work experience was 18.2 years. Approximately half the responses were from NSW. When compared with the distribution of the estimated resident population across these states, the number of responses from NSW and the Australian Capital Territory was higher, whereas the numbers from Queensland and Western Australia were lower in the survey cohort (Australian Bureau of Statistics, 2018). Just over half of respondents indicated that their centre location was in a metropolitan area. The age of the early childhood group ranged from birth to 6 years.
Measure
An online questionnaire was constructed and made available via the Qualtrics platform. The questionnaire consisted of a total of 24 items that included multiple choice, rating scales, and open-ended questions. The initial items requested information on the demographic background of respondents and the early childhood centres and groups with which they worked. These were followed by questions about data practice including type of data collected for children with and without additional needs. The information provided in the questionnaire specified that data written or permanently recorded were of interest to the researchers. Multiple-choice questions probed (a) data types collected for children with and without additional needs, and (b) fluency, purpose, usefulness, and confidence in collecting each data type for children with additional needs. A 5-point Likert-type scale (strongly disagree to strongly agree) was used to rate statements related to perceptions of data collection and data use, and an open-ended question was used to solicit comments related to the challenges of data collection and data use. A pilot questionnaire was then prepared that included five additional questions at the end of the questionnaire to elicit feedback on the questionnaire, including (a) the amount of time that was taken to complete the questionnaire, (b) whether the meaning of the questions was clear, (c) the appropriateness of the answer options, (d) technical issues, and (e) general comments. Two early childhood educators completed the pilot questionnaire. Minor adjustments were made based on the feedback before the questionnaire was finalised.
Procedures
The questionnaire was advertised through the ECA online newsletter and a social media community group for Australian early childhood educators. Participants completed the survey anonymously. Participants did not receive any remuneration for their participation, but they were offered the opportunity to enter a draw for two A$100 gift vouchers following the completion of the survey. The questionnaire was open for 4 months, from August to November 2018.
Results
Participant Experience in Supporting Children With Additional Needs
The majority (78.1%) of the respondents had children with additional needs in their group at the time they were completing the survey, and 18.1% of the respondents had children with additional needs in the past. Four respondents (3.8%) indicated that they had never had a child with additional needs in their group. The majority of the respondents (83.8%) indicated that they had attended a professional learning course about supporting children with additional needs. Of the 85 open-ended responses provided, 47 (55.3%) related to autism spectrum disorder, the most frequently referenced type of disability.
The majority (85.1%) of the respondents who had children with diagnosed disabilities in their group (or centre) reported that the children with disabilities had an IEP or similar, whereas 11.9% of the respondents reported that the children with disabilities in their group did not. Approximately one quarter of the respondents who had children with diagnosed disabilities reported that they had no support staff and the remainder indicated that support was available when children with disabilities attended their centres.
Type of Data Collected
Table 2 presents the types of data that early childhood educators reported that they collected for children with and without additional needs. Four respondents did not indicate any data types. The vast majority of the respondents reported that they collect anecdotal written records such as journals, photos, and work samples for both children with and without additional needs. The number of responses for which ‘other’ was nominated was almost 4 times more for children with additional needs than for those without. Examples of ‘other’ responses for children without additional needs included information from families, parent/children’s goals, and medical information. For children with additional needs, examples included information from families, communication books, medical or specialist reports, individual family service plans, IEPs and reported progress towards the IEP goals, and a developmental screening questionnaire.
Table 2. Data Types Collected for Children With and Without Disabilities or Additional Needs (N = 105)

Note. Four respondents did not indicate any data collection type. Percentage indicates the percentage of respondents who reported the use of the data type.
McNemar tests were used to examine data on differences between use of data for children with and without additional needs. Results of the tests revealed that there were no significant differences in the types of data collected between children with and without additional needs except for counted or timed behaviours, χ2(N = 105) = 22.7, p < .001 (see Table 2). The difference for counted or timed data was highly significant, with greater use for children with additional needs.
Frequency of Data Collected for Children With Additional Needs
Respondents reported the frequency of data collection for children with additional needs across different types of data using the following frequency options: more than once a week, once a week, once every term, every 6 months, annually, and other. Some respondents did not answer this question. A total of 444 responses were received across data type. Of these responses, 89 were other. Given that a substantial proportion of respondents indicated other (20.0%), these data were further examined. Of the 89 responses, 41 responses indicated frequencies that did not correspond to one of the frequency categories included in the questionnaire (i.e., more than once a week, once a week, once every term, every 6 months, and annually). These responses were assigned to the next most frequent category for the purposes of analysis (e.g., once or twice a term was assigned to once every term). There were 48 responses that did not specify frequency of data collection (e.g., ‘as needed’). These were treated as missing data. Responses that indicated data of a particular type were not collected were assigned to never.
Table 3 presents the frequency of data collection for children with additional needs across different types of data using the reclassified categories. Photos were the most frequent data type collected followed by anecdotal written records. These data were collected once a week or more by 79% and 75.2% of respondents respectively. Approximately one third of the respondents indicated that they used checklists once every term or biannually. One in five respondents reported that they collected data on counted or timed behaviours more than once a week, and just under 20% of the respondents did not provide a specific response (e.g., responded ‘as needed’) to their use of this data type. The use of video data was reported by 46.7% of respondents, checklists by 41.9%, and counted or timed behaviours by only 35.2% of respondents.
Table 3. Frequency of Data Collection Across Data Types (Reclassified) (N = 105)

Note. Percentages are calculated by the number of cases divided by 105, multiplied by 100, and rounded to one decimal place.
A Friedman two-way analysis of variance (Stricker, Reference Stricker2008) was conducted including the reclassified data based on a subset of 64 responses provided by participants who provided usable responses for all data types, to determine whether participants ranked data collection strategies differently. Because the analysis revealed that there were significant differences in the rankings of data collection types, χ2(5, N = 64) = 156.9, p < .001, Conover post hoc comparisons (Stricker, Reference Stricker2008) were completed. Mean rankings were 5.03 for photos, 4.74 for anecdotal records, 3.48 for work samples, 2.98 for counted or timed behaviours, 2.39 for video, and 2.37 for checklists. The results of paired comparisons and mean ranking differences between data collection strategies are presented in Table 4. All differences were significant except for the difference between photos and anecdotal as well as the differences between video and checklists.
Table 4. Friedman Post Hoc Analysis Mean Ranking Differences Between Data Collection Strategies

*p < .05. **p < .01. ***p < .001.
Use of Data
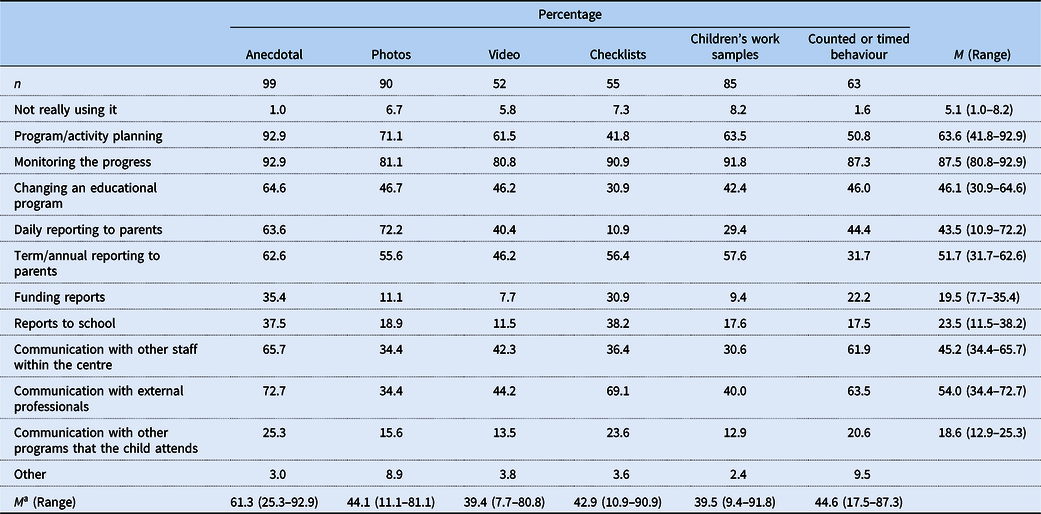
The way that educators reported using data across type is presented in Table 5. The percentages were calculated by dividing the number of responses by a total number of respondents who indicated using the data type and multiplying by 100. Progress monitoring was reported by the highest percentage of respondents, consistently across data type (M = 87.5%, range: 80.8–92.9%). Program/activity planning was also indicated by a relatively high percentage of respondents, especially among anecdotal and photo users, but this was somewhat less consistent across data type, indicated by a much wider range (M = 63.6%, range: 41.8–92.9%). Communication with external professionals and term/annual reporting to parents were reported by approximately half the users but were inconsistent across data type. Communication with other programs that the child attends (M = 18.6%, range: 12.9–25.3%) was indicated by the lowest percentage of respondents across data type, followed by funding reports (M = 19.5%, range: 7.7–35.4%). Reporting to schools was also low across data type (M = 19.5%, range: 11.5–38.2%). A very small proportion of respondents reported that they were ‘not really using’ the data that they collected (M = 5.1%, range: 1.0–8.2%).
Table 5. Use of Data
Note. Percentages were calculated by the number of responses, divided by the total number of respondents who reported using the data type, multiplied by 100. Percentages are rounded to one decimal place.
a The mean score per data type included data reported to be used (i.e., excluded not really using it and other).
With regard to reporting to parents, all data types except for counted or timed behaviour were indicated consistently by approximately half the users of each data type for term/annual reporting, while there was a much larger range across data types for daily reporting, indicated by relatively high percentages of photo (72.2%) and anecdotal (63.6%) users and a low percentage (10.9%) for checklist users.
Anecdotal written records resulted in the widest range of use by data collectors (M = 61.3%, range: 25.3–92.9%). Photos were also used for progress monitoring and program/activity planning. Counted or timed behaviours were used mostly for progress monitoring (87.3%), but also used for communication with external professionals (63.5%), internal staff (61.9%), and program/activity planning (50.8%).
Usefulness of Data
Figure 1 provides a summary of perceived usefulness of each data type in assisting educators to make an instructional decision or modify the program for children with additional needs. The majority of the anecdotal written record users (82.8%) and counted or timed data users (76.2%) reported the data types that they gathered to be either extremely or very useful. For the rest of the data types, the percentage of the users who found them to be either extremely or very useful remained just over 60%. A small proportion of users of each data type, except for checklist users, felt that the data type that they collected was not very useful for instructional decision-making or program modification for children with additional needs.

Figure 1. Usefulness of Data. There were no responses for Not at all useful.
Confidence in Data Collection
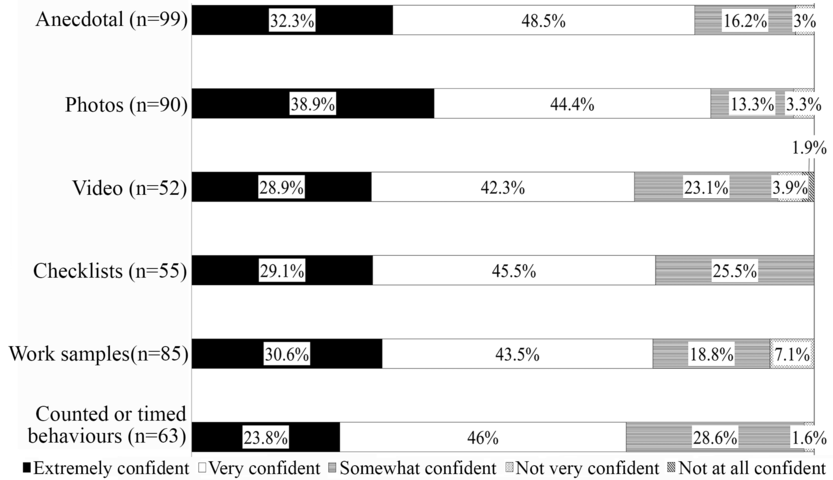
Figure 2 presents the level of confidence in using types of data to increase the participation of children with additional needs. More than 70% of users of each data type felt confident with the data types that they collected. A small proportion of users of each data type, except for checklist users, reported that they were not confident in using data type to increase the participation of children with additional needs.

Figure 2. Confidence in Data Collection. Only responses for Not at all confident were for video (1.9%).
Challenges
Data on reported challenges are presented in Table 6. The majority (86.8%) of the respondents indicated limited time as a challenge. Limited resources (staffing) was also frequently indicated. A minority of respondents indicated the challenges to be (a) using information/data not seen as important (13.2%) or (b) high staff turnover (15.4%). Five of the 13 open-ended responses related to difficulty in utilising or acting on data.
Table 6. Challenges Related to Data Collection and Data Use (n = 91)

Note. Percentages are rounded to one decimal place.
Other Questions
Table 7 presents participant responses to the general questions on data collection. More than half of the respondents strongly agreed that using data improved their teaching practice and that data assisted communication with other staff and professionals. Approximately half the respondents agreed with the statements that they modified activities for children with additional needs based on data, and that data assisted communication with parents/caregivers. The majority (71.5%) of the survey respondents disagreed that collecting additional information/data for children with additional needs was discriminatory (inconsistent with inclusion), while 16.5% of the respondents agreed with the statement. It appears that a small number of respondents may have a belief that the concept of inclusion precludes or limits the provision of additional support services, including data collection. One respondent commented that ‘children with a disability have the same pedagogical documentation (data collection) as typically developing children so no discrimination, full and seamless inclusion …’.
Table 7. General Questions on Data Collection (n = 91)

Note. Percentages are rounded to one decimal place.
A number of other open-ended responses were provided (22 responses in total). Topics identified from these responses relate to (a) difficulty in making time to collect data (e.g., ‘There is never enough time to document behaviours, triggers and other information in real time or correctly because of distractions …’); (b) data irrelevant to practice (e.g., ‘… Inclusion happens on the floor by making minor adjustments throughout the day. It’s got nothing to do with data’); (c) importance/value of data collection (e.g., ‘collection of data very important to meet the individual needs of each child’. ‘Collecting data allows us to celebrate children’s achievements by showing the development of attainment of milestones’); and (d) the need for universal professional development to support educators including children in ECEC (‘The sector, children and parents would benefit if EC settings received universal professional development on identifying and supporting children with additional needs and their effective inclusion in EC settings’).
Discussion
Early childhood educators’ practices and perspectives about data collection for children with additional needs in Australia were explored in this study. The responses of survey participants indicated that Australian early childhood teachers collect predominantly anecdotal written records, photos, and children’s work samples for both children with and without additional needs. Findings indicated that the data types that teachers collect for children with and without additional needs are similar with only one exception: counted or timed behaviours. More teachers collect this type of behaviour data for children with additional needs than without. As children with additional needs often require more targeted interventions than those without in order to achieve the desired outcomes (e.g., increasing the amount of peer interactions, decreasing a challenging behaviour), this result is not surprising. Nevertheless, approximately one third of teachers do not collect either counted or timed behavioural data or checklist data for children with additional needs. These two types of data are often used as the basis for formative monitoring for children with additional needs and are likely to be useful for a wide range of children. Children with additional needs may require more regular, frequent, and closer monitoring because they are at greater risk of not making developmental gains than are children without additional needs.
With regard to the frequency of data that educators collect for children with additional needs, photos and anecdotal records were again the most frequently gathered data types, followed by children’s work samples. The findings have suggested that the majority of early childhood educators collect photo data more than once a week and anecdotal records once a week or more. The frequency of anecdotal data collection found in the current study is comparable (three quarters of the respondents collect anecdotal data weekly or more) to the Brawley and Stormont (Reference Brawley and Stormont2014) study that surveyed approximately 100 early childhood educators in Missouri, US (68%). The use of checklists reported in the current study is much less frequent (less than 10% reported checklist use once a week or more) than reported in the Brawley and Stormont research (52% of the respondents reported that they use checklists once a week or more).
More than three quarters of anecdotal and counted or timed data collectors perceived that the data they collect are useful for instructional decision-making and program modification for children with additional needs, with some variation in the level of perceived usefulness across data types. Progress monitoring was the most frequently reported purpose of data collection across data types followed by program/activity planning. Early childhood educators typically use anecdotal data and photo data for program/activity planning for children with additional needs as well as for daily reporting to parents. There was only a very small proportion of respondents who reported that the data gathered were not really being used.
It appears that practitioners are generally confident in using the data that they collect. A large-scale survey involving 1,467 special education teachers in the US found that more than 70% of respondents reported that they were very competent in using observational data, assessing IEP goals, providing formal assessments, and monitoring progress (Fowler, Coleman, & Bogdan, Reference Fowler, Coleman and Bogdan2019). In our study cohort, approximately 70% or higher of users of each data type rated themselves as extremely confident or very confident in utilising the data types that they were implementing to increase the participation of children with additional needs. Of interest is the degree of confidence that educators might have in the collection and use of data not reported to be collected (e.g., the degree of confidence in the use of counted or timed data among those who do not use this data type) as well as the actual competency in this data collection and use.
Not surprisingly, the findings have indicated that limited time and staffing are common barriers to data collection and use. Issues related to the availability of materials, management of data, and training and support are also a barrier for some educators. These challenges are consistent with the challenges identified in previous studies that were conducted in the US (Brawley & Stormont, Reference Brawley and Stormont2014; Sandall et al., Reference Sandall, Schwartz and Lacroix2004). A small proportion of educators also indicated challenges to include high staff turnover and the perception in their workplace that data use is unimportant.
The survey data have suggested that early childhood educators generally recognise the benefits of using data in their teaching and believe that data can assist when communicating with other professionals and caregivers. These findings are similar to what has been reported for US teachers (Brawley & Stormont, Reference Brawley and Stormont2014). The data have also indicated that the majority of educators value the use of data in their practice including guidance for modifying activities for children with additional needs. This is an encouraging finding because effective data use is the key to better outcomes for children, especially for those with additional needs (e.g., Carter et al., Reference Carter, Stephenson and Carlon2020; Cook & Odom, Reference Cook and Odom2013; Ledford et al., Reference Ledford, Barton, Hardy, Elam, Seabolt, Shanks and Kaiser2016) and central to inclusive practice (Love et al., Reference Love, Horn and An2019). The survey data have also indicated that a small proportion of educators do not perceive the collection and use of data to be beneficial, and believe that collecting additional data for children with additional needs is inconsistent with inclusion. A small number of responses indicated that there appears to be some misunderstanding of the concept of inclusion — that it precludes the provision of additional support services, including data collection, where this is needed. This is of concern as it suggests a failure to recognise that a key component of inclusive practice involves making adjustments to facilitate development, and this may include additional progress monitoring data (Love et al., Reference Love, Horn and An2019). In fact, failing to provide additional reasonable adjustments where they are needed, including additional data collection, would be inconsistent with inclusion and, in the Australian context, a possible breach of the Disability Discrimination Act 1992 (Australian Government, 1992, amended 2018). The data highlight the importance of both in-service and preservice training for educators in effective inclusive practice.
Anecdotal and photo data were the two dominant data types that Australian early childhood educators gather, followed by work samples. These types of data are qualitative in nature and, therefore, analysis and interpretation of the data can be time consuming, challenging, and less objective than quantitative data (New South Wales Government, 2019). Although there are benefits for qualitative data such as providing rich narratives (New South Wales Government, 2019), there remains an important role for quantitative data in educational decision-making (Carter et al., Reference Carter, Stephenson and Carlon2020). For example, if the child’s educational goal is to increase the amount of peer interaction, it is important to include a measure of the time that a child interacts with peers. This will assist in determining if an intervention has been effective or the goal has been achieved. Time sampling or duration measures would be useful for collecting these data (Hojnoski, Gischlar, & Missall, Reference Hojnoski, Gischlar and Missall2009). The question therefore arises as to how, or whether, these types of information (i.e., anecdotal records, photos, and work samples) could play a role in facilitating data-informed practice that assists the development of children with additional needs. Both quantitative and qualitative data have strengths and weaknesses, and both types require time and commitment to be collected systematically and rigorously in order to contribute to documenting and evaluating developmental progress in children with additional needs (Schwartz & Olswang, Reference Schwartz and Olswang1996). It is important to use both types of data using multiple sources that suit the purpose of data collection and the skills of interest (Schwartz & Olswang, Reference Schwartz and Olswang1996).
There are several limitations of this study. The data presented relied on respondents’ self-report and may not therefore reflect their actual practice. Next, participants were recruited through ECA newsletters and a social media network. Although participants were encouraged to pass the survey link to other educators, the survey respondents may be predominantly members of these communities; hence it is possible that they are not fully representative of Australian early childhood educators, although the ECA is the national peak body representing Australian early childhood. Also, educators who agreed to complete the questionnaire may be more likely to collect data than those who chose not to participate. The current study also relied on an online, indirect recruitment. A larger scale study that employs direct recruitment involving private early childhood organisations, councils, and the Department of Education in each state and territory may assist in increasing the number of responses. Conducting focus groups or interviews could also provide qualitative data, leading to a better understanding of how data are collected and used in early childhood settings.
Conclusion
Findings from the current study have suggested that the majority of early childhood educators in Australia value collecting data as part of their practice and are confident in using these data to meet the needs of children with additional needs. Anecdotal written records, photos, and work samples appear to be the main sources of information gathered and are used for progress monitoring and instructional decision-making. Educators collect similar types of data for children with and without additional needs, but significantly more educators gather counted or timed behaviour data for children with additional needs. Much of the data collected by early childhood educators was qualitative in nature, and there may be a case for the incorporation of more quantitative data collection. Resources that enable educators to collect and utilise data also need to be considered to assist effective early childhood inclusion.
Acknowledgements
The authors would like to thank the participants of this study, Early Childhood Australia for their assistance with participant recruitment, and the early childhood educators who provided feedback on the earlier version of the questionnaire.