

Reading plays a vital role in children’s academic success. Strong performance in reading and prereading measures predicts some later academic outcomes across a variety of points in development. For example, reading ability at age 7 predicts academic outcomes at age 16 (Anderson & Cheung, Reference Anderson and Cheung2003). Parental engagement in preliteracy activities at age 3 predicts early word reading at age 5 (Robert, Jurgens, & Burchinal, Reference Robert, Jurgens and Burchinal2005). Consequently, a desideratum of literacy research is to identify potential reading problems and to remediate them as early as possible in order to prevent the negative academic consequences of reading disability. Reading ability comprises many different skills. One of these is decoding, which is the process whereby readers associate a written form like cat with a phonological form like [kæt]. This skill is distinct from reading comprehension, which refers to the ability to deduce linguistically meaningful information from text. Studies of early reading ability generally focus on the former skill.
Longitudinal studies have found that explicit ability to flexibly manipulate and analyze the sound structure of language, a skill called phonological awareness, is among the strongest and most reliable early predictors of early reading ability, that is, decoding. This is true both concurrently and longitudinally, in studies that tracked how children’s phonological awareness at approximately 6 years of age predicts single-word reading at approximately 7.5 years of age (Bird, Bishop, & Freeman, Reference Bird, Bishop and Freeman1995; Rohl & Pratt, Reference Rohl and Pratt1995). Hence, understanding the nature of phonological awareness is of utmost importance in offsetting reading problems in children who are at risk for them.
In spoken languages, phonological awareness tasks require individuals to recognize that words comprise internal structural units, such as syllables, onsets, and rimes, and individual speech sounds (phones). Blending and elision are two of the most common tasks that have been used to evaluate phonological awareness among children. As described by McBride (Reference McBride2015), phonological awareness tasks vary along two dimensions.
The first dimension is the level of linguistic structure that must be accessed to complete the task successfully. For example, saying the word cowboy without the boy requires only that children recognize that the word cowboy is composed of two other known words, cow and boy. In contrast, saying the word spoon without the /p/ requires that children be able to interpret spoon as being composed of four phonemes, /s/, /p/, /u/, and /n/, three of which, /s/, /u/, and /n/, combine into the known word soon. Any task in which a child must produce a word with part of it missing (“say cowboy without the boy” or “say spoon without the /p/”) is referred to as an elision task.
The second dimension of phonological awareness tasks is the specific manipulation that must be engaged to complete the task successfully. For example, clapping out the number of syllables in a word requires children only to coordinate the rhythmic movement of their hands either with the rhythmic movement of the jaw that underlies syllable production or by attending to the prosody of the word as it unfolds during connected speech. By contrast, a task like producing the nonword that is made up of the sounds /v/, /͡ʊ/, and /p/ places arguably greater demands on short-term memory (all three sounds must be held in memory while the nonword is composed), and problem solving (determining how to coordinate the articulators into the novel sequence /v ͡ʊp/). Any task in which a child must combine sequences into a word or nonword is referred to as a blending task.
In addition to being a prerequisite to reading, phonological awareness can be taught to young children, such as those who might be at risk for reading difficulties. Therefore, understanding the nature of phonological awareness and its development is very important to understanding the development of reading skill in children. The purpose of this study is to examine whether predictors of phonological awareness can be found earlier in life than the ages for which norm-referenced clinical tests of phonological awareness currently exist. An early life measure that predicts phonological awareness might be used to identify which at-risk children are most likely to need more explicit instruction in phonological awareness than typically developing children. Moreover, if such predictors can be found, then these, too, might be instructional targets very early in life.
Evidence that phonological awareness skills are predictive of early reading skills has accrued from a large body of research, spanning over 40 years, that includes statistical modeling, cross-linguistic investigations, and intervention studies (Lonigan, Burgess, & Anthony, Reference Lonigan, Burgess and Anthony2000; McBride-Change & Ho, Reference McBride-Chang and Ho2005; Torgesen et al., Reference Torgesen, Alexander, Wagner, Rashotte, Voeller and Conway2001). However, phonological awareness develops relatively late in the preschool years (Anthony & Lonigan, Reference Anthony and Lonigan2004; Carroll, Snowling, Stevenson, & Hulme, Reference Carroll, Snowling, Stevenson and Hulme2003), and there is much disagreement about which earlier-acquired speech and language skills promote later phonological awareness, with several candidate mechanisms having been identified in the literature: oral language skills, speech perception and production, and phonological processing more generally.
Oral language and phonological awareness
Historically, researchers have asserted that oral language skills provide a foundation for metalinguistic awareness more generally, and phonological awareness in particular (Goswami & Bryant, Reference Goswami and Bryant1990; Liberman, Reference Liberman1972). These studies measured different aspects of oral language ability including expressive and receptive syntax, morphology, and lexical–semantic skills. Despite the heterogeneous oral language skills investigated, researchers found consistent evidence that oral language skills are related to phonological awareness. Representative studies in this area include Chaney (Reference Chaney1992), Smith and Tager-Flusberg (Reference Smith and Tager-Flusberg1982), and Roth, Speece, and Cooper (Reference Roth, Speece and Cooper2002). Roth et al. examined whether measures of early reading (naming letters and reading words aloud), child background factors (including socioeconomic status and nonverbal intelligence), oral language skills (including standardized measures of syntax, morphology, and semantics), and phonological awareness skills (assessed with both blending and elision tests) at kindergarten (age 5.5 years) predicted a variety of reading skills (including both decoding and comprehension) concurrently and longitudinally 1, 2, and 3 years later. They found that children’s general oral language ability (a composite measure of multiple oral language skills including syntax, morphology, and semantics) was correlated with phonological awareness. Moreover, phonological awareness was a much stronger and more consistent predictor of a variety of reading measures at later time points. This implies that early language abilities support the development of phonological awareness, which, in turn, supports early reading.
The language score in Roth et al. (Reference Roth, Speece and Cooper2002) was a summary measure of a variety of language skills. Some researchers have posited that vocabulary size specifically is an especially crucial predictor of the development of phonological awareness skills (e.g., Metsala, Reference Metsala1999; Walley, Metsala, & Garlock, Reference Walley, Metsala and Garlock2003). These studies have posited that growth in vocabulary prompts children to reorganize their lexicon along lines of phonological similarity, and that this reorganization allows children to access finer-grained representations of words. That proposal is consistent with other work on the development of phonology more generally (Beckman & Edwards, Reference Beckman, Edwards, Pierrehumbert and Broe2000; Ferguson & Farwell, Reference Ferguson and Farwell1975; Lindblom, Reference Lindblom, Ferguson, Menn and Stoel-Gammon1992).
Speech perception, speech production, and phonological awareness
Speech perception seems intuitively to be a strong candidate predictor of phonological awareness. Both speech perception and phonological awareness require access to the acoustic–phonetic and phonological representations of words. Speech perception may be related to phonological awareness development because children’s ability to encode acoustic–phonetic detail about words may affect the quality of phoneme representations comprised within phonological representations, which are subsequently accessed while performing phonological awareness tasks (Nittrouer & Burton, Reference Nittrouer and Burton2005). One early demonstration of the relationship between speech perception and phonological awareness is provided by McBride-Chang (Reference McBride-Chang1995), who showed that 9- and 10-year-old children’s perception of three phonetic continua (whose endpoints were [ba]-[wa], slit-split, and bath-path) predicted phonological awareness scores in a structural equation model in measures of problem solving and oral language ability.
By contrast, there is relatively little published research on the relationship between speech production and phonological awareness. Early studies evaluating the relationship between speech production and phonological awareness focused on whether children with speech sound delays, who produce speech sounds much less accurately than their peers, have deficits in phonological awareness (Hoffman, Stager, & Daniloff, Reference Hoffman, Stager and Daniloff1983; Rvachew, Reference Rvachew2006; Rvachew & Jamieson, Reference Rvachew and Jamieson1989). In one study, Rvachew, Ohberg, Grawburg, and Heyding (Reference Rvachew, Ohberg, Grawburg and Heydig2003) demonstrated that children with speech sound disorders performed poorly on measures of phonological awareness. Subsequently, Rvachew (Reference Rvachew2006) conducted a longitudinal study of 4-year-old children diagnosed with speech sound disorders, which evaluated the degree to which speech perception, speech production, and vocabulary skills accounted for variability in performance on different measures of phonological awareness. There was a significant predictive relationship among receptive vocabulary, speech perception, and phonological awareness, such that receptive vocabulary and speech perception skills at age 4 explained a combined 37% of the variance in phonological awareness at age 5. Structural equation modeling showed that there was no direct relationship between speech production and phonological awareness. Moreover, speech production did not account for additional variance in phonological awareness once the authors controlled for receptive vocabulary size and speech perception skills. By contrast, other work has shown that children with early speech production problems and language impairment at ages 4–6 are at risk for later reading difficulties at ages 8–11 (Lewis, Freebairn, & Taylor, Reference Lewis, Freebairn and Taylor2000). In short, the exact nature of the relationship between speech production and phonological awareness remains otherwise understudied and unclear. One problem with this area of study relates to the developmental time course of speech production accuracy, as measured by phonetic transcription. Once children have reached the age at which they can complete phonological awareness tasks, most speech sounds are produced correctly. The resulting restriction in the range of speech production measures gives it limited statistical utility in predicting later behaviors.
Nonword repetition
Nonword repetition is a complex task that requires phonological encoding of the acoustic signal, temporary storage of the phoneme sequences in short-term memory (STM), and subsequent articulation of the phonological sequences. Nonword repetition performance is influenced by a variety of factors. Among these are children’s early sensitivity to phonology (e.g., see commentaries on Gathercole’s Reference Gathercole2006 keynote paper on nonword repetition by Gray, Reference Gray2006, and Chiat, Reference Chiat2006) and vocabulary skills (Edwards, Beckman, & Munson, Reference Edwards, Beckman and Munson2004; Metsala, Reference Metsala1999). Given the many abilities that influence nonword repetition and are engaged during nonword repetition, it is not surprising that there have been different interpretations of the nonword repetition task and for the observed relationship between nonword repetition accuracy and other language measures.
Some researchers (e.g., Baddeley, Reference Baddeley2003; Gathercole, Reference Gathercole2006) have interpreted the relationship between nonword repetition and other linguistic measures as evidence for the importance of phonological STM in language development. These accounts claim that because there is reduced support from familiar lexical representations that are stored in long-term memory, repetition of nonwords primarily relies on the capacity to store phonological representations in STM. Support for this claim comes from studies that have shown an effect of nonword length (number of phonemes) on nonword repetition accuracy: repetition accuracy decreases as nonword length increases. Presumably, longer nonwords place a greater demand on STM. These results have been used to support the long-standing argument that phonological representations rapidly decay over time; it takes a longer time to perceive and produce lengthy nonwords, which makes longer nonwords more vulnerable to decay; and thus, repetition accuracy decreases as the length of the nonword increases.
A second, complementary interpretation of the nonword repetition task is that performance on this task depends on children’s lexical knowledge (e.g., Edwards et al., Reference Edwards, Beckman and Munson2004; Metsala, Reference Metsala1999). Edwards et al. posited that, as children’s vocabularies become larger, phonological representations of their words become gradually more segmentally organized, and that this segmental organization allows children to perceive a nonword and hold it in memory more efficiently. Similar, independently developed proposals are presented by Metsala and Walley (Reference Metsala, Walley, Metsala and Ehri1998) and Pierrehumbert (Reference Pierrehumbert2003). As an illustration, consider children’s representations of a word like doggy [dɑɡi]. Early representations of this word might not contain information that this word comprises two syllables, [dɑ] and [ɡi], and four phonemes, [d], [ɑ], [ɡ], and [i]. That is, vocabulary development leads to the development of representations that contain sublexical units such as syllables and phonemes, which Edwards et al. refer to as higher level phonological knowledge. Over time, this increased access to sublexical units facilitates children’s ability to abstract phonological regularities across words within their lexicon. In turn, children are better able to parse and faithfully produce nonwords as sequences of known sublexical units. This hypothesis is supported by the finding that the repetition of nonwords that objectively resemble known words closely are repeated more accurately than nonwords that are less objectively similar to known words, and that the difference in repetition accuracy between these two types of nonwords closes with age (Edwards et al., Reference Edwards, Beckman and Munson2004; Munson, Reference Munson2001; Munson, Kurtz, & Windsor, Reference Munson, Kurtz and Windsor2005). Edwards et al. interpret this as evidence that, in development, children become progressively more able to repeat nonwords that do not resemble known lexical items. This is presumably because they have developed segmental phonological representations that support their ability to perceive unfamiliar sequences of sounds.
Putting aside questions of the nature of the nonword repetition task, there is ample evidence that it is highly correlated with other measures of speech and language. For example, vocabulary size explains a significant proportion of variance in nonword repetition performance, independent of other phonological STM measures, such as performance on a digit-span task (Metsala, Reference Metsala1999). Furthermore, speech perception is correlated with nonword repetition accuracy (Munson, Edwards, & Beckman, Reference Munson, Edwards and Beckman2005). Critically, nonword repetition and phonological awareness are correlated with one another. Metsala (Reference Metsala1999) showed that nonword repetition and a composite measure of phonological awareness are related to one another in 4- to 5-year-old children, even when performance on a separate phonological STM measure, digit span, is taken into account.
The current study
Two important points can be extracted from the research reviewed thus far. First, phonological awareness is a critical component of early reading. Second, many skills are correlated with phonological awareness. There is, however, a gap in the literature, in that we do not know what skills predict phonological awareness. That is, there has not yet been longitudinal work aimed at identifying very early predictors of phonological awareness. In general, the work described thus far has been limited by the fact that phonological awareness itself has not been measured successfully for children below age 4. This is shown by the fact that one of the most widely used tests of phonological awareness, the Comprehensive Test of Phonological Processing, Second Edition (Wagner, Torgesen, Rashotte, & Pearson, Reference Wagner, Torgesen, Rashotte and Pearson2013), does not provide normative data for children below age 4. However, many of the skills that are concurrently related to phonological awareness in young children can be measured much earlier in life. This includes measures of speech perception, speech production, receptive vocabulary, and nonword repetition. The aim of this study, then, is to examine the extent to which these four measures, taken when children are age 2 years, 4 months (2;4)–3;4 (henceforth, Time 1), predict performance on standardized measures of phonological awareness 2 years later, when these children are age 4;3–5;6 (henceforth, Time 2). Based on previous literature, we predicted that measures of speech perception and nonword repetition would be the best predictors of phonological awareness (Edwards et al., Reference Edwards, Beckman and Munson2004; Rvachew & Grawburg, Reference Rvachew and Grawburg2006).
This study makes two unique contributions to the research literature. The first relates to the age of the participants. Because there are no valid standardized or norm-referenced assessments that can reliably measure phonological awareness in children younger than 4 years old, it is important to know which of the measures that young children can complete best predicts phonological awareness ability later in life. The second concerns the opportunity that is given by studying children who are younger than those in previous studies. Specifically, children in this study are still at an age at which variation in speech production accuracy across children is large. Hence, this work helps us better understand what role, if any, speech production plays in predicting phonological awareness.
In essence, this work complements the large literature on longitudinal predictors of early reading, by examining whether we can identify even earlier predictors of phonological awareness, a skill that is known to be a critical prerequisite to early reading. The result of this work is a better understanding of the nature of the development of the different skills that contribute to reading development in prereading children. Such knowledge can help us better understand the skills that need to be facilitated to offset later reading problems.
Method
Participants
Data from 168 children (83 girls; 85 boys) from areas near Madison, Wisconsin, and Minneapolis, Minnesota, were included in this study. These children were a subset of children participating in a larger, longitudinal study investigating the relationship between vocabulary growth and phonological acquisition. Children were ages 2;4 to 3;4 at Time 1 and ages 4;3 to 5;6 at Time 2. Children were monolingual speakers of English with a history of typical speech and language skills, as reported by their parents. Children were excluded if their parents reported that they were receiving any special education service at Time 1. Data from an additional 47 children were excluded from this study because there was incomplete data on at least one of the measured variables of interest.Footnote 1 All children passed a hearing screening in at least one ear at 25 dB hearing level for 1000, 2000, and 4000 Hz. We attempted to recruit children from families with a range of maternal education levels (low/mid/high), but 83% of the children reported in this study had mothers with at least a college degree. Maternal education level was determined from a background questionnaire that was completed by the primary caregiver for each child. See Table 1 for descriptive information on the participants.
Table 1. Descriptive statistics for participants in Time 1 and Time 2

Note: PA stands for phonological awareness. The PA-Composite was derived from taking the average of the scaled scores provided by the elision and blending subtests on the CTOPP-2. aExperimental tasks are not standardized or norm-referenced and do not take age into account.
All participants attended two or three test sessions of about 1 hr at both testing periods. The measures reported in this paper were a subset of tasks administered during the longitudinal study. All reported measures were administered at Time 1 with the exception of the standardized assessment of phonological awareness, which was administered at Time 2.
Measures
Articulation
Children’s articulation skills were measured using the Goldman–Fristoe Test of Articulation—Second Edition (GFTA-2; Goldman & Fristoe, Reference Goldman and Fristoe2000). Children’s productions were recorded and then later transcribed offline by graduate students in linguistics or speech-language pathology. There were three transcribers who worked independently, but who brought any questionable productions (neither clearly correct nor incorrect) to the group for consensus scoring.
Receptive vocabulary
Receptive vocabulary was assessed using the Peabody Picture Vocabulary Test—Fourth Edition (PPVT-4; Dunn & Dunn, Reference Dunn and Dunn2007) at the first testing period.
Nonword repetition
Stimuli
Children were administered a picture-prompted nonword repetition task that was adapted from Edwards and Beckman (Reference Edwards and Beckman2008). The task included 44 nonsense words taken from Edwards et al. (Reference Edwards, Beckman and Munson2004; see Appendix A for details about the nonwords). This task was designed to compare the production accuracy of high- and low-phonotactic probability diphones. Each nonword included a target diphone sequence, which varied in phonotactic probability across items. Target diphone sequences were embedded in “frames” (i.e., the nontarget portion of the nonword). For example, the diphone /mp/ was included in the nonword /fɪkətæmp/. In each nonword, only the target diphone was transcribed and scored for accuracy. The “frames” were similar in phonotactic probability across items. Hence, the differences in phonotactic probability across stimuli items could be primarily attributed to differences in phonotactic probability of the target diphone sequence. It should be noted that some of the low-phonotactic probability diphones included zero-probability sequences such as /pw/, which occurs only in loan words, such as Pueblo in English. Target diphone sequences were consonant–vowel (CV, 14 items), vowel–consonant (VC, 14 items), or consonant–consonant (CC, 16 items). The CC sequences included word-initial onset clusters (e.g., the low-frequency sequence /pw/ as in /pwɑgəb/), word-final coda clusters (e.g., the high-frequency sequence /mp/ as in /fɪkətæmp/), and word-medial hetero-syllabic clusters (e.g., the low-frequency sequence /gd/ as in /dogdet/). Approximately half of the nonwords were bisyllabic and the other half were trisyllabic. The stimuli were recorded by a young adult female whose native dialect was Mainstream American English. The nonwords were normalized for amplitude across the entire stimulus set. Phonotactic probability calculations were based on the Hoosier Mental Lexicon Database (Pisoni, Nusbaum, Luce, & Slowiaczek, Reference Pisoni, Nusbaum, Luce and Slowiaczek1985). The stimuli were presented in random order using E-prime (Schneider, Eschman, & Succolotto, Reference Schneider, Eschman and Succolotto2012). Accompanying the list of stimuli in Appendix A are the corresponding calculated phonotactic frequencies. All nonwords were presented with color photographs of rare objects, such as unfamiliar flowers, rare tools, or unusual sea animals.
Procedure
At the start of the experiment, children were seated in front of a computer screen that displayed an unfamiliar object. For each trial, an experimenter instructed the children to listen to the nonword (a silly word that was supposed to be the target/referent of the nonword) and then repeat it as accurately as possible (see Appendix B for exact instructions). Following the elicited response, the experimenter advanced to subsequent trials using a keyboard response. Each successive trial displayed a different unfamiliar object that was supposed to be the target/referent of the nonword. The experiment comprised a total of 51 trials including 7 training items that preceded the 44 experimental trials. Children’s productions were recorded for subsequent analysis.
Scoring analyses
The analysis of the nonword repetition task included data from a larger sample of children who participated in the longitudinal study of which this paper is a part.Footnote 2 The scoring analysis included an additional 47 children who were excluded from the primary analysis on the predictors of phonological awareness. While the additional children did not complete all the measures of interest for the primary research question, they did complete nonword repetition at Time 1. These children were included because a larger sample provided a more robust estimate of the random effects that were included in the subsequent analysis of children’s phonological awareness.
Nonword productions from 168 children were segmented in Praat (Boersma & Weenink, Reference Boersma and Weenink2016). All of the target diphone sequences (CV, VC, CC) were transcribed by one of two trained native-English speaking phoneticians who listened to the sequence and reviewed the waveform and spectrogram. Transcribers selected the first response from each child whenever possible.Footnote 3 This method was used to minimize the effect of practice for low-phonotactic probability sound sequences within trials. All responses were transcribed using the International Phonetic Alphabet at the level of broad phonemic transcription. During transcription, the transcription program (a custom-written Praat script) queried the transcriber for segmental features corresponding to the diphone target sequence in succession. All nonwords were scored on the basis of featural accuracy and structural accuracy. To assess featural accuracy, each phoneme component was scored as correct (1) or incorrect (0) for each of the three or four corresponding features. That is, consonants were judged for place, manner, and voicing, and vowels were judged for length, height (high, mid, low), and backness (front, central, back) for monophthongs and an added backness judgment for the offglide of a diphthong. An example of the scoring procedure can be found in Appendix C. In addition to feature accuracy, the scoring accounted for structural changes to nonwords that impacted either the syllable length of the nonword (e.g., for a bisyllabic nonword, the transcriber answered the question does the nonword have at least two syllables?) or the phoneme component position within the target diphone sequence (e.g., for a CV sequence, did the consonant immediately precede the vowel and did the vowel immediately follow the consonant?). Children received a point for not deleting a syllable within the nonword and another point for producing each phoneme in the diphone sequence in the correct position. Each nonword production received a total of 8 or 9 possible points if produced correctly. If children did not repeat a nonword, the stimulus item was coded as a nonresponse and children received a score of zero points.
Inter-transcriber reliability
The productions of 168 children were transcribed by one of two transcribers. The first author was the transcriber for 85 of 168 participants, and a second transcriber was the primary transcriber for the remaining 83 participants. Both transcribers independently transcribed nonword repetition productions for 42 participants (25%). The two transcriptions from these 42 participants were used to evaluate inter-transcriber reliability. Information about the specific details of this analysis and the results can be found in the Results section.
Speech perception: Minimal pairs discrimination task
Stimuli
Twenty-five monosyllable minimal pairs were used in this task. All words were familiar to young children, and all word pairs had sounds that were highly confusable, based on Miller and Nicely (Reference Miller and Nicely1955). Minimal pairs included word-initial consonant (peas vs. keys), medial vowel (mouse vs. moose), and word-final consonant (mouse vs. mouth) contrasts. See Appendix D for a complete list of the stimuli.
Procedure
This task used a two-alternative forced-choice minimal pair identification paradigm (as in Munson, Baylis, Krause, & Yim, Reference Munson, Baylis, Krause and Yim2010). The procedure differed from many minimal pair discrimination tasks in that a familiarization trial for each item preceded each test trial because not all words were equally picturable or familiar. Each member of the minimal pair was presented individually and labeled by the computer during the familiarization trials. Then the two pictures were shown beside each other and the target word was presented. Children were instructed to point to the correct response on a touch screen. Responses were automatically scored as correct or incorrect. Children’s responses were analyzed in a separate hierarchical item-response model that provided a measure of children’s phonemic discrimination ability (the details of this model can be found in the Results section).
Scoring analyses
The analysis of the minimal pair discrimination task also included data from a larger sample of children who participated in the longitudinal study. The scoring analysis included an additional 52 children who had completed the minimal pair discrimination task at Time 1. As in the case of the nonword repetition scoring analyses, we included these children because a larger sample provides a more robust estimate of the random effects that were included in the subsequent analysis of children’s phonological awareness.
Phonological awareness
Two phonological awareness measures (the blending and elision subtests from the Comprehensive Test of Phonological Processing—Second Edition; CTOPP-2; Wagner et al., Reference Wagner, Torgesen, Rashotte and Pearson2013) were administered to all children at the second testing period, 2 years later. The blending and elision subtests were selected as measures of phonological awareness because they require children to explicitly manipulate sublexical units within words, with the tasks gradually becoming more difficult, progressing from blending/segmenting compound words to syllables to individual phonemes. The blending subtest required children to produce a string of words, syllables, and phonemes in serial order to form a new word. For example, children listened to a digital recording that presented sounds in isolation (/k/, /ae/, /t/) and were instructed to blend the sounds to produce the word “cat.” The elision subtest required children to delete a word, syllable, or phoneme and then recombine the remaining units to form a new word. For example, children listened to the word “baseball” and were instructed to say the word “baseball” without “base” to produce “ball.” For this assessment, we used the audio prompts from the CTOPP-2 administration CD. The same voice was used for all of the participants. The children’s responses were scored according to the instructional manual; scaled scores for each subtest were derived from the raw scores. For subsequent analyses, a composite score was derived by taking the mean of the scaled scores computed from the blending and elision subtests (i.e., [blending scaled score + elision scaled score] / 2). We used a composite score in the subsequent analyses because these subtests were designed to evaluate the construct of phonological awareness that comprises skills such as blending and eliding sounds.
Results
Nonword repetition analyses
Responses on the nonword repetition task were analyzed using a mixed-effects logistic regression model with the Laplace approximation method applied for maximum likelihood estimation (Raudenbush, Yang, & Yosef, Reference Raudenbush, Yang and Yosef2000), using the glmer function from the lme4 package, which computes and reports p values automatically (version 1.1–17; Bates, Maechler, Bolker, & Walker, Reference Bates, Machler, Bolker and Walker2015). The dependent measure was modeled as a binomial distribution with a logit link. The model included fixed effects for age and phonotactic probability, which were both centered prior to the analysis. Age was included to capture the effects of maturation of production ability, which we predicted would increase over the age range of the children at Time 1. The model also included correlated random intercepts and slopes of phonotactic probability, grouped within child. Random intercepts, grouped within item, were also included to account for differences among items that were unrelated to phonotactic probability. The intercept in this model represents the logit-transformed proportion of features accurately produced in a diphone sequence of average phonotactic probability, by children at the mean age in this sample. The lme4 model formulas are provided in Appendix E.
The results, which can be found in Table 2, showed a significant effect of intercept, b = 1.03, SE = 0.10, z = 9.90, p < .001. There was a significant effect of age, b = 0.13, SE = 0.02, z = 5.46, p < .001, indicating that the proportion of accurately produced features increased with age. Finally, there was a significant effect of phonotactic probability, b = 0.085, SE = 0.02, z = 3.35, p < .001, indicating that the children produced a greater proportion of features accurately on nonwords that included diphone sequences with higher phonotactic probability. The estimated unconditional variances of the random effects of intercept and phonotactic probability, grouped within child, were 1.18 and 0.006, respectively. The estimated unconditional correlation between the child-level random effects was ρ = .17. The estimated unconditional variance for the random intercept, grouped within item, was .16. The child-level random effects of intercept and phonotactic probability from this model were used in the subsequent analysis as independent predictors of phonological awareness performance at Time 2.
Table 2. Results of the nonword repetition accuracy logistic mixed-effects regression (n = 168)

aPhonotactic probability and age are mean centered in this model. bChild-level random intercept and slope and item-level random intercept were included.
The child-level random effects of intercept correspond to each child’s predicted accuracy on the nonword repetition task, controlling for the effects of age and phonotactic probability. Specifically, a larger intercept indicates higher predicted accuracy on the nonword repetition task. Moreover, children’s mean accuracy on the nonword repetition is positively correlated with the random intercept (r = .88). This is illustrated by Figure 1, which shows the children’s observed means plotted against the child-level random effects of intercept. As such, the random intercepts can be interpreted as a measure of overall nonword repetition accuracy.

Figure 1. The relationship between children’s observed accuracy on the nonword repetition and the model-derived child-level predictions of children’s nonword repetition accuracy (i.e., random effects of intercept).
The child-level random effects of phonotactic probability are a measure of children’s sensitivity to the phonotactic probabilities of the diphone sequences, controlling for the effects of age and the child’s overall accuracy. Figure 2 shows the fitted model’s predictions plotted against (log-transformed) phonotactic probability, for the quarter of the children with the largest random effects of phonotactic probability; Figure 3 shows analogous prediction curves for the quarter of the children with the smallest random effects of phonotactic probability. A larger random effect of phonotactic probability (e.g., steeper slope of the prediction curve) indicated that children’s diphone repetition accuracy was strongly and directly related to the phonotactic probability of the sequence (see Figure 2). Conversely, children with a smaller random effect of phonotactic probability (e.g., a shallower slope of the prediction curve) were less sensitive to the phonotactics of the diphone sequence, with their predicted scores remaining relatively constant across a wide range of phonotactic probabilities (see Figure 3). It should be noted, however, that a small random effect of phonotactic probability does not necessarily entail poor overall diphone repetition accuracy, as some of the curves plotted in Figure 3 are near ceiling across the full range of phonotactic probabilities. It should be noted that these results differ from those of previous studies such as Munson, Edwards, et al. (Reference Munson, Edwards and Beckman2005) and Edwards et al. (Reference Edwards, Beckman and Munson2004), who found that children with poorer nonword repetition accuracy overall (which would show up in our model as a lower intercept) had greater sensitivity to phonotactic probability (which would show up in our model as a steeper slope). It is unclear why these differences are observed, although it may be due to the younger age and more limited age range of the participants in the current study.

Figure 2. Individual accuracy curves predicted by the nonword repetition accuracy model for 42 children with the steepest linear slopes.

Figure 3. Individual accuracy curves predicted by the nonword repetition accuracy model for the 42 children with the shallowest linear slopes.
Inter-transcriber reliability
Because children’s productions were transcribed by two different transcribers, an analysis was run to examine whether differences across transcribers influenced the results of nonword repetition analysis. Children’s diphone repetition accuracy (i.e., the outcome variable of the nonword repetition) was fit using a mixed-effects logistic regression model in which the predictors were a fixed effect for transcriber (a categorical variable; one transcriber was coded as 0 and the other was coded as 1), age and phonotactic probability (continuous predictors, which were both mean-centered), and binary interactions between age and transcriber and between phonotactic probability and transcriber. The model also included child-level random effects for the intercept (to estimate differences in overall diphone repetition accuracy), the effect of phonotactic probability (to estimate individual differences in the extent to which phonotactic probability affected diphone repetition accuracy), and transcriber (to estimate individual differences in the extent to which differences between transcribers affected estimates of the accuracy of individual children’s diphone repetition). There was also a random effect for the intercept of items (i.e., the model accounted for the fact that individual diphone sequences varied in their accuracy for reasons other than age, phonotactic probability, or transcriber).
Table 3 shows the results of this model. The effect of transcriber on nonword repetition accuracy was not significant, b = 0.04, SE = 0.05, z = 0.82, p = .42. That is, nonword repetition accuracy, as predicted by the model, could not be readily explained by differences across transcribers. There was a significant interaction between transcriber and age; however, the effect of transcriber was not significant for the variables of interest that were extracted for subsequent analysis (i.e., random intercept [a measure of accuracy] and random slope for phonotactic probability [a measure of the effect of phonotactic probability]).
Table 3. Inter-transcriber reliability results (n = 42)

Note: Child-level random intercept and slopes for the effect of frequency and the effect of transcriber, and item-level random intercept were included. aTranscriber A was coded as a 1 and Transcriber B was coded as 0. The intercept is interpreted as the log-odds of the probability of features correctly produced for a word of average phonotactic frequency for a child who is of average age and who was transcribed by Transcriber B.
Minimal pair discrimination analysis
Responses on the minimal pair discrimination task were analyzed using a mixed-effects logistic regression model with the Laplace approximation method applied for maximum likelihood estimation (Raudenbush et al., Reference Raudenbush, Yang and Yosef2000), using the glmer function from the lme4 package, which computes and reports p values automatically (version 1.1–17; Bates et al., Reference Bates, Machler, Bolker and Walker2015). The dependent measure was modeled as a binomial distribution with a logit link. The model included fixed effects for age and receptive vocabulary (PPVT-4 growth scale values), which were centered prior to the analysis. Age was included to capture the effects of maturation on phonemic discrimination ability, which we predicted would increase over the age range of the children at Time 1. Receptive vocabulary was included to account for effects of vocabulary size on children’s performance as this task required children to discriminate between known, real words. The model included correlated random intercepts grouped within child. Random intercepts, grouped within item, were also included to account for differences attributed to the relative difficulty of individual items.
This logistic regression model estimates the probability of child i correctly selecting word j on word pair k. The model’s intercept represents the average child’s probability of correctly answering for an average item. The random effects of intercept, grouped within child, are a measure of children’s phonemic discrimination ability (or deviation from the overall average). The random effects of intercept, grouped within item (i.e., by-word and by word-in-pair random intercepts), represent the relative level of difficulty for each item. Hence, the model’s intercept represents a child of an average age and average vocabulary level. By extension, the child-level random effects of intercept represent each child’s phonemic discrimination ability after controlling for age and receptive vocabulary. The lme4 model formulas are provided in Appendix E.
The random effects of intercept, grouped within child, were extracted from the mixed-effects item-response minimal pair discrimination model and used as a derived measure of children’s speech perception abilities in the crucial analysis for the current study—the investigation of which Time 1 variables best predict phonological awareness at Time 2.
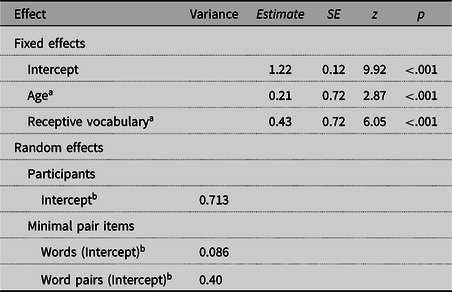
The results, which can be found in Table 4, showed a significant effect of Intercept, b = 1.22, SE = 0.12, z = 9.92, p < .001. There was a significant effect of age, b = 0.21, SE = 0.072, z = 2.87, p < .01, indicating that the probability of correctly answering for an average item increased with age. Finally, there was a significant effect of receptive vocabulary, b = 0.43, SE = 0.072, z = 6.05, p < .001, indicating that the probability of correctly answering for an average item increased for children with larger vocabularies. The estimated unconditional variance of the random effects of intercept was .713. The estimated unconditional variance for the random intercept, grouped within item by-word and by-word-pair were .086 and .40, respectively.
Table 4. Results of the minimal pair discrimination logistic mixed-effects regression (n = 173)

aReceptive vocabulary and age were mean-centered in this model. bChild-level random intercept and item-level random intercept were included.
The child-level random effects of intercept correspond to each child’s phonemic discrimination ability controlling for the effects of age and receptive vocabulary. The child-level random effects of intercept from this model were used in the subsequent analysis as an independent predictor of phonological awareness performance at Time 2.
Phonological awareness analyses
Bivariate Pearson product-moment correlations were computed among all of the candidate predictors and the dependent variable, phonological awareness (see Table 5). The results of the pairwise correlations suggest that all measures were significantly correlated with each other with the exception of the derived measure of children’s sensitivity to phonotactic probability (i.e., child-level random slopes).
Table 5. Bivariate Pearson product-moment correlations

aPhonological awareness: A composite score derived from averaging the scaled scores on the blending and elision subtests of the CTOPP-2. bGrowth scale value scores were used in this study because they are linear transformations of the raw score. cAn accuracy measure derived from the item-response analysis of the minimal pair discrimination task (child-level random intercepts) and dstandard scores on the GFTA-2 were used to compute the bivariate correlations. eTwo measures were derived from the analysis of the nonword repetition task: overall accuracy (child-level random intercepts) and a measure of phonotactic probability (child-level random slopes). *p < .01. **p < .001.
A multiple linear regression model was fit with ordinary least squares to evaluate whether the measures from the nonword repetition analysis, receptive vocabulary size, and measures of speech perception and speech production ability, assessed at Time 1 predicted phonological awareness at Time 2. In the proceeding analysis, phonological awareness was quantified as the composite scaled score that was calculated by taking the mean of the blending and elision scaled scores from the CTOPP-2. For this model, the independent variables included child-level random effects of intercept and phonotactic probability from the nonword repetition analysis, child-level random effects of intercept from the minimal pair discrimination analysis, and standard scores from the PPVT-4 (Dunn & Dunn, Reference Dunn and Dunn2007) and GFTA-2 (Goldman & Fristoe, Reference Goldman and Fristoe2000). All predictor variables were mean-centered prior to the analysis.
The result for the phonological awareness model is summarized in Table 6. In the model predicting phonological awareness performance, the intercept was significant, b = 9.91, SE = 0.42, t (115) = 23.49, p < .001. There was a significant effect of the child-level random intercept from the nonword repetition analysis, b = 0.60, SE = 0.26, t (115) = 2.70, p = .025, indicating that children who produced a greater proportion of features accurately on the nonword repetition also demonstrated higher performance on the tests of phonological awareness. There was a significant effect of speech production skills, b = 0.52, SE = 0.24, t (115) = 2.20, p = .030, indicating that children who produced fewer errors on the GFTA-2 demonstrated better performance on the tests of phonological awareness. The derived measure of speech perception (i.e., the by-child random effects of intercept) was not a significant predictor (minimal pair discrimination), b = 0.15, SE = 0.25, t (115) = 0.57, p = .57, while receptive vocabulary did not reach statistical significance at the conventional level of α =/< .05 level (PPVT-4), b = 0.42, SE = 0.22, t (115) = 1.90, p = .06. The four predictors in this model accounted for 26.9% of the variance in scores on the phonological awareness subtests.
Table 6. Multiple linear regression results: Dependent variable is the CTOPP-composite score (n = 121)

Note: All independent variables were measured at Time 1. The outcome variable was measured at Time 2.
Discussion
This study extends previous research on phonological awareness development in preschool-age children in two specific ways. First, this is the only study to date to investigate what child-specific variables measured before age 4 predict later phonological awareness. Second, this is one of only a few studies to examine predictors of phonological awareness collectively (Carroll et al., Reference Carroll, Snowling, Stevenson and Hulme2003; Lonigan et al., Reference Lonigan, Burgess and Anthony2000; Rvachew & Grawburg, Reference Rvachew and Grawburg2006). We investigated the relationship among phonological awareness, nonword repetition, speech production and perception, and receptive vocabulary.
The results suggest that the two best predictors of phonological awareness were a measure of accuracy derived from the nonword repetition task and children’s speech production skills. Speech perception and receptive vocabulary size were not significant predictors. We consider the speech production measure (standard score on the GFTA-2) to be a measure of articulatory-motor control, while we consider the nonword repetition measure to be a measure of phonological processing—that is, a measure of children’s ability to encode and produce unfamiliar sequences without lexical support.
Nonword repetition
The nonword repetition task included nonword sequences with a range of phonotactic probabilities. We used children’s accuracy on these sequences to derive two measures of phonological processing: a measure of children’s sensitivity to the phonotactic probabilities of sound sequences (child-level random slopes) and a measure of nonword repetition accuracy (child-level random intercepts).
The effect size of our measure of accuracy (child-level random intercepts) as measured by Cohen’s f 2 is 0.28, which is between a medium and large effect size (Cohen, Reference Cohen1988). This predictor explained 22% of the variance in phonological awareness at age 5. By contrast, our measure of children’s sensitivity to phonotactic probability (i.e., child-level random slopes), was not a significant predictor.Footnote 4
Because participant age and item phonotactic probability were in the model that we used to derive the random intercepts and slopes, the accuracy measure can be considered an index of how well children can produce phoneme sequences without lexical support, abstracting away from phonotactic probability and motor control (as indexed by age). This result suggests that children’s overall accuracy on nonword repetition is indexing children’s early ability to parse words into smaller units that can be recombined in new ways to produce novel words, as suggested in work such as Edwards and Lahey (Reference Edwards and Lahey1998) and Gupta (Reference Gupta, Thorn and Page2009). Phonological awareness is difficult to reliably measure in younger children, but nonword repetition is a task that children as young as age 2 can perform successfully (Gathercole & Adams, Reference Gathercole and Adams1993). These results suggest that nonword repetition accuracy can be used as a diagnostic measure of children’s higher level phonological knowledge when children are too young to reliably perform phonological awareness tasks. By extension, it can also be used to identify children who are at risk for having poor metalinguistic skills (e.g., children with speech and language disorders).
Speech production and speech perception
This study found that children’s speech production ability, but not their speech perception ability at age 2;4–3;4, was a significant predictor of children’s phonological awareness 2 years later. Children’s speech production ability explained approximately 3% of the variance in phonological awareness at age 5. This result is inconsistent with Rvachew and Grawburg (Reference Rvachew and Grawburg2006), who found that speech perception at age 4 (using a different task than the current study), but not speech production (using the same task as the current study), was a significant predictor of phonological awareness at age 5. It is also inconsistent with previous research on older children that has shown that speech perception is significantly related to phonological awareness (McBride-Chang, Reference McBride-Chang1995).
There are two possible explanations for the discrepant results between the current study and other research. We used a minimal pairs task, a relatively easy task, to assess speech perception because we were testing 2.5- to 3-year-olds. By contrast, Rvachew and Grawburg (Reference Rvachew and Grawburg2006) utilized the more metalinguistically demanding Speech Assessment and Interactive Learning System (SAILS; AVAAZ Innovations, 1995). This task requires children to distinguish between correct and incorrect productions of sounds in words. Children younger than age 4 are simply unable to perform this task. Further, the children in this study were at least a year younger than the children in the Rvachew and Grawburg (Reference Rvachew and Grawburg2006) study. At age 2.5 to 3.5 years, children have considerably more variability in their speech production skills than at age 4 or 5.
We hypothesize that lower level speech perception and speech production skills are both important for the development of phonological awareness. Children who are better able to encode and access fine-grained acoustic–phonetic and articulatory–motor representations may have higher quality phonological representations. These higher quality representations may, in turn, make segmental information more accessible for phonological awareness tasks. The conflicting results from different studies may depend on the nature of the speech production and speech perception tasks, as well as on the ages/ability levels of the child. The fact that speech production, but not speech perception, was a significant predictor in the current study may depend entirely on the age of the participants and the tasks that we chose.
Receptive vocabulary
Unlike many previous researchers (Walley et al., Reference Walley, Metsala and Garlock2003; Rvachew & Grawburg, Reference Rvachew and Grawburg2006), we did not observe a statistically significant relationship between receptive vocabulary and phonological awareness. This was surprising to us, given the results of previous studies and the theoretical argument that increases in vocabulary size result in more segmental phonological representations, which supports the development of phonological awareness. It is possible that the discrepancies observed in the current study as compared to previous research is partially attributed to the different phonological awareness tasks examined. A variety of tasks can be used to evaluate phonological awareness skills, and each task differs in the linguistic manipulation engaged and the level of the linguistic structure that must be accessed. This study included a measure of elision and blending from the standardized CTOPP-2, whereas previous studies (as in Rvachew & Grawburg, Reference Rvachew and Grawburg2006) used experimental rime and onset awareness tasks. In the rime awareness task, children were presented with a puppet name and an array of four pictures, one of which rhymed with the puppet’s name. Children were instructed to select the picture whose name rhymed with the puppet’s name. In the onset awareness task, children were shown another puppet and told that everything the puppet owned began with the same sound. Children were provided the relevant sound and they selected the picture whose name began with that particular sound. The demands involved when performing sound awareness tasks such as rhyming or onset awareness versus more explicit measures of phonological awareness like elision and blending may influence the relationships observed between phonological awareness and vocabulary. In addition, much previous research has shown the nonword repetition accuracy and receptive vocabulary size are highly correlated (Chiat & Roy, Reference Chiat and Roy2007; Gathercole & Adams Reference Gathercole and Adams1993). In the present study, receptive vocabulary did not reach statistical significance at the conventional α = .05 level (p = .06). Given the strong correlation between our measure of nonword repetition accuracy and receptive vocabulary size (see Table 5), we hypothesize that the inclusion of our measure of nonword accuracy in the model resulted in a lack of predictive power for receptive vocabulary size.
Conclusion
It has been well established that phonological awareness is one of the best predictors of later reading ability. However, it is very difficult to reliably evaluate phonological awareness in children younger than ages 4 or 5. This remains an important area of study as we continue to devise programs and instructional strategies aimed at preventing early reading disabilities. This study was designed to examine reliable early predictors of phonological awareness in children younger than age 4. We found that the best predictors of phonological awareness were nonword repetition accuracy and speech production skills. The clinical implications of these findings suggest that nonword repetition accuracy at age 2;4–3;4 is a reliable predictor of phonological awareness 2 years later and could be strategically used to evaluate at-risk children. While this study did not include children who receive speech/language services, this would be a fruitful area for future research. This is useful information because a nonword repetition task can be successfully administered to children as young as age 2 (Anderson, Wagovich, & Hall, Reference Anderson, Wagovich and Hall2006; Dollaghan & Campbell, Reference Dollaghan and Campbell1998; Gathercole & Adams, Reference Gathercole and Adams1993; Shriberg et al., Reference Shriberg, Lohmeier, Campbell, Dollaghan, Green and Moore2009).
Ackowledgments
This work was supported by NIDCD R01 02932 to Jan Edwards, Mary E. Beckman, and Benjamin Munson; NIDCD T32 DC005359 to Susan Ellis Weismer; and NICHD 30 HD03352 to the Waisman Center. This material is also based upon work supported by the National Science Foundation under Grant 1449815. We are grateful to all of the children who participated in this study, their families, and community members who assisted with recruiting. We also thank Patrick Reidy, Tristan Mahr, and affiliate members of the Learning to Talk labs at the University of Wisconsin–Madison and the University of Minnesota and Mary E. Beckman at the Ohio State University for their contributions to this research.
Appendix A. The nonword repetition task included 44 nonsense words taken from Edwards et al. (Reference Edwards, Beckman and Munson2004)
Table A.1. Description of the phonemic form of nonword stimuli (adapted from Edwards et al., Reference Edwards, Beckman and Munson2004)

Note: The first column lists the nonwords with the target diphone sequences underlined. The second column provides the log phonotactic probabilities for the embedded target sequences calculated from the Hoosier Mental Lexicon (Pisoni et al., Reference Pisoni, Nusbaum, Luce and Slowiaczek1985). The third column provides the scored segmental features for each phoneme component of the diphone target sequence; the phoneme components are separated by the “+” sign.
Appendix B. The verbal instructions provided to children during the nonword repetition task
Examiner: For this computer game, we’re going to play with one of my friends. Which one do you want to play with?
Child selects an avatar-reinforcer for the computer game.
Examiner: Remember how last time we worked together you looked at some pictures on my computer and repeated back the words you heard? Today we are going to do the same thing. The pictures you see and the words you hear today will probably be new to you. So, if you hear the computer say “sligref,” you should say __________.
Wait for child’s response.
That’s right! If the computer says “sligref,” then you say “sligref.”
You are so good at this! Are you ready to repeat back some more words?
Great! Let’s try one!
Go through the first example. After the computer says the nonword, prompt the child to say the word.
Can you say what the computer just said?
Wait for response.
Good job! Remember, our friend [*avatar name*] is going to play along with us and we’ll watch them move up the ladder when you say the words!
Proceed with the experiment.
Appendix C. Nonword repetition scoring procedure example
Table C.1. Example of the target diphone sequence scoring procedure

Appendix D. Minimal pair identification stimuli adapted from Munson et al. (Reference Munson, Baylis, Krause and Yim2010)
Table D.1. Minimal pair discrimination stimuli

Table E.1. Formulas

Note: (glmer) A function that fits a generalized linear mixed-effects model including both fixed and random effects. (lm) A function that fits a simple linear regression model.