


Introduction
Glass beads occur in southern African archaeological contexts dating from the second half of the first millennium AD. The beads attest to international trade networks connecting southern Africa with eastern Africa and southern Asia (Robertshaw et al. Reference Robertshaw, Wood, Melchiorre, Popelka-Filcoff and Glascock2010). From the early second millennium AD, early state-level societies in southern Africa based at Mapungubwe in the Shashe-Limpopo confluence, and at Great Zimbabwe in south-central Zimbabwe, traded large quantities of these items; glass beads seem to have increased in importance following European expansion in Africa and Asia from 1500 AD onwards. This article discusses glass beads recovered from a sixteenth- to seventeenth-century AD trading site in northern Zimbabwe. The site is located at Baranda Farm approximately 8.5km east of the town of Mount Darwin, which is itself approximately 170km to the north of Harare (Figure 1). Baranda Farm is the location of the trading settlement, or market, of Massapa, in the heartland of the Mutapa state (Pikirayi Reference Pikirayi1993). The Mutapa state succeeded Great Zimbabwe from the mid fifteenth century AD onwards, assuming control of the gold trade in the northern regions of the Zimbabwe plateau. The Portuguese, who supplanted Swahili traders over much of the eastern African coast and dominated the gold trade in northern Zimbabwe, established several trading markets (feiras) in the region, including Dambarare, Luanze and Massapa. Historical records show that Massapa, which was located in the gold-rich Mukaradzi Valley east of Mount Fura, was the most important of these markets (Pikirayi Reference Pikirayi1993, Reference Pikirayi2009).

Figure 1. Map of sites mentioned in the study; the larger dot indicates the Massapa feira (now Baranda) site where the glass beads were recovered.
In 1992, the site of Baranda was subject to detailed archaeological investigations, which consisted of both controlled surface collection and excavation. Its stratigraphy comprised a shallow deposit (<0.5m in depth), which in most places was disturbed by later cultivation. A high quantity of imported glass beads, locally manufactured earthenware, European and Asian stoneware, and porcelain were recovered. This evidence attests to extensive mercantile contact with traders from the Indian Ocean coast. There is no significant difference in date between surface material and that from the sub-surface, suggesting that Baranda was a single-phase settlement. The glass beads recovered from Baranda match Garlake's Dambarare group 2, identified as seventeenth-century Portuguese trade beads. These are also similar to beads recovered at the Luanze (Garlake Reference Garlake1967, Reference Garlake1969) and Great Zimbabwe (Period IV) sites (Pikirayi Reference Pikirayi1993).
Artefacts surviving in the archaeological record, such as the imported glass beads recovered from southern African archaeological contexts, are useful in revealing internal and external trading patterns, and in the dating of sites. These beads are mostly simple, monochrome and manufactured using the drawn technique. They should be measured using a standard classification system. In this study, the glass beads recovered from Baranda are reconsidered using the method established by Koleini et al. (Reference Koleini, Prinsloo, Biemond, Colomban, Nego, Boeyens and van der Ryst2016a), where:
-
a) The beads are initially classified on the basis of Wood (Reference Wood2000, Reference Wood2011). This is a common method for the identification of southern African glass trade beads. The beads are divided morphologically into seven sequential series, covering the seventh to sixteenth centuries AD (Table S1 in supplementary material). A typical composition was assigned to each series by means of the Laser Ablation Inductively Coupled Plasma Mass Spectrometry (LA-ICP-MS) technique (Robertshaw et al. Reference Robertshaw, Wood, Melchiorre, Popelka-Filcoff and Glascock2010). Previous research on beads from Magoro Hill (Koleini et al. Reference Koleini, Prinsloo, Biemond, Colomban, Nego, Boeyens, van der Ryst and van Brakel2016b), however, demonstrated that some beads identified using Wood's series may have different chemical compositions, or were made of composite glass.
-
b) Composition, nanostructure and colouring agents of the beads are identified using two complementary methods of X-ray fluorescence (XRF) and Raman spectroscopy. Some of the beads are analysed with SEM-EDS for measuring their soda content, due to limitations in the portable XRF in detecting sodium. The results are compared with the chemistry of bead series established in Robertshaw et al. (Reference Robertshaw, Wood, Melchiorre, Popelka-Filcoff and Glascock2010) and Koleini et al. (Reference Koleini, Prinsloo, Biemond, Colomban, Nego, Boeyens and van der Ryst2016a). Imported glass beads can be placed in the correct series by analysing their composition and morphology.
Sample morphology and frequency
Around 20 000 beads, dating to the sixteenth and seventeenth centuries AD, were recovered from Baranda (Pikirayi Reference Pikirayi1993). All the beads were made using the drawn technique. The majority of the beads were simple oblates, although tubular and cylinder forms were also present in lower quantities. Some of the beads were irregular in shape. The dominant colour was brownish-red (74.6 per cent), followed by dark blue (8 per cent), yellow (6.7 per cent), green (5 per cent), light blue (3.6 per cent), black (1.8 per cent), whitish-orange (0.1 per cent) and white (0.1 per cent). Also recovered were glass beads in other colours, such as orange and purple, and compound beads, mostly brownish-red on green. The majority of the beads were of small (around 90 per cent, 2–4mm in diameter) and medium size (around 8 per cent, 4–6mm), although some were minute (N = 18, <2mm) or large (N = 3, 6–10mm) (Pikirayi Reference Pikirayi1993). According to Francis (Reference Francis1988), the brownish-red-on-green beads were first produced prior to the seventeenth century AD in Venice and Amsterdam, and appeared in African markets from the mid seventeenth to early nineteenth centuries (Beck Reference Beck and Caton-Thompson1931; Robertshaw et al. Reference Robertshaw, Wood, Haour, Karklins and Neff2014).
Forty-two representative samples in all colours (except black) were selected for a detailed morphological and chemical composition study by portable XRF. The beads were translucent-opaque, opaque-translucent and opaque (brownish-red and white European beads). All of the beads, except some opaque whites, were placed in the Khami-IP series (AD 1430–1650), although the frequency of oblates is low in the other Khami-period sites. Indo-Pacific (IP) indicates that the beads are expected to have been imported from South or Southeast Asia via the Indian Ocean trade route. Earlier series of K2-IP (AD 980–1200) and East Coast-IP (AD 1000–1250) have the same origin (Table S1). Twenty-two bead samples were chosen for Raman spectroscopy (Figure 2).
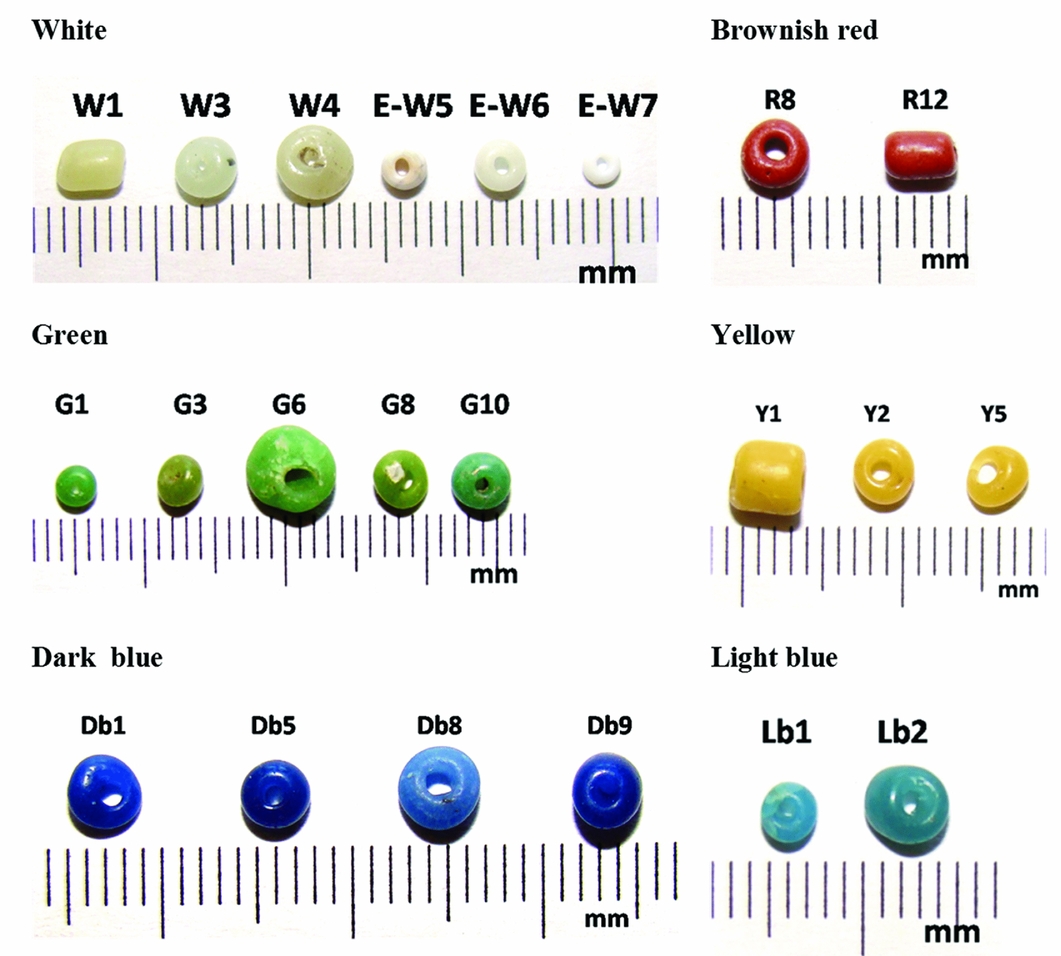
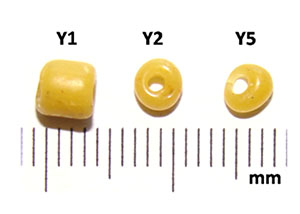
Figure 2. Beads selected for Raman micro-spectroscopy analysis. W: white; R: red; G: green; Y: yellow; Db: dark blue; Lb: light blue; E: European beads.
Laboratory procedure
The beads were cleaned in an ultrasonic bath with de-ionised water to remove remnants of surface soil and sand, and were then dried thoroughly. The beads appeared shiny to the naked eye, with no sign of surface degradation. There were, however, bubbles and inclusions within some of them.
All Raman spectra were recorded using a Horiba JobinYvon LabRam HR800 Raman instrument with a 458nm line of an Ar+ ion Coherent laser as an excitation source. An Olympus microscope with a 50× long working distance objective was used to focus the laser line on the sample glass matrix or coloured area (Power 2 to 0.5mW, respectively). With this objective, the diameter of the analysing spot on the sample surface was less than 10µm. The spectra baselines were subtracted by using LabSpec software, following the method provided by Colomban (Reference Colomban2003).
Quantitative XRF measurements were made using a portable Thermo Scientific Niton XL3t GOLDD spectrometer. The diameter of the analysed spot was 8mm. All of the samples were measured in a Niton XL3 portable test stand using mining Cu/Zn modes. Four elemental ranges of detection, namely main, low, high and light, with a measurement duration of 240 seconds in total, were selected to detect traces of 36 elements. The limit of detection (LOD) of the elements was calculated using a 2-sigma range. The output of the measurement is elemental concentration of the samples in parts per million (ppm), which was manually converted to wt%. The instrument measured the concentration of elements heavier than magnesium (Mg), while the concentration of undetected elements was calculated by the device to give a 100 per cent total balance.
A Hitachi 3400N SEM coupled with an Oxford EDS system with an Inca X-sight ‘Si-detector’ was used to measure the main glass elemental concentrations in the eight Khami beads. The analyses were performed under an accelerating voltage of 15kV on unpolished and uncoated surfaces of glass beads in vacuum conditions. The measurements were calculated with INCA Energy and Quartz PSI software.
Raman and XRF measurements of the glass matrix
The Raman spectrum of glass shows a characteristic glassy silicate signature, made of SiO4 tetrahedron vibrations (Colomban Reference Colomban2003, Reference Colomban and Janssens2012). The bending and stretching vibrations of SiO4 are recorded in the form of two broad bands, around 500 and 1000cm−1 respectively. The bending mode is sensitive to the variation of the short range environment and hence the flux; the stretching mode depends on the Si-O bond modifications (glass nanostructure). Plotting the peak maximum wavenumber in bending (δmaxSi-O) vs the stretching envelopes (νmaxSi-O) was previously used to classify southern African glass beads on the basis of chemical structure (Prinsloo et al. Reference Prinsloo, Tournié and Colomban2011; Tournié et al. Reference Tournié, Prinsloo and Colomban2012; Koleini et al. Reference Koleini, Prinsloo, Biemond, Colomban, Nego, Boeyens and van der Ryst2016a). The same method was performed for the Baranda glass beads (Figure 3). The result shows three specific groups of glass.

Figure 3. Classification of beads with plotting Raman wave number of maximum intensity peak in bending and stretching envelopes.
Group 1, soda glass (Na2O)
The majority of the beads traditionally classified as Khami-IP have been placed in this group. Raman spectra of these beads show strong peaks around 486–498cm−1 and 1075–1100cm−1. The beads show two different shapes of Raman spectra in the stretching band. The first (Figure 4a-1) consists of a bending peak at 497cm−1 and three stretching components at 949, 993 and 1094cm−1, with gradually increasing intensity towards a higher wavenumber in stretching band. In some spectra, the intensity of 949 and 993cm−1 are close. The same spectrum has been recorded for some oblate-shaped Khami-IP beads recovered at Magoro Hill and Basinghal Farm (Koleini et al. Reference Koleini, Prinsloo, Biemond, Colomban, Nego, Boeyens, van der Ryst and van Brakel2016b).

Figure 4. a) Raman spectra of glass matrices; b) Raman spectra of pigments, opacifiers and second phases.
The second spectrum (Figure 4a-2) consists of a band at 491cm−1 and three stretching components with almost similar intensity at 944, 993 and 1079cm−1. The increased intensity of the peak at around 950cm−1 is related to a higher concentration of iron ions in the glass matrix (Baert et al. Reference Baert, Meulebroeck, Wouters, Cosyns, Nys, Thienpont and Terryna2011). The spectrum is consistent with green and brownish-red beads. The same spectrum has been recorded for blue-green K2-IP beads found at a Toutswe site (37-A3-16, Kudumatse) in Botswana. These contained high amounts of iron used as yellow colourant, which, in combination with copper, forms a blue-green colour (Koleini et al. Reference Koleini, Prinsloo, Biemond, Colomban, Nego, Boeyens and van der Ryst2016a).
XRF measurement shows that the beads (Khami-IP) in the soda group contained a higher concentration of aluminium (mean: 5.5 per cent) compared to calcium (mean: 2.1 per cent) and potassium (between 1.4 per cent and 2.6 per cent) (Table 1, group 1). Two of the dark blue Khami beads contained higher potassium (>3.5 per cent), making them closer to Bambandyanalo (K2) and East Coast-IP beads in composition (Figure 5a). As seen in other Indo-Pacific beads discovered in southern Africa (Robertshaw et al. Reference Robertshaw, Wood, Melchiorre, Popelka-Filcoff and Glascock2010; Koleini et al. Reference Koleini, Prinsloo, Biemond, Colomban, Nego, Boeyens and van der Ryst2016a), all of these Khami-IP beads contain traces of uranium (58.0±22.0ppm).
Table 1. XRF measurement results of the major glass elements (wt%) for the classified beads with Raman.

Note: a) the element is used as pigment or colourant.

Figure 5. a) Ternary plot of K, Ca and Al ratio of K2, East Coast and Khami-IP beads recovered at Baranda, Magoro Hill and Faure; b) a comparison of (Mg+K), lead and aluminium concentrations of lead arsenate beads found at Baranda and Magoro Hill. Colour fill refers to the colour of the beads.
EDS results show that all the beads in the soda group contained soda (Na2O) in the range of 10±1.9 per cent, and concentrations of MgO generally less than 1.2 per cent (Table S2). XRF and EDS results show that the composition had the same trend as that of the Khami-IP bead series recovered from the Magoro Hill and Faure archaeological sites (Figure 5a).
Group 2, soda/lime glass (Na2O/CaO)
The glass spectra of these beads show maximum peaks around 543–552cm−1 and 1087–1090cm−1. The group contained only two green Khami-IP beads (G3, G6) and one white European bead (W6). The green Khami-IP beads spectra (Figure 4a-3) have the same shape in the stretching envelope similar to the spectra recorded for the green and brownish red beads in the soda group (Figure 4a-2).
XRF measurement revealed that these two green Khami-IP beads had a similar composition to those in the soda group (Table 1, group 2). The difference in Raman spectra of glass is generally due to the chemical composition and the processing technology (e.g. temperature, manufacturing techniques) used in their production. It is possible that the heterogeneous chemical structure of these green beads caused this difference. Inconsistency in glass structure was previously reported for Roman/Punic glass beads and some of the Khami beads found at Magoro Hill (Colomban et al. Reference Colomban, March, Mazerolles, Karmous, Ayed, Ennabli and Slim2003; Koleini et al. Reference Koleini, Prinsloo, Biemond, Colomban, Nego, Boeyens, van der Ryst and van Brakel2016b), and can only be identified with detailed cross-sectional spot analysis of the beads.
The spectrum of the white European bead (E-W6) has a narrow medium intensity peak at 997cm−1 and one broad, strong peak at 1087cm−1 (Figure 4b-3) in the stretching band. The narrow peak at 990cm−1 is characteristic of α-wollastonite (CaSiO3) nano-precipitate, a calcium-rich silicate (Ricciardi et al. Reference Ricciardi, Colomban, Tournie and Milande2009a). XRF measurement of these beads (Table 1, group 2/Eu) shows that the glass matrix contained low aluminium (1 per cent) and high calcium (4 per cent) and lead (8.6 per cent) contents. This is similar to some of the white European beads (soda/lime) recovered from Magoro Hill (Koleini et al. Reference Koleini, Prinsloo, Biemond, Colomban, Nego, Boeyens, van der Ryst and van Brakel2016b).
Group 3, lead glass
The glass spectra of these beads (E-W5, E-W7) show strong peaks around 451–461cm−1 and 989–996cm−1. The stretching band of the spectra consists of a strong peak at 989cm−1 with a shoulder at 1045cm−1 (Figure 4a-4)—peaks characteristic of lead-based glass (Colomban et al. Reference Colomban, Tournié and Bellot-Gurlet2006). XRF measurement confirmed high mean quantities of lead (22.2 per cent), arsenic (17.8–20.5 per cent), potassium (3.2 per cent) and magnesium (4.3 per cent), and low mean quantities of aluminium (0.3 per cent) and calcium (1.5 per cent) (Table 1, group 3). These beads have a lower aluminium content than most of the lead arsenate beads from Magoro Hill (Koleini et al. Reference Koleini, Prinsloo, Biemond, Colomban, Nego, Boeyens, van der Ryst and van Brakel2016b), and a higher magnesium content than all such beads from Garumele, Niger (Robertshaw et al. Reference Robertshaw, Wood, Haour, Karklins and Neff2014) (Figure 5b). The low aluminium content indicates the use of pure quartz or flint pebbles as the source of silica in the European beads recovered from Baranda.
The soda content of lead arsenate glass is used as a temporal marker for European traded beads found in North America (Hancock et al. Reference Hancock, Aufreiter, Kenyon, Vandiver, Druzik, Merkel and Stewart1997). From the late eighteenth to early nineteenth centuries, there was a trend towards increasing glass soda content by decreasing the lead content. Both types of lead arsenate glass with high (E-W5) and low (E-W7, 8) lead content were recovered from the Baranda site (Figure 5b). The fluctuation in the amount of soda can be observed as non-detected elements that are reported as ‘balance’ by p-XRF in Table 1. The appearance of both types of lead arsenate glass Khami-IP beads in the same archaeological context suggests that they were imported to the site within a short timeframe.
Pigments, colourants, opacifiers and second phases/impurities
Lead arsenate with a strong peak at 826cm−1 is detected as a white pigment in the European white beads W5 and W7 (Figure 4a-4). This pigment was used in Venice from the late sixteenth century AD in the production of lattimo glass (Ricciardi et al. Reference Ricciardi, Colomban, Tournie and Milande2009a). Due to its toxicity, its usage only became widespread in the mid nineteenth century (Kirmizi et al. Reference Kirmizi, Colomban and Blanc2010a; Bonneau et al. Reference Bonneau, Moreau, Auger, Hancock and Émard2013). The occurrence of Khami-IP (fifteenth to seventeenth centuries AD) and lead arsenate beads at Baranda suggests that the latter probably had a Venetian origin, where the production of lead arsenate glass started earlier. Considering both the composition of glass (see Group 3, above) and the pigment, these beads were probably imported to the site at the end of the seventeenth century.
Un-dissolved sodium-rich feldspar (albite) was detected in one of the white Khami-IP beads (W4) (Figure 4b-1), with strong peaks at 291, 478 and 508cm−1, and medium peaks at 762 and 812cm−1 (Freeman et al. Reference Freeman, Wang, Kuebler, Jolliff and Haskin2008). Low furnace temperature and incomplete melting of the albite (which is often used as flux in glass production) is the reason for this. Un-melted feldspar is a common phase in ancient glass, and was also reported in some of the East Coast-IP and Khami-IP beads recovered from Mayotte Island (Fischbach et al. Reference Fischbach, Ngoa, Colomban and Pauly2016).
Lead tin yellow type II, with characteristic peaks at 131–133, 319–328 and 440–450cm−1 (Clark et al. Reference Clark, Cridland, Kariuki, Harris and Withnall1995), was detected in all of the yellow beads (Figure 4b-2). These yellow beads are composed of tin (0.4–0.6 per cent) and lead (2.5–3.7 per cent), but no antimony. The use of this yellow pigment began in antiquity and its presence was previously reported in green and yellow Mapungubwe oblates (AD 1240–1300), and Khami-IP and imported European beads (Prinsloo & Colomban Reference Prinsloo and Colomban2008; Tournié et al. Reference Tournié, Prinsloo and Colomban2012; Koleini et al. Reference Koleini, Prinsloo, Biemond, Colomban, Nego, Boeyens, van der Ryst and van Brakel2016b). The pigment is not, therefore, a temporal marker.
Although the green beads contained low amounts of tin (0.01–0.2 per cent) and lead (0.02–1.3 per cent), Raman measurements on different bead spot analysis could not detect any lead- and tin-bearing yellow pigment. In these beads, a combination of Fe3+ and Cu2+ had formed the green colour: adequate quantities of copper (0.4–0.5 per cent) and iron (2.6–4 per cent) were detected. The same combination of colourants is present in some of the green Khami-IP and blue-green K2-IP beads that were recovered from the Letsibogo (35-D3-1, Lephepe) and Toutswe (37-A3-1, Basinghall) sites in Botswana (Koleini et al. Reference Koleini, Prinsloo, Biemond, Colomban, Nego, Boeyens and van der Ryst2016a), respectively. Robertshaw et al. (Reference Robertshaw, Wood, Melchiorre, Popelka-Filcoff and Glascock2010) also pointed to the high iron content used as a colouring agent in the Indo-Pacific series.
Partially modified Naples yellow pyrochlore was detected in red Khami-IP bead R8 (Figure 4b-5), with characteristic peaks at 150 (vs), 330 (w), 458 (sh) and 508cm−1 (s) (Rosi et al. Reference Rosi, Manuali, Grygar, Bezdicka, Brunetti, Sgamellotti, Burgio, Seccaroni and Miliani2011). This pigment has a cubic pyrochlore structure in which the position of antimony can be replaced by zinc, iron and tin cations (Kirmizi et al. Reference Kirmizi, Colomban and Quette2010b). Raman spectroscopy can barely differentiate between various types of this pigment, as partial substitution and changes to firing conditions produce a similar effect. XRF measurement detected high iron content (4.6 per cent), traces of lead (0.1 per cent) and tin (156ppm), but no antimony. This makes the bead different from later European beads coloured with antimony-bearing Naples yellow pyrochlore. These yellow and green European beads recovered at Mapungubwe and Magoro Hill are coloured with Naples yellow in the form of lead-tin-antimony triple oxides and all are lead-based glass (Tournié et al. Reference Tournié, Prinsloo and Colomban2012; Koleini et al. Reference Koleini, Prinsloo, Biemond, Colomban, Nego, Boeyens, van der Ryst and van Brakel2016b). In Mesopotamia, Naples yellow, also called antimony yellow, was a synthetic pigment used in antiquity. All of the analysed red beads had high iron content (3.9–4.6 per cent), which acts as a reducing agent for copper ions. These precipitate as metallic particles (or cuprite) to form the brownish-red colour.
Calcium antimonite (CaSb2O6) was detected in bead E-W6 (Figure 4b-3), with typical peaks at 235 (w), 333 (w) and 670 (vs) (Ricciardi et al. Reference Ricciardi, Colomban, Tournié, Macchiarola and Ayed2009b). The bead contained 6.4 per cent antimony and 4 per cent calcium. The use of calcium antimonite as an opacifier began in Roman times (Ricciardi et al. Reference Ricciardi, Colomban, Tournié, Macchiarola and Ayed2009b), becoming widespread from the mid seventeenth to the eighteenth centuries, when it was replaced by tin-based opacifiers in Europe (Sempowski et al. Reference Sempowski, Nohe, Moreau, Kenyon, Karklins, Aufreiter and Hancock2000; Bonneau et al. Reference Bonneau, Moreau, Auger, Hancock and Émard2013). Calcium antimonite in the form of CaSb2O7 was detected in European blue, green and white beads recovered from Mapungubwe Hill (Tournié et al. Reference Tournié, Prinsloo and Colomban2012), and in blue-green, cobalt blue and white beads from Magoro Hill (Koleini et al. Reference Koleini, Prinsloo, Biemond, Colomban, Nego, Boeyens, van der Ryst and van Brakel2016b). Only one white European bead from Magoro Hill contained a combination of two forms of calcium antimonite.
Almost 0.1 per cent cobalt was used to form the blue colour in the dark blue beads, while lower amounts (100–150ppm) were detected in the light blue beads. The light blue beads contained copper (0.5–0.8 per cent) as the main blue colourant. The degree of concentration of cobalt to arsenic in blue beads ranges between 0.5 (minimum) and 0.8 (maximum), which is identical to some of the cobalt blue Khami beads recovered from Toutswe site 37-C1-8 in Basinghal, Botswana, and dated to 870±45 BP (Pta-9167) (Koleini et al. Reference Koleini, Prinsloo, Biemond, Colomban, Nego, Boeyens and van der Ryst2016a). According to Hancock et al. (Reference Hancock, McKechnie, Aufreiter, Karklins, Kapches, Sempowski, Moreau and Kenyon2000), this is typical of seventeenth-century glass coloured with Erzgebirge (Saxony) ores.
Anatase (TiO2) was observed in one of the Khami cobalt blue beads (Db5) (Figure 4b-4), all of which (except the European lead-based glass in group 3), contained titanium in the range of 0.1 to 0.2 per cent. Anatase is present as an impurity of raw materials in glass production, and was previously reported in Mapungubwe oblates (Prinsloo & Colomban Reference Prinsloo and Colomban2008).
Conclusion
All of the beads (except for the white European type), were composed of high aluminium glass, with more than 1.4 per cent potassium content. Generally, the beads comprised a lower percentage of calcium compared to aluminium. The iron content was also high (Table 1). The composition is similar to that of the soda glass from South Asia dating from the eighth to the nineteenth centuries AD, identified by Dussubieux et al. (Reference Dussubieux, Gratuze and Blet-Lemarquand2009). The morphology and composition of the beads, in addition to the luminescence dating of the site (sixteenth to seventeenth centuries AD), attest that the beads belong to the Khami-IP series. Raman spectroscopy confirmed that all the Khami-IP beads belonged to the soda group, except two green beads that belong to the soda/lime group. This might be as the result of the heterogeneous composition of these beads, or due to variations in manufacturing techniques.
Compositional consistency in many of the Khami-IP (soda group) beads proved that the majority of them were brought to the site from one source, and within a short period of time. This corresponds to the occupation history of the site, as reported by Pikirayi (Reference Pikirayi1993). Two of the Khami beads with higher potassium content (>3.5 per cent) have a similar composition to preceding IP series, suggesting other sources for them in South Asia. That there are considerably fewer European beads compared to the other types attests to their rarity and suggests that they were not the preferred bead type during the sixteenth- and seventeenth-century occupation at Baranda. This forced the Portuguese traders to import beads from sources in Asia during their early contact with southern African (AD 1505–1660) (Theal Reference Theal1898; Wood Reference Wood2011). Cambay and Negapatam in west and south-east India were reported as places of origins for traded beads in Portuguese historical documents (Theal Reference Theal1898; Wood Reference Wood2011).
Morphological and compositional similarity in the Khami-IP beads recovered from Baranda, Faure and Magoro Hill is indicative of trading connections between these archaeological sites. The only difference lies in higher amounts of lead and tin in the green Magoro Hill beads, compared to the green Baranda beads (which have a higher iron content). The similarity between some of the low-lead white European beads, which contain calcium antimonite pigments at Baranda and Magoro, suggests the same, earlier importation source (early Portuguese trading contact). The difference in composition of the white lead-based glass with arsenate at Magoro Hill shows another importation source, or a change in the date of trade.
The low quantity of European beads and their appearance in the same archaeological context as the Khami-IP series shows that both calcium antimonite and lead arsenate whites were present among early Portuguese trading beads. These beads were most probably imported to the site during the seventeenth century AD. The tendency towards European beads changed from the mid seventeenth century onwards, when similar beads dominate assemblages from the stone fortifications in the Mukaradzi Valley and adjacent mountains. Here, the ash middens excavated at the nearby Muchekayawa and Chenguruve hills attest to the dominance of European beads in the assemblages.
The bead series recovered at Baranda confirm the chronology of the site (Pikirayi Reference Pikirayi1993), as well as the history of the Indian trading port of Negapatam. This trading port was used by the Portuguese as a source of Indian glass beads since the early sixteenth century AD, although there is no archaeological evidence to suggest that the beads were directly manufactured there (Wood Reference Wood2011). The occupation of Negapatam by the Dutch in 1660 ended Portuguese trading of South Asian beads. Subsequently, no Indian beads were brought to southern Africa (Schofield Reference Schofield1938), and this coincides with the increasing number of European beads found in many archaeological sites on the Zimbabwe plateau interior (especially in northern Zimbabwe), as well as in the adjacent Zambezi Valley (Pikirayi Reference Pikirayi1993). It is possible that the beads imported to Portuguese feiras in Zimbabwe came through ports established along the east coast of southern Africa, such as Kilwa, Sofala and Mozambique Island. The port of Delagoa Bay was the entry point for European glass beads into the northern regions of South Africa and much of eastern Botswana and southern Mozambique. More research is required between Delagoa Bay and the central regions of Mozambique to locate some of the places referred to as ‘Sofala’, which may have served as ports for some of these trade goods destined for the southern African hinterlands.
This research confirms archaeologically the shifting patterns of trade in the northern and western Indian Ocean zones following the arrival of Europeans in eastern Africa and southern Asia. This happened during a period referred to as the early Atlantic Age, when Europeans began to have an impact beyond their continent in markedly significant ways, and, in the process, their commerce dictated the course of global events. Africans were active agents in the complex, interconnected and interdependent processes involving the spread of European commerce and early forms of European colonisation; they also underwent and experienced considerable change. More historical archaeological research needs to be conducted in combination with archaeological science approaches (such as those used in this paper) to understand the impact and consequences of such early-modern global interactions.
Acknowledgements
The authors would like to thank Marilee Wood for presenting representative beads from the site of Faure, kept in the van Riet Lowe collection, and for assistance with the morphological classification of the Baranda bead assemblage. We also thank Noémie Fischbach (Sorbonne Universités) and Leif Johansson (Lund University) for conducting Raman and EDS measurements. The National Museums and Monuments of Zimbabwe gave permission to study the glass beads from Baranda. Financial support from the National Research Foundation was received through grant UID 85178.
Supplementary material
To view supplementary material for this article, please visit https://doi.org/10.15184/aqy.2017.46


