


Introduction
The Isola di San Pantaleo is a small island off the coast of western Sicily. Its position within a protected natural harbour with easy access to the mainland made it an attractive location for settlement. The earliest documented occupation of the island dates to the Chalcolithic period (3500–2500 BC), followed by more substantial evidence for settlement in the second millennium BC contemporaneous with the Vallelunga and Thapsos Cultures of the Sicilian Early/Middle Bronze Age (seventeenth–thirteenth centuries BC) (Falsone Reference Falsone, Bonacasa and Buttitta1988a; Fresina Reference Fresina and Pisano1990; Nigro Reference Nigro and Guirguris2018). The island is best known as ancient Motya (present-day Mozia), an important waypoint for Phoenician expansion, originating in the Levant, and later a strategic node for the Punic maritime power of ancient Carthage. The early first-millennium BC settlement, established in the eighth century BC by merchants from the Phoenician homeland in the Levant, was probably an unfortified trading post rather than a new urban foundation (Niemeyer Reference Niemeyer and Hansen2000: 100). Settlement at Motya expanded from these humble beginnings to cover the entire 45ha of the island. By the sixth century BC, the settlement housed an estimated 15 000 inhabitants or more to become an important part of the Carthaginian Punic cultural sphere (Aubet Reference Aubet2001; di Mauro et al. Reference di Mauro, Alfonsi, Sapi and Urbini2014: 120).
Motya's rise mirrored broader changes in the Central and Western Mediterranean as permanent settlements founded by Phoenicians and Greeks centuries earlier grew into large fortified cities, often with military and territorial significance (Aubet Reference Aubet, Cunfliffe and Keay1995; Nigro Reference Nigro and Guirguris2018). Many of these cities were organised on an orthogonal ‘Hippodamian’ plan—once attributed to fifth-century BC Hippodamus of Miletus—in which rows of houses were separated by narrow alleys. Similar gridded urban plans, however, were established at sites in the Eastern Mediterranean, the Near East and Egypt centuries before it was supposedly formalised by Hippodamus (Zenzen Reference Zenzen, Flüchter and Schöttli2015). While this gridded layout was once accepted as a marker of colonial identity, the genesis of these plans and the identity or identities of its inhabitants are now being reconsidered (van Dommelen Reference van Dommelen1997, Reference van Dommelen2005).
In their report on the first scientific investigations at the site in the 1960s, Isserlin and du Plat Taylor (Reference Isserlin and du Plat Taylor1974) hypothesised that Motya's residential quarters, sanctuaries, public buildings, a market area, industrial workshops and open spaces were organised within a gridded, integrated plan during the sixth and fifth centuries BC. The city was surrounded by a massive fortification that followed the contours of the island's coastline, and was marked by four gates, which were oriented roughly according to the cardinal points. At the centre was a road that linked a causeway, which provided access to the mainland via a gate in the north (Porta Nord), to the Cothon, once considered a port and dry dock (Isserlin Reference Isserlin1971) and now interpreted as a sacred pool at the south of the island (Nigro Reference Nigro2009a). Isserlin and du Plat Taylor analysed aerial photography and conducted resistivity surveys to locate this street, thought to serve as the site's spinal axis (Figure 1). Although the application of these methods placed Motya at the vanguard of archaeological remote sensing, it yielded mixed and slightly contradictory results that were not resolved by excavation (Isserlin & du Plat Taylor Reference Isserlin and du Plat Taylor1974).
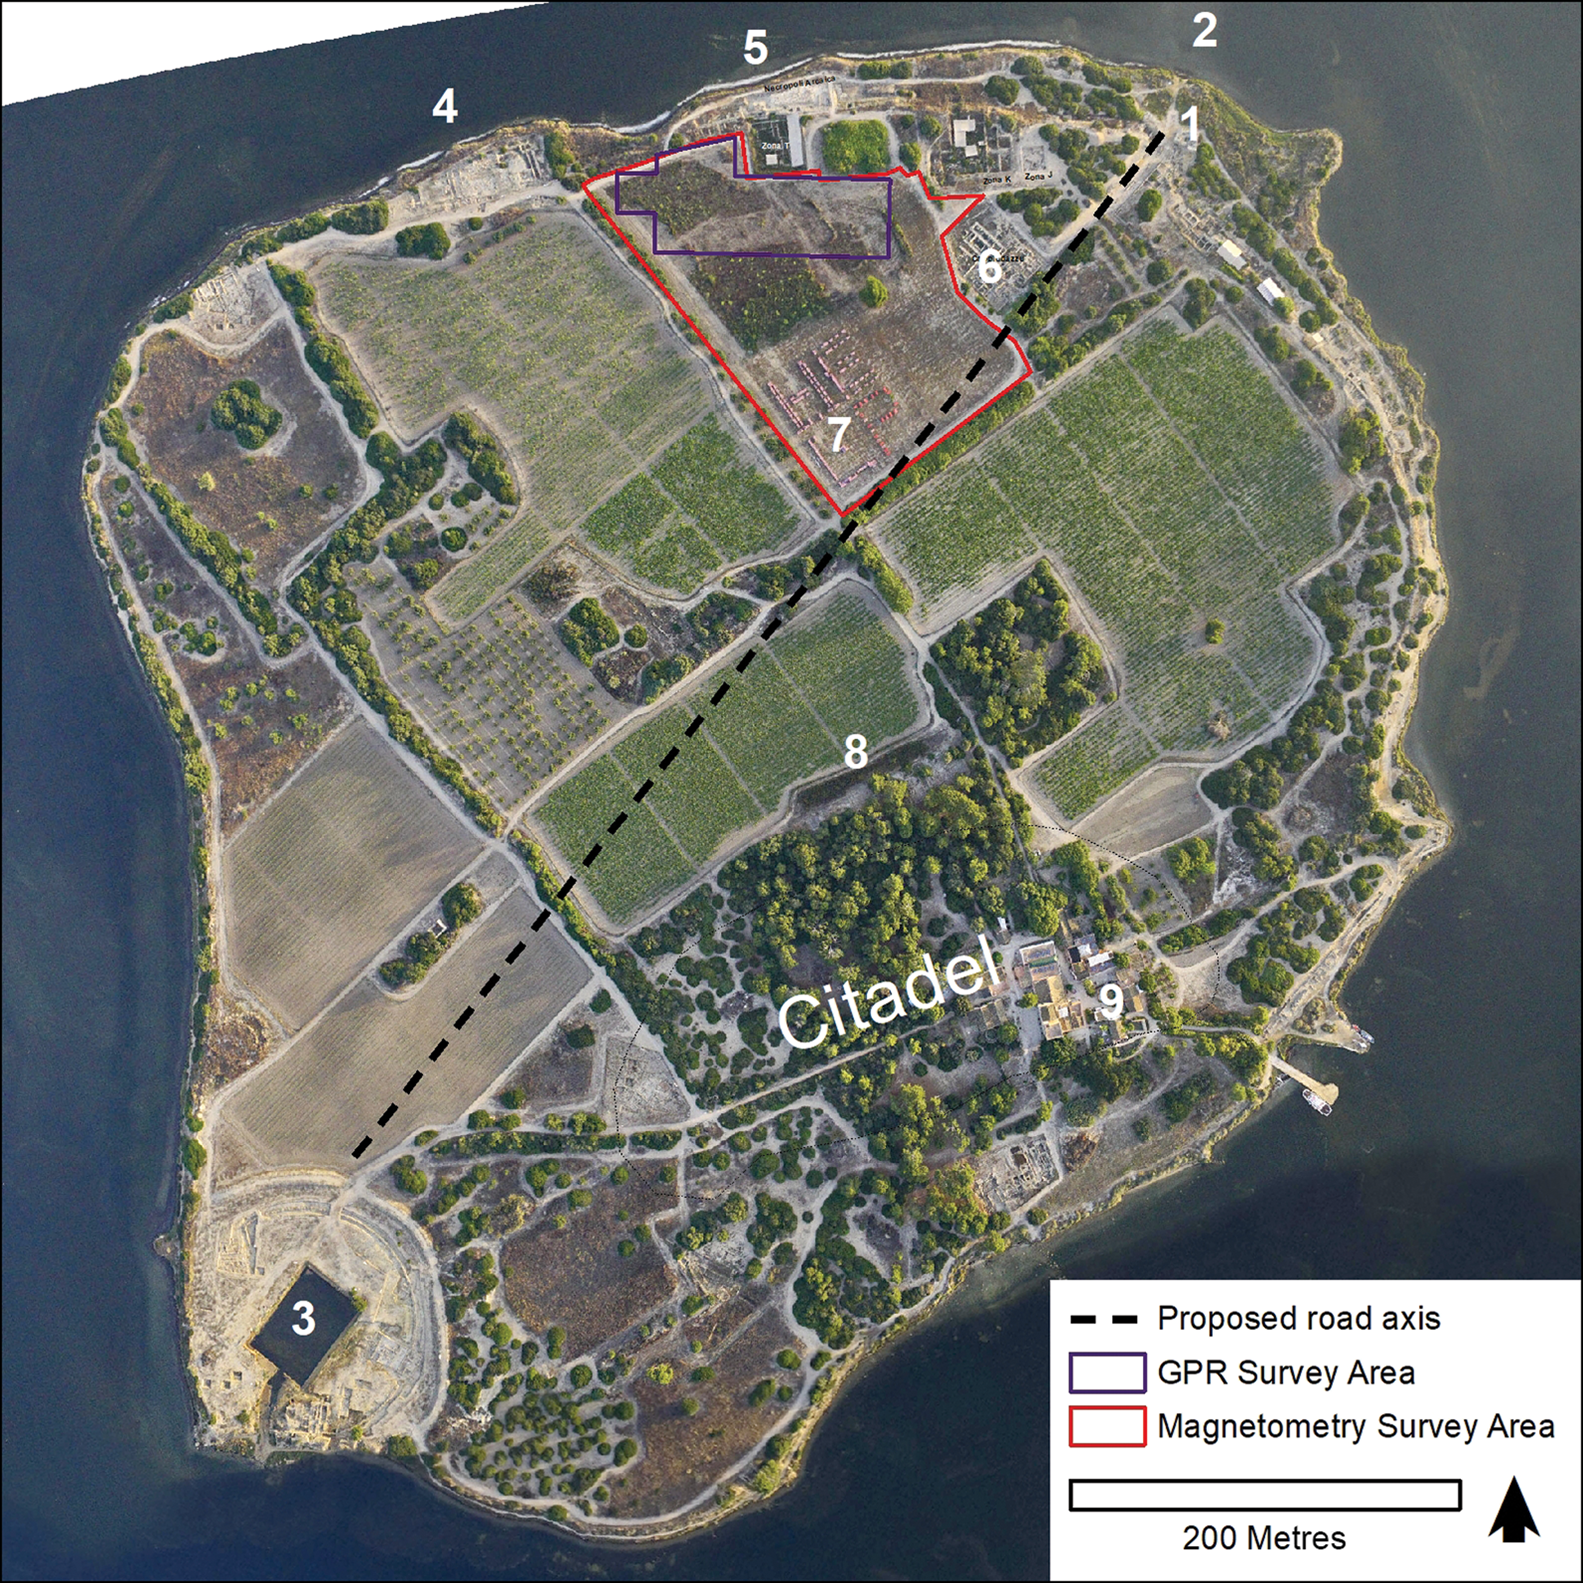
Figure 1. Aerial photograph of the Isola di San Pantaleo with the study area, approximate orientation of the central road axis as proposed by Isserlin and du Plat Taylor (Reference Isserlin and du Plat Taylor1974), and key features: 1) Porta Nord; 2) causeway to mainland; 3) Cothon and harbour; 4) Tophet; 5) necropolis; 6) Cappiddazzu sanctuary; 7) ‘Age of Plastic’ art installation; 8) zona A excavations; 9) museum and modern building complex (figure by J. Herrmann).
After Isserlin and du Plat Taylor's investigations, research in the decades that followed fleshed out knowledge of Phoenician and Punic Motya's built environment. Recently, a ring road that runs parallel to the fortification wall has been proposed based on the alignment and orientation of industrial compounds abutting the wall line (Falsone & Sconzo Reference Falsone and Sconzo2017: 62). This ring road is thought to have served not only for moving around the island, but also for demarcating an industrial zone on the settlement's periphery (Falsone Reference Falsone1989). Thought to be located in the island's interior, residential areas have received little attention and remain poorly understood, despite the considerable amount of research undertaken at Motya. Recent geophysical surveys approached from a geomorphological perspective demonstrate that archaeological geophysics can be effective for identifying these domestic areas, and for enhancing knowledge of Motya's urban plan. These surveys have tentatively identified the locations of a number of possible structures and thoroughfares (Sciotti et al. Reference Sciotti, Pastina, Colone, Cucciarelli and Nigro2004; di Mauro et al. Reference di Mauro, Alfonsi, Sapia, Nigro and Marchetti2011, Reference di Mauro, Alfonsi, Sapi and Urbini2014).
In 2017, the Universities of Tübingen and Palermo undertook fieldwork at Motya that included aerial and geophysical investigations of the north-eastern quarter of the island (Figure 1). Located immediately west of the Cappiddazzu sanctuary, this area is second only to the ‘citadel’ in elevation, and was the primary point of access to the island settlement. This survey was intended to document subsurface structures in the presumed residential areas between open excavation zones, providing a starting point for relating Motya's urban plan and architectural forms to broader patterns of architecture and spatial organisation in the Levant and Mediterranean.
The advantages of non-invasive and non-destructive techniques for recording subsurface features need little explanation. The geophysical survey of archaeological settlements has also transformed the way urban spaces are approached, by fostering comparative analyses of urban contexts, and by promoting diverse and holistic perspectives on settlements that make it possible to study non-elite and non-monumental contexts (Marcus & Sabloff Reference Marcus and Sabloff2008: 19; Fisher & Creekmore Reference Fisher, Creekmore, Creekmore and Fisher2014: 8; Donati et al. Reference Donati, Sarris, Papadopoulos, Kalaycı, Simon, Manataki, Moffat and Cuenca-García2017). Geophysical survey could be particularly useful for the study of Phoenician built environments, as complete or near-complete plans of formative Phoenician colonial settlements (from either excavation or geophysical prospection) are non-existent, given that many have been overwritten by later phases of occupation or by modern urbanism. The most famous examples are Gadir (Cadíz) and Panormo (Palermo), along with Tharros, Sulcis and Caralis in Sardinia, Utica in Tunisia and Leptis Magna in Libya (Fumadó Ortega Reference Fumadó Ortega2013). The abrupt abandonment of Motya following its siege and destruction by the Greeks of Syracuse in 397 BC (Diodorus Siculus: book XIV; Geer Reference Geer1954) means that archaeological remains dating to around the fifth century BC were not covered or destroyed by subsequent phases of settlement. Motya therefore represents a relatively uncontaminated space for geophysical survey.
Data collection
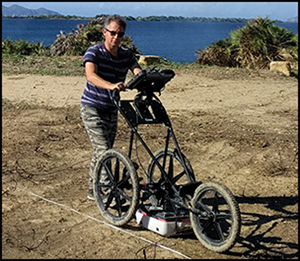
Before beginning the surveys, vegetation was cleared from the study area to facilitate the use of the geophysical equipment. Grid orientation was arbitrarily determined and laid out using real-time kinematic GPS, and rotated away from the orientation of the cultural features known from previous excavations (and from recent agricultural activity) so that their signature would not be lost during in-line data-processing (Figure 2).

Figure 2. (Top) field conditions after removal of vegetation; bottom (left) setting the survey grid; centre) magnetic gradiometry survey; right) GPR survey (photographs by J. Herrmann & P. Sconzo).
A Bartington Grad 601–2 was used for magnetic gradiometry survey of approximately 2.30ha of the area covered by our permit. The survey was carried out in 20 × 20m squares divided into transects with 0.50m spacing. Data were collected in a zig-zag pattern with 0.125m in-line resolution, before being processed in ArchaeoFusion software (Ernenwein et al. Reference Ernenwein, Hargrave, Cothren and Avery2014). Noise-reduction and contrast-enhancement steps included destaggering on an individual grid basis; zero median traverse; a mean profile filter (L 41, w 5); and despiking with a threshold of 1.5sd (Kvamme Reference Kvamme and Johnson2006). Finally, data were clipped to ±35nT, exported for display and interpretation at 0.125m resolution, and georeferenced within a GIS programme.
Ground-penetrating radar (GPR) survey was conducted using a GSSI SIR-4000 data logger, reading from a cart-mounted 350MHz hyper-stacking antenna. We covered approximately 0.50ha of the northern third of the gradiometry survey area, with transects spaced at 0.50m. GPR data were background- and bandpass-filtered and converted to squared amplitude for time-slicing. The survey data were smoothed by zero-mean-line filtering during time-slicing and enhanced with a mean-profile filter (Oimoen Reference Oimoen2000; Goodman & Klein Reference Goodman and Klein2011).
Aerial photographs collected from an unmanned aerial vehicle (drone) were used to produce an orthomosaic of the study area, and a microtopographic model of the surface was created using the structure-from-motion image technique (de Reu et al. Reference de Reu2013). The orthomosaic and topographic map helped us to interpret the geophysical anomalies by allowing us to discount variation in the geophysical datasets resulting from natural and modern surface features.
Magnetic gradiometry
The magnetic gradiometry survey results are the most immediately striking of the two geophysical datasets (Figure 3). The results reinforce earlier observations that the magnetic signatures of Motya's sediments and cultural deposits are quite subtle (standard deviation of magnetic intensity after processing is 4.3nT), but sufficiently robust to identify cultural features clearly (di Mauro et al. Reference di Mauro, Alfonsi, Sapia, Nigro and Marchetti2011, Reference di Mauro, Alfonsi, Sapi and Urbini2014).
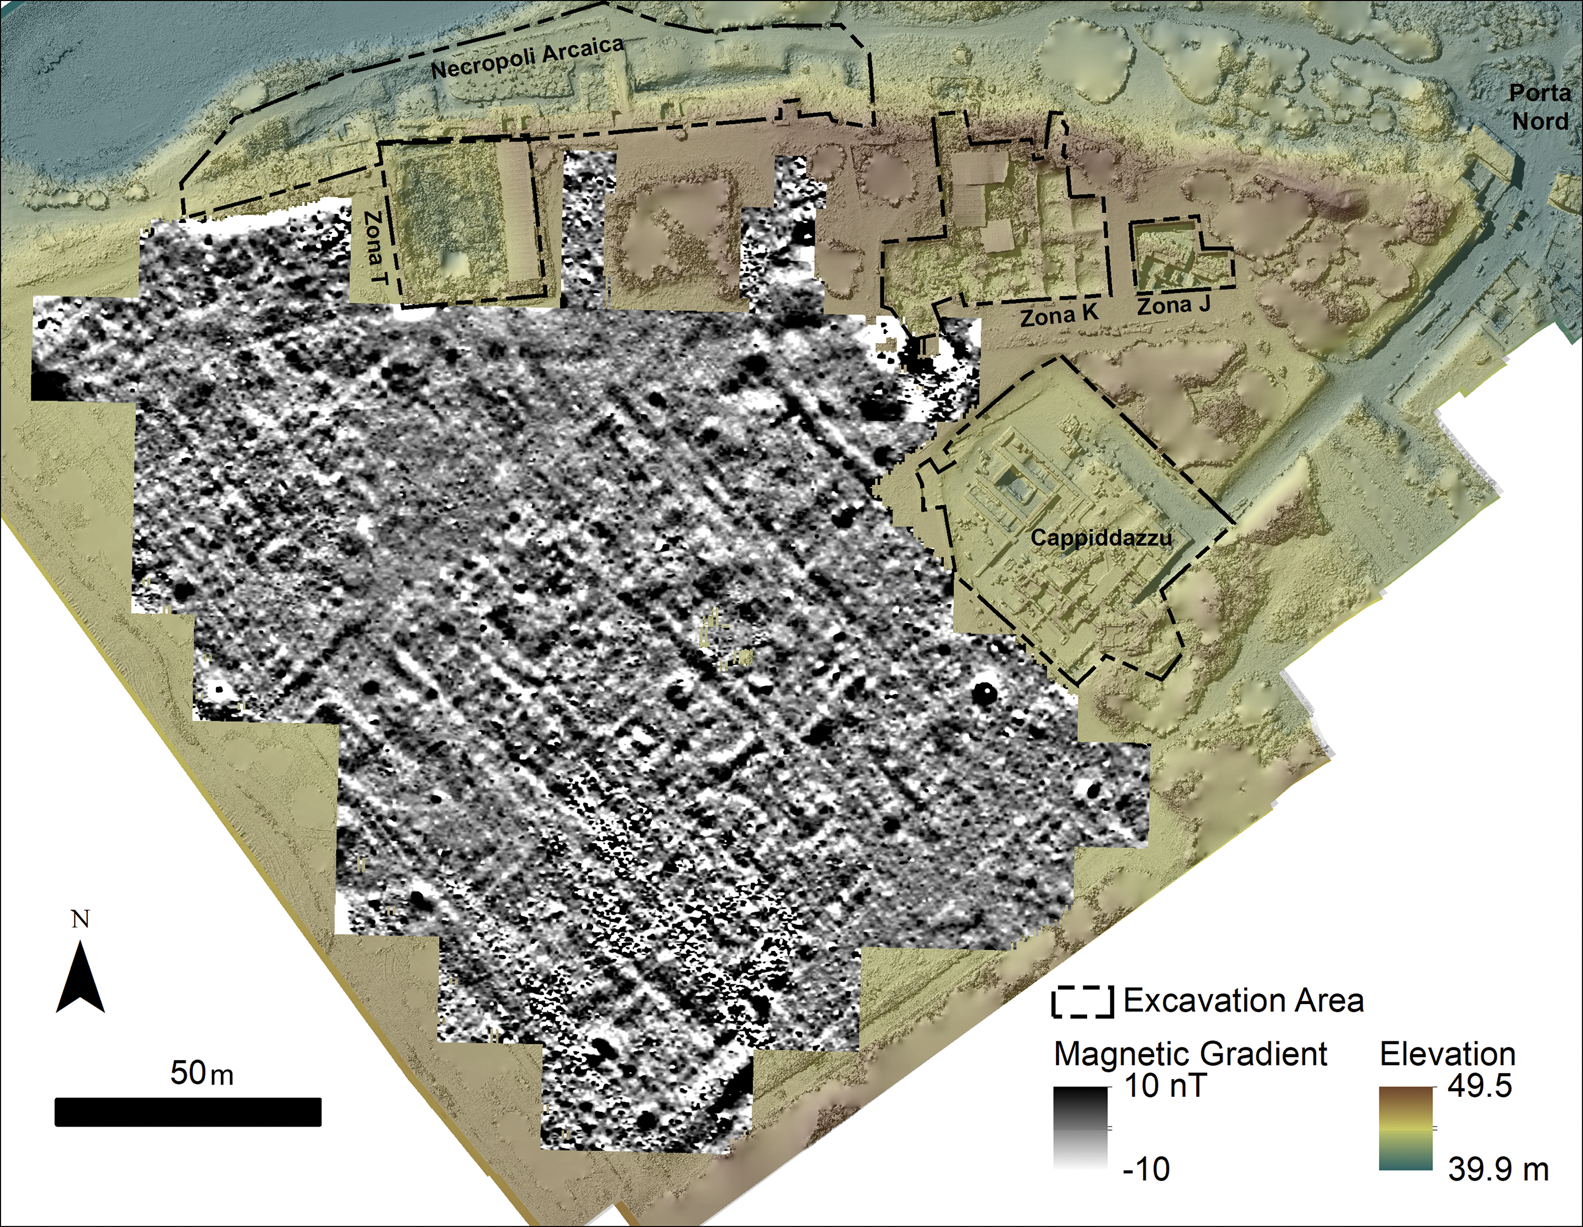
Figure 3. Magnetic gradiometry data presented at ±10nT from white to black with a 1σ palette stretch on a hillshaded DEM; excavation areas are also shown (figure by J. Herrmann).
Few archaeological sites are free of modern disturbance, and Motya is no exception. Magnetic ‘spikes’ pepper the gradiometry image, predominantly representing fragments of metal from viticulture or refuse left by visitors. The remains of a temporary public art installation in the southern corner of the gradiometry survey area had a significant influence. The word ‘HELP’ was spelled out in 20m-long letters made of wire boxes containing plastic bottle caps, and wired for night-time illumination. This statement against the proliferation of pollution (The Garbage Patch State 2018) is itself a source of pollution on this heritage site; the magnetic signatures of many small metal wire segments left from the dismantled installation obscure subsurface archaeological evidence over a surface covering approximately 250m2. Archaeological deposits in the north-western corner of the survey area near the Cappiddazzu were also obscured, where railings and signage for visitors generate strong magnetic fields.
One concern prior to magnetic survey was that agricultural furrows would obscure the orientation of the buried architecture. Fortunately, comparison of the gradiometry data with a hillshaded surface model confirms that the anomalies in the survey results primarily reflect the layout of ancient structures, rather than the course of modern paths, field boundaries or other agricultural features that exhibit rectilinear patterns, which tend towards a slightly different orientation. The interpretation of underlying archaeological features was hampered in the western margin of the survey area, where the magnetic signatures of a tractor road and the edge of the field were encountered, and in the northern central section of the area, with subtler anomalies or no anomalies of interest compared to the rest of the survey. As the GPR results show some evidence for buried archaeological features here, we deduce that the magnetic signatures of these archaeological remains are somehow obscured in this location.
Many buried walls appear clearly in the magnetic data image as strong negative anomalies (white on Figure 3, approximately −2 to −4nT), showing the layout of structures, the paths between them and the broad thoroughfares dividing blocks of buildings. Five long blocks of structures, referred to here as insulae, are located at the centre of the image, running parallel to the layout of the Cappiddazzu sanctuary, at approximately 45° west of north. These insulae measure approximately 100m in length; four are around 20m wide, and a fifth is about half the width of the others. Two of the insulae seem to be divided internally into at least four roughly square units; the external walls of some of these units are slightly out of line with their immediate neighbours, suggesting that each segment was built individually. Segmentation of the other insulae is less clear. Insulae are separated by alleys (ambitus) no more than 4m wide, apparently blocked in some places by walls that bridge individual insulae.
While the internal layout of individual segments is difficult to discern, some have common features. In at least three cases, the units within insulae contain two 6 × 6m subdivisions in the north-east and north-west corners, and what might be an open space in the southern end of the structure. Several circular magnetic features are also visible within these structures, all with a signature that is more intense than the surrounding features (4–16nT). These features could be ovens, whose magnetic signature has been enhanced through firing, or wells or storage areas rich in organic sediments.
Broader elements of the layout are evident in the wider survey data. At the south-eastern end, the road from the Porta Nord runs towards the island's interior, defining the south-eastern faces of the insulae. The south-eastern edge of this causeway may likewise be defined by the frontage of more insulae, although the results of the magnetic survey are unclear in this area. This causeway appears to be quite wide in the gradiometry, measuring almost 15m at the eastern end and tapering to about 10m in the west. The data suggest that a second road may define the northern boundary of the insulae. While it is not as wide as the road in the south, it is still approximately 10m wide.
The putative ring road that follows the external wall is visible in the north-western segment of the magnetic survey image. This feature is also broad, measuring around 8m in width, and is separated from the outer fortification wall by approximately 20m. This road would have delineated the industrial belt between the external fortification wall and a secondary parallel inner ring road (Falsone & Sconzo Reference Falsone and Sconzo2017).
GPR survey
GPR survey produces a record of how well different materials below ground reflect electromagnetic waves. The depth of reflections of archaeological interest must be calculated by an extra step, as the GPR receiver only records the time that it takes for the energy to be introduced into the ground from a transmitter and to be reflected back to a receiver. The depth of features that were mapped with GPR at Motya was determined through a process called hyperbola fitting. In this process, we analysed the shapes of reflected anomalies in the radar data to derive a constant—called relative dielectric permittivity (RDP)—that characterises the velocity of the electromagnetic waves through a material. The RDP in the survey area was found to be ~13, and this was used to determine the velocity of the radio energy (0.084m/s) to convert the return travel time to a distance measurement. Our analysis shows that wave velocity varied slightly during data collection, probably influenced by intermittent periods of rain that occurred during the survey. The generalised velocity reported here is comparable to that from earlier surveys on the island that were also determined through hyperbola fitting (di Mauro et al. Reference di Mauro, Alfonsi, Sapi and Urbini2014: 117).
The arrangement of structures observed in the gradiometry survey is also apparent in the GPR data, even in the shallowest time slices. A general structural orientation is visible as diffuse areas of high reflection at 0.20mbs (metres below surface; Figure 4), but details are difficult to discern; archaeological remains at this depth may be heavily disturbed by agricultural activities. The organisation of subsurface features can be observed from the arrangement of large, nebulous anomalies that seem to indicate the points at which intact walls join, based on deeper time slices. The clearest lines in this shallow slice are found in the south-eastern corner of the survey area, and correspond with the edge of the northern road that delineates the insulae in the magnetometry data.
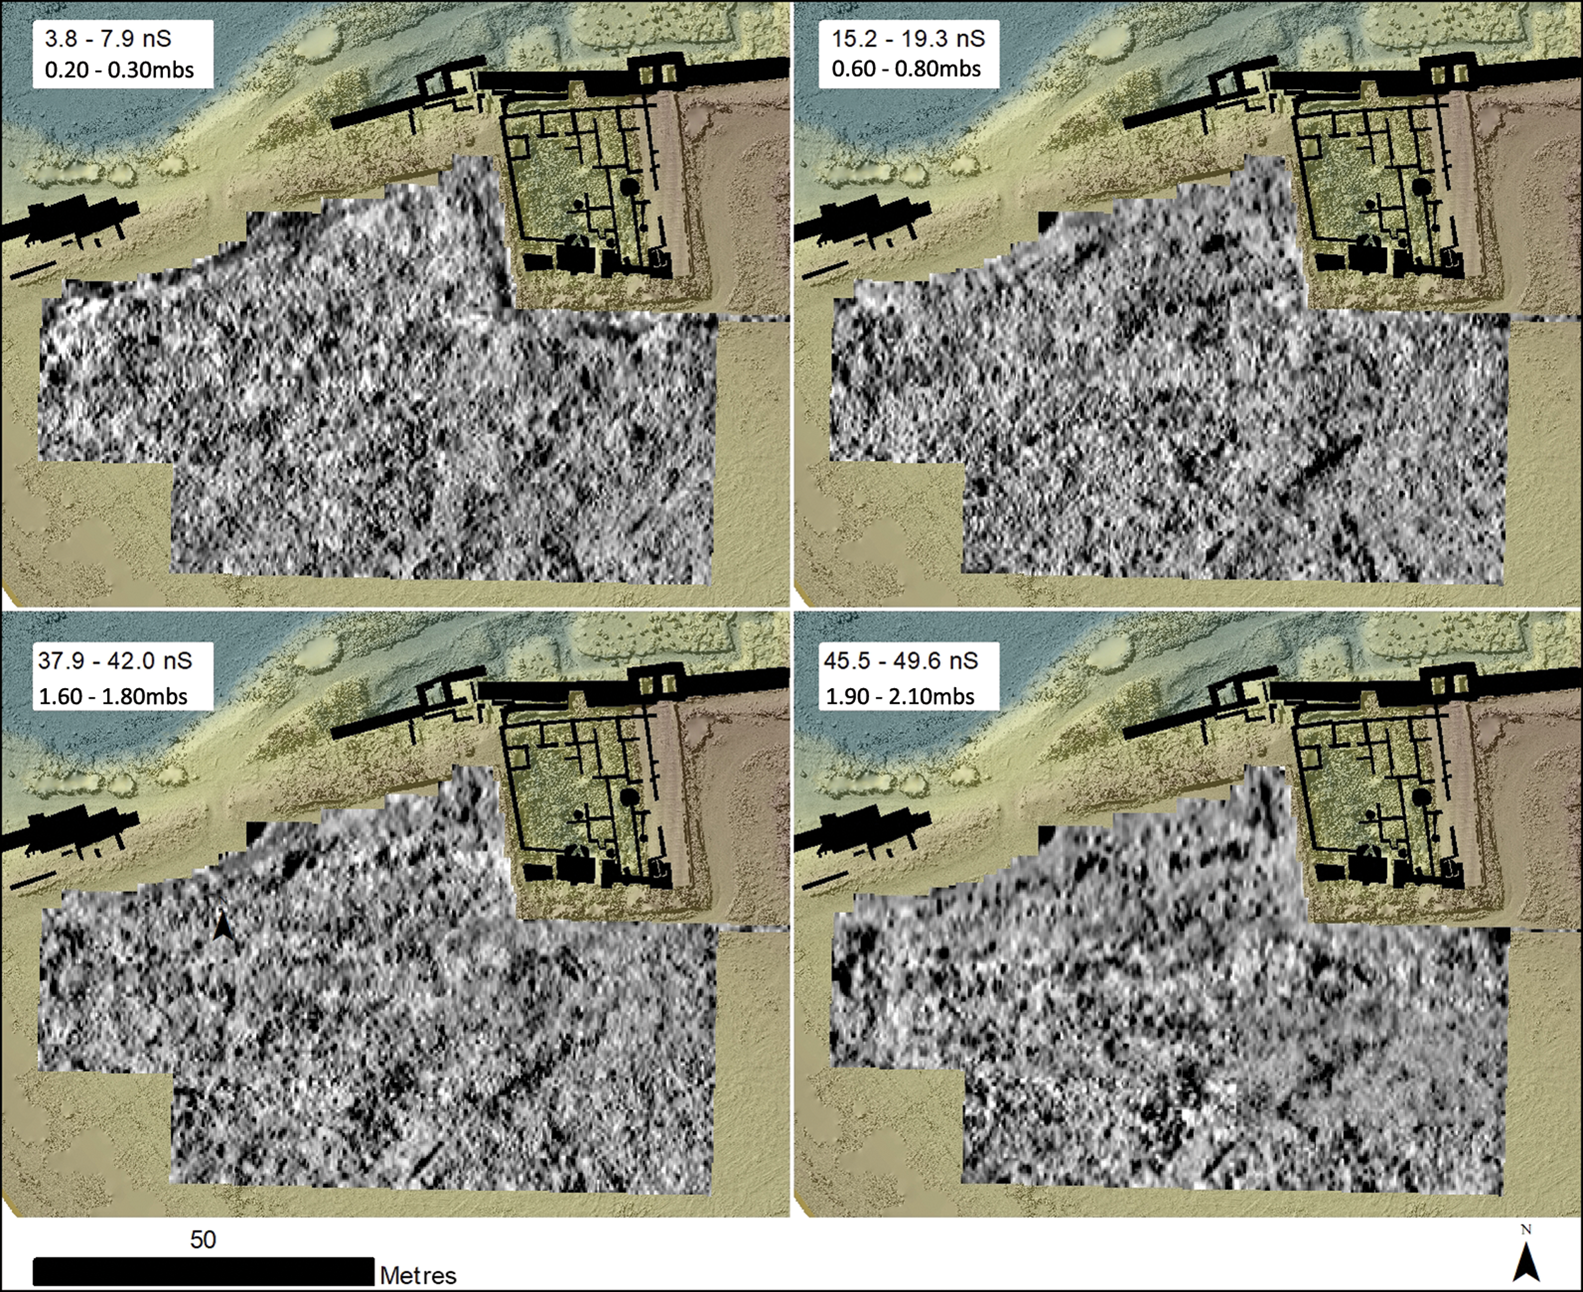
Figure 4. Four GPR time slices on a hillshaded DEM; the excavation area of zona T is also shown (figure by J. Herrmann).
Anomalies representing subsurface features sharpen in deeper slices, where sediments surrounding archaeological features may be more homogeneous and remains are more likely to be intact. At approximately 0.60mbs (Figure 4), continuous lines delineating the contours of a room or cluster of room blocks are visible, particularly in the south-western end of the survey area, where two blocks can be seen. One is approximately 8.50m2, and a second to the west measures approximately 8.50m × 17m. The course of the ring road is also visible in the east end as a wide anomaly corresponding with its approximate centre, although it is less clear than in the magnetic data.
Deeper slices show many of the same wall orientations but with some difference in their appearance. In some cases, a clean, distinct line marks the extent of rooms and structures, as shown in the southern and western halves of the 1.60–1.80mbs time slice (Figure 4: bottom left). In other cases, the courses of walls are suggested by lines of dots. These possibly represent the ‘pier and rubble’ or opus africanum construction method commonly recorded at Motya. In this construction style, rubble core walls span the distance between tall, sometimes monolithic piers that define the corners and intermittent points along the walls (Rakob Reference Rakob1983; Fantar Reference Fantar1984: 335–44).
Broader rectangular areas in the GPR survey may represent building footprints or floors inside structures, visible particularly in the southern end of the survey area, particularly at a depth of 1.60–1.80mbs (Figure 4: bottom left). These footprints seem to define the northern boundary of another possible passage, running south-west to north-east and bounded to the south by a strong linear anomaly. These anomalies begin to fade at approximately 2.00mbs, slightly deeper than the features recently exposed in the excavations of zona J (Figures 4–5; location of zona J on Figure 6) (Falsone & Sconzo Reference Falsone and Sconzo2017).

Figure 5. Two visualisations of the GPR data: A) the first principal component of three time slices between 3.8 and 19.3ns (estimated 0.20–0.50m below surface); B) the first component of three time slices between 37.9 and 49.6ns (estimated 1.6–1.9m below surface) (figure by J. Herrmann).
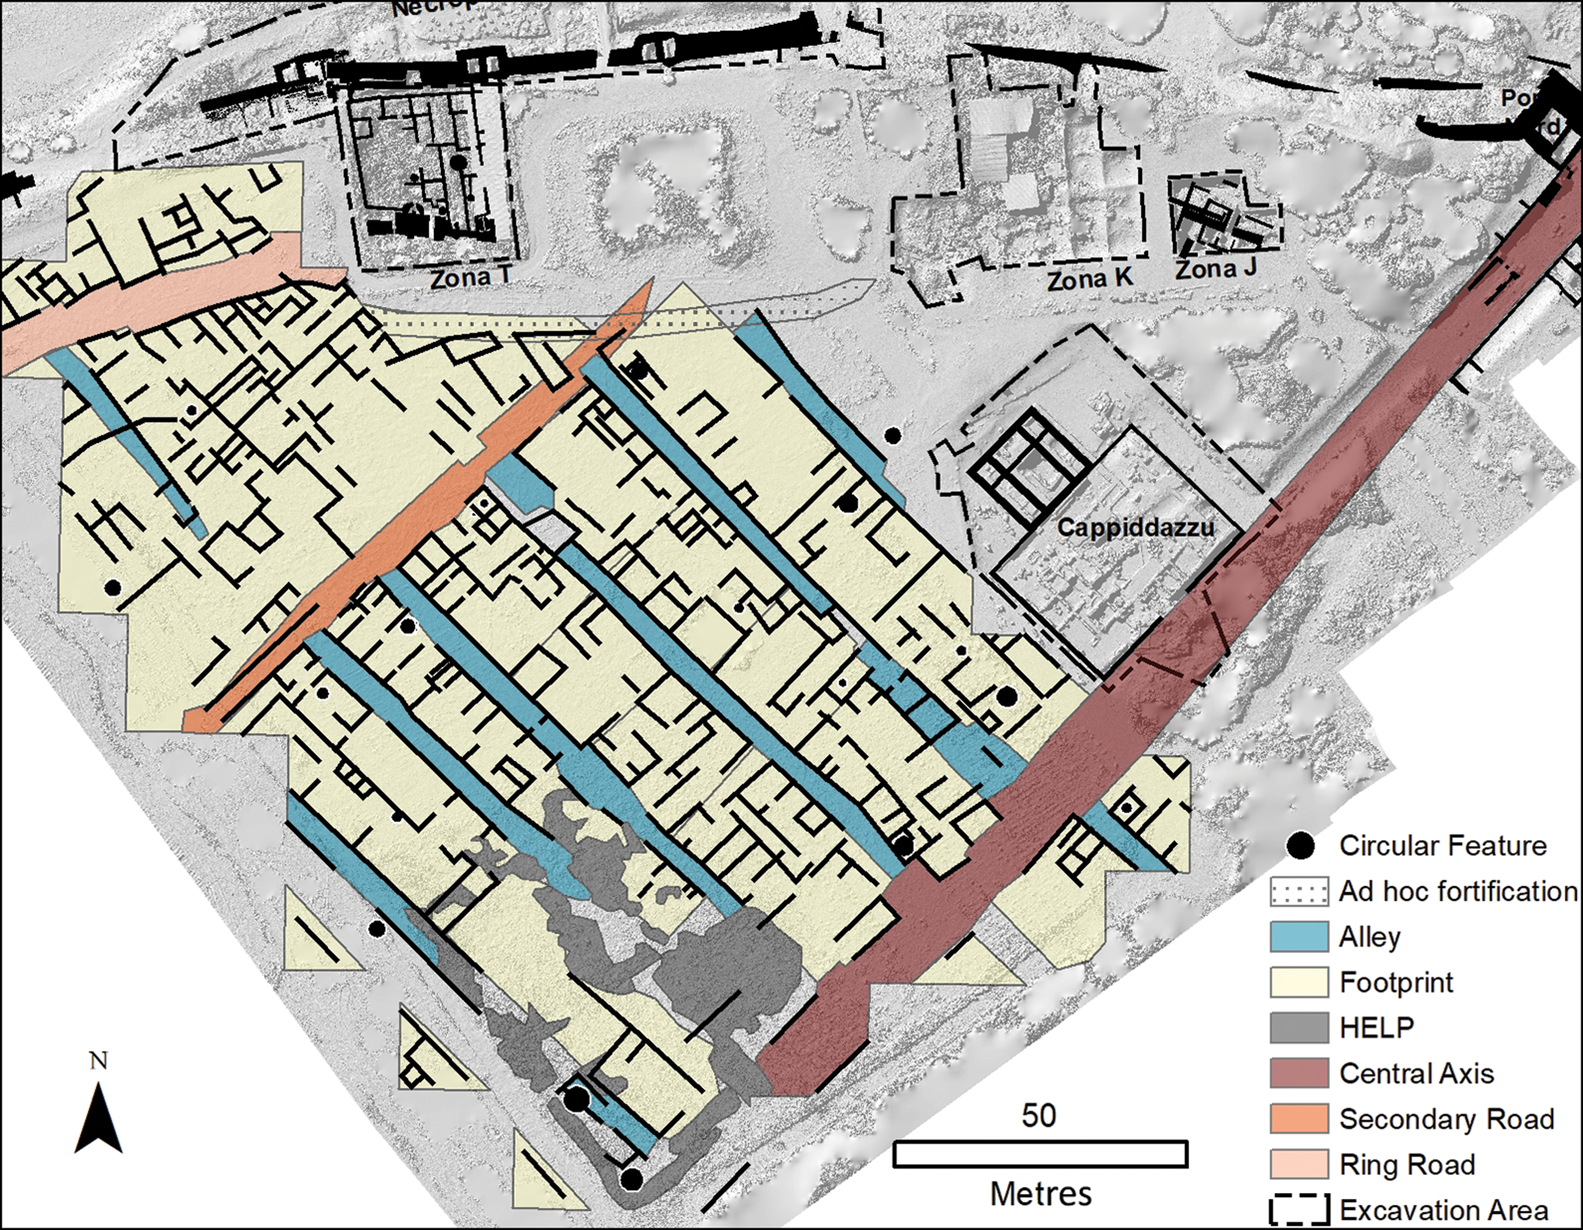
Figure 6. Interpretation of the magnetic gradiometry data (figure by J. Herrmann).
The GPR data do not show the change in building orientation to the north of the ring road that seems to be visible in the gradiometry data, leaving the interpretation of this area open (Figure 4). The GPR results do, however contribute to our understanding of the plan in the north-central part of the magnetic survey, where the magnetic intensity map was unclear (Figure 5).
Interpretation
The results of the geophysical surveys enhance the island-wide site plan first recorded by Isserlin and du Plat Taylor (Reference Isserlin and du Plat Taylor1974), adding several elements to the layout, and providing context for architectural patterns seen in unconnected excavation areas. The central road axis that runs from the Porta Nord towards the centre of the island, faced on the north side by the insulae and the temenos (sacred enclosure) of the Cappiddazzu sanctuary, and on the south by probable additional insulae extending southwards, corroborates the proposed site layout (Figures 6–7). A second road may also be present on the northern edge of the insulae and Cappiddazzu, a feature that is clearer in the magnetic data than the GPR.

Figure 7. Interpretations of the GPR time slices shown in Figure 5 with schematic interpretation from the magnetic gradiometry: A) the first principal component of three slices between 3.8 and 19.3ns (estimated 0.30–0.50m below surface); B) the first component of three time slices between 37.9 and 49.6ns (estimated 1.40–1.50m below surface) (figure by J. Herrmann).
Our geophysical survey confirms Isserlin and du Plat Taylor's (Reference Isserlin and du Plat Taylor1974: 87) observation that at least part of Motya was organised on a variation of the Hippodamian plan. The insulae correspond closely in size and form to the domestic building reported by Famà (Reference Famà2002) in the zona A excavations at Motya, including segmentation into blocks of roughly equal size and discontinuity in the external wall lines (Figure 8d). This evidence thus reinforces the hypothesis that this was a residential quarter.

Figure 8. Representative plans from related Mediterranean settlements: a) Olynthus, Greece, 423 BC (Cahill Reference Cahill2008); b) Selinus (Selinunte), Sicily, 409 BC (Mertens Reference Mertens2003: fol. 6); c) Himera, Sicily (Mertens & Schützenberger Reference Mertens and Schützenberger2006); d) Motya, zona A (Famà Reference Famà2002); e) Kerkouane, Tunisia (Fantar Reference Fantar1984); f) Beirut, Lebanon, late sixth century BC (Elayi & Sayegh Reference Elayi and Sayegh1998: fig. 64); g) Motya, gradiometry (Figure 3); h) Motya, interpretation (see Figure 6) (figure by J. Herrmann).
The correspondence in the size and orientation of the closely packed compounds with the Cappiddazzu temenos wall (built around 550 BC) to the east suggests a similar date of construction, as early as the late sixth century BC, for the compounds that nearly abut the Cappiddazzu to the west. The geophysical data for the area immediately north of the Cappiddazzu are difficult to interpret, although the pottery workshop, or ‘kerameikos’, exposed in the adjacent zona K excavations in the 1980s, was shown to abut the outer fortification wall on its north side and to have no structures on its south side, suggesting an absence of buildings there (Falsone Reference Falsone1989). As such, the ring road may have met open space here—north of the Cappiddazzu—forming a plaza similar to that observed at the junction of a ring road with orthogonal architecture at Kerkouane in Tunisia (Fantar Reference Fantar1984) (Figure 8e). At Motya, this space was filled with a thick layer of debris following its destruction in 397 BC (Falsone Reference Falsone, Bonacasa and Buttitta1988a; Spanò Giammellaro Reference Spanò Giammellaro and Pisano1990).
The orientation of the fortification wall in much of the study area does not differ dramatically from the architecture recorded farther inland. Structures north of the ring road, however, do seem to be oriented on the contours of the external wall, rather than the inland grid. A clear difference in orientation in the architecture in zona J, to the east of the geophysical survey area, suggests that buildings north of the ring road were perpendicular to the fortification wall.
Finally, it should be noted that evidence of an historical event may be visible in the gradiometry data (Figure 6). A line with stronger negative magnetism leaves zona K and crosses the top half of the image, crosscutting the grid of structures and roughly following the contour of the shoreline. We interpret this anomaly as a possible extension of an ad hoc fortification wall observed in zona K, constructed of robbed materials filling several rooms. Falsone (Reference Falsone1988b) has proposed that this wall represents part of a desperate effort to secure the island during or immediately after the siege and conquest of Motya in 397 BC.
Summary and discussion
Geophysical survey at Motya has helped to connect the plans of visible structures in disconnected excavation areas, and provides a picture of urban organisation in this important sector of the settlement. A late sixth-century BC terminus post quem for the complex thus revealed is probable, based on the shared orientation of the architecture revealed in the surveys and in features of the Cappiddazzu sanctuary. Evidence for prior settlement in this north-eastern corner of the island is sparse (Nigro Reference Nigro and Guirguris2018); it is thought to have remained largely undeveloped before the construction of the features in zona J and zona K, the monumental phases of the Cappiddazzu and perhaps the newly mapped insulae.
The orthogonal plan at Motya, first recognised by Isserlin and du Plat Taylor (Reference Isserlin and du Plat Taylor1974: 83–96), and a recurring theme in Iron Age Mediterranean urban contexts (Fumadó Ortega Reference Fumadó Ortega2013: 269), does not indicate that the residents of the island were of Greek ethnicity, nor is it evidence of a Greek central authority. If the orthogonal layout at Motya was established in the second half of the sixth century BC, it would fit the trend of re-foundation on orthogonal plans at major Phoenician-Punic sites in the Western Mediterranean in roughly the same period or slightly later, seemingly pre-dating more famous examples in the Aegean (Figure 8). It would also coincide with the establishment of monumental works at Motya, including the fortification wall and the first monumental phase of the Cappiddazzu (Nigro Reference Nigro, Helas and Marzoli2009b, Reference Nigro and Guirguris2018).
As more examples of orthogonal settlement plans come to light in the Eastern Mediterranean (Elayi & Sayegh Reference Elayi and Sayegh1998), the origins of the Hippodamian plan are being reconsidered as an innovation that was as much Phoenician as Greek (Zenzen Reference Zenzen, Flüchter and Schöttli2015), or as one that originated in the Levant or farther east (Niemeyer Reference Niemeyer and Hansen2000: 108; Shalev & Martin Reference Shalev and Martin2012). A sixth-century BC construction date for the structures mapped at Motya could be taken as supporting the idea of a Levantine origin for the establishment of orthogonal urban plans across the Mediterranean, as the Motya evidence would pre-date the recorded formalisation of the idea (Zenzen Reference Zenzen, Flüchter and Schöttli2015). Although gridded settlement plans are documented in earlier periods in the Mediterranean, such as at Bronze Age Enkomi (Cyprus; Courtois Reference Courtois, Muhly, Maddin and Karageorghis1982) and Middle Kingdom Kahun (Egypt; Petrie & Sayce Reference Petrie and Sayce1891; Kemp Reference Kemp2006), their connection to sixth-century BC Phoenician and Punic urban planning is tenuous. There are competing perspectives on the organisation of the early Phoenician settlements of the Western Mediterranean. Whereas some scholars see an absence of centralised urban planning (e.g. Fumadó Ortega Reference Fumadó Ortega2013: 265), others suggest that eighth- and seventh-century BC Phoenician foundations show an internal coordination reminiscent of contemporaneous Levantine cities (e.g. Smith Reference Smith2007: 16).
It is the coordination of space within a grid that links sixth- to fourth-century BC sites across the Mediterranean into a single community of practice. From the Levant to Spain, domestic structures have a common size and form, comprising a chain of roughly square cells in rows of four or five (Figure 8). Excavations at Olynthus in north-western Greece, for example, demonstrate that each square was built independently, often with different construction styles from square to square within a single block (Cahill Reference Cahill2008: 202). This pattern has been confirmed through analysis of the architectural forms in excavations at other sites, including Motya (Famà Reference Famà2002).
As for the identity of the occupants of this domestic quarter of Motya, the evidence is sparse, but archaeogenetic studies appear to suggest that the populations of Motya and similar sites in the Western Mediterranean were heterogeneous, with the genetic contribution from local populations outweighing that of ‘Phoenician’ or otherwise ‘Levantine’ origin (Zalloua et al. Reference Zalloua2008; Matisoo-Smith et al. Reference Matisoo-Smith2018). Perhaps the standard-sized insulae comprising individual structures with different construction styles at Motya reflect a system of allotment for urban settlers that is shared at sites throughout the Mediterranean.
The large-scale excavation of archaeological remains at sites such as Motya is increasingly rare and difficult to justify. Instead, non-invasive techniques—such as the geophysical survey reported here—supported by evidence from excavations, remain one of the few paths towards increasing our understanding of how the configuration of the built environment reflects identity and changing circumstances, including colonisation, in the Phoenician and Punic world.
Acknowledgements
This research was funded by the Gerda Henkel Foundation (AZ 26/V/17) and supported by the Soprintendenza per i Beni Culturali ed Ambientali of Trapani (authorisation 5715/4 of 13 May 2020) and the Whitaker Foundation. This manuscript expands ideas proposed by Gioacchino Falsone, director of the Palermo expedition to Motya, who, along with Virginia Herrmann, provided valuable discussion and commentary. Ralf Beutelschieß, Martina Di Giannantonio, Andrej Girod and Tiziana Genna assisted with fieldwork, and the Genna family provided logistical assistance. Survey equipment was loaned by the e-Science Center and the Institute for Ancient Near Eastern Studies at the University of Tübingen.


