


Introduction
Roughly corresponding with present-day Colombia, north-west South America is a region characterised by substantial geographical diversity, including the Andean mountain ranges, inter-Andean valleys, rain forests and grass-covered plains. Previous studies have highlighted remarkable palaeoenvironmental and palaeoclimatic changes in this region over the last 22 000 years (e.g. Marchant et al. Reference Marchant2002). This biogeographic and palaeoecological diversity fostered the development of a wide range of dietary adaptations and subsistence strategies for humans who inhabited these disparate and changing environments over the course of the Holocene.
The available archaeological evidence suggests that humans had occupied most of these diverse ecosystems since the Late Pleistocene (16 000 cal BP) (Delgado et al. Reference Delgado, Aceituno and Barrientos2015). Other than the Sabana de Bogotá in the eastern Cordillera, none of these regions, however, has produced sufficient archaeological evidence for constructing a chrono-cultural sequence that ranges from 16 000–3800 cal BP. Previous studies suggest that early Sabana de Bogotá foragers comprised specialised groups who relied mostly on animal resources. These groups remained economically undifferentiated until the Middle/initial Late Holocene, when horticulturalists arrived from tropical lowlands and subsequently became specialised agriculturalists (Correal & van der Hammen Reference Correal and van der Hammen1977; Correal Reference Correal1990; van der Hammen et al. Reference van der Hammen, Correal and van Klinken1990). Recent interpretations strongly criticise this linear model and suggest alternative scenarios to explain the diachronic Holocene human dietary and subsistence change in the Sabana de Bogotá region (Cárdenas Reference Cárdenas2002; Delgado Reference Delgado2018).
While these studies provided a general outline of the dietary diversity of early foragers and specialised agriculturalists in the Sabana de Bogotá region, they offered no information on temporal variations in diet composition. Now, new isotopic data and a complete isotopic ecology (Delgado et al. Reference Delgado, Langebaek, Aristizabal, Tykot, Johnson, Luna, Aranda and Suby2014; Archila & Langebaek Reference Archila and Langebaek2015; Miller Reference Miller2016; Triana Reference Triana2019) enable detailed dietary reconstructions using more sophisticated statistical methods. The aim here is to investigate the differential contribution, in proportional terms, of distinct vegetal and animal resources to human diets in the Sabana de Bogotá throughout the Holocene (9000–550 cal BP), using traditional and Bayesian mixing stable isotope models. This research illuminates the evolution in human diet and subsistence that took place in the Northern Andes over the Holocene, contributing to an important chapter in the prehistory of the Americas.
Stable isotopes as dietary proxies and Bayesian mixing models
Quantitative dietary information at the individual level can be obtained through the analysis of the chemical composition of human tissues. This is because, in principle, the isotopic composition of food groups is transferred through the diet and recorded in consumer tissues (Katzenberg Reference Katzenberg, Katzenberg and Saunders2008). Stable isotopes are useful dietary proxies commonly used in palaeodietary reconstruction (Price & Burton Reference Price and Burton2011; Tykot Reference Tykot and Smith2018). Different food resources have distinct ratios of the stable isotopes of carbon (13C/12C) and nitrogen (14N/15N). Carbon isotopic diversity can be used to distinguish C3, C4 and CAM (crassulacean acid metabolism—a form of photosynthesis of plants such as succulents) photosynthetic pathway plant foods, animals feeding on those plants, and animals in terrestrial and marine ecosystems (Katzenberg Reference Katzenberg, Katzenberg and Saunders2008; Tykot Reference Tykot and Smith2018). Plants with C3 and C4 photosynthetic pathways produce 13C-depleted and -enriched δ13C values, respectively (Price & Burton Reference Price and Burton2011). While δ13C values of C3 plants average −26‰ and include temperate grasses, trees, fruits and tubers, C4 plants average −12‰ and include maize, chenopods, setarias and some amaranths. CAM plants have δ13C values that cover the entire range of C3 and C4 plants, and include cacti, bromeliads and succulents (Tykot Reference Tykot and Smith2018). Nitrogen isotopes generally reflect differences in trophic level between plants, herbivores and carnivores, and distinguish between most terrestrial and marine organisms (Katzenberg Reference Katzenberg, Katzenberg and Saunders2008). Given that edible C4 plants were largely absent in the highland conditions of the Sabana de Bogotá (Mora & Pratt Reference Mora and Pratt2002), C4 signatures in humans and in some animals in this study are interpreted as providing evidence of maize consumption. Three dietary proxies (δ13Ccollagen, δ15Ncollagen and δ13Cbioapatite) derived from human, animal and plant tissues were investigated.
Bayesian mixing models, such as FRUITS (food reconstruction using isotopic transferred signals; Fernandes et al. Reference Fernandes, Millard, Brabec, Nadeau and Grootes2014), are particularly useful for isotope-based dietary reconstructions, as they provide a platform for handling multiple sources of uncertainty, such as the isotopic composition of potential food groups, diet-to-tissue offsets and dietary routing (Parnell et al. Reference Parnell, Phillips, Bearhop, Semmens, Ward, Moore, Jackson, Grey, Kelly and Inger2013; Fernandes et al. Reference Fernandes, Millard, Brabec, Nadeau and Grootes2014; Killian Galván Reference Killian Galván2018). FRUITS also allows for the estimation of the proportions of several dietary resources, incorporating available prior information and providing posterior probability distributions for each resource (Fernandes et al. Reference Fernandes, Millard, Brabec, Nadeau and Grootes2014). Estimates generated by FRUITS include the relative calorie contribution from available food groups, levels of protein intake and the relative protein contribution from each food group (Fernandes et al. Reference Fernandes, Millard, Brabec, Nadeau and Grootes2014). These estimates quantify the relative dietary intake, expressed as calorie contributions, of food groups. As with any Bayesian mixing model, FRUITS nevertheless has some limitations and requirements. These include the need for a detailed baseline definition of nutrient and isotopic composition of food groups; the use in analysis of similar quantities of food groups and dietary proxies; and, in some cases, using as many dietary proxies as possible and different stable isotope values for the food groups investigated (Kadoya et al. Reference Kadoya, Osada and Takimoto2012; Erhardt & Bedrick Reference Erhardt and Bedrick2013; Fernandes et al. Reference Fernandes, Millard, Brabec, Nadeau and Grootes2014). FRUITS is a useful tool for establishing accurate food intake estimates in diet reconstruction in archaeology (for detailed information, see the online supplementary material (OSM)).
The environmental scenario and samples investigated
The Sabana de Bogotá is an intermontane depression located on the eastern Cordillera of Colombia (2600m asl), close to a prominent ecotone that separates Andean forests from high-altitude grasslands (páramo) (Figure 1). The Magdalena River valley lies on its western side, and on its eastern side the mountains slope down to the Eastern plains. The region has two distinct rainy and dry seasons, and the average temperature decreases with altitude in the basin, from approximately 14°C at 2550m asl to around 9°C at 3300m asl. The mean annual precipitation ranges between ~600 and 1200mm. The Sabana de Bogotá is archaeologically diverse, with sites dating from c. 16 000–550 cal BP, widely distributed along the altitudinal gradient.

Figure 1. Map of the study region showing the location of the archaeological sites investigated: 1) Checua; 2) Galindo; 3) Muisca settlements (Portalegre, Las Delicias, Candelaria, Tibanica); 4) Bonaca; 5) Tequendama; 6) Aguazuque; 7) Potreroalto; 8) Madrid; 9) Ubaté (figure by M. Delgado).
The samples investigated range from the Early Holocene (c. 9000 cal BP) to the final Late Holocene (c. 550 cal BP), and were grouped into four distinct temporal/economic groups: Early Holocene foragers (n = 17, c. 9000–7000 cal BP); Middle Holocene foragers (n = 25, c. 6400–4200 cal BP); initial Late Holocene horticulturalists (n = 11, c. 3800–2300 cal BP); and final Late Holocene agriculturalists (n = 93, c. 1300–550 cal BP). Information on the samples analysed is provided in Figure 1, Table 1 and the OSM. Data for zooarchaeological (six species, n = 17) resources with a chronological range of c. 7000–700 cal BP were included in the analysis (Delgado et al. Reference Delgado, Langebaek, Aristizabal, Tykot, Johnson, Luna, Aranda and Suby2014; Miller Reference Miller2016). The plants investigated (14 species, n = 39) are from modern agrochemical-free contexts (Delgado et al. Reference Delgado, Langebaek, Aristizabal, Tykot, Johnson, Luna, Aranda and Suby2014; Miller Reference Miller2016) and 1.5‰ was added to their δ13C values to compensate for 12C enrichment of the atmosphere from the burning of fossil fuels (Suess effect; Keeling Reference Keeling1979).
Table 1. Samples analysed by period, chronology, archaeological site and number of measurements per dietary proxy. EH = Early Holocene; MH = Middle Holocene; ILH = initial Late Holocene; FLH = final Late Holocene.

The archaeological evidence suggests that the Early and Middle Holocene foragers were highly mobile but with relatively restricted home ranges. They also developed an expeditious lithic technology that included tools for vegetable processing (Delgado Reference Delgado2018). The initial Late Holocene horticulturalists had mixed economies with clear evidence of plant and animal domestication, with some groups using pottery. Distinct mortuary behaviours and sites with long-term occupation sequences appeared during this time (Correal Reference Correal1990). Lastly, the final Late Holocene agriculturalists represented by the Muisca—a complex society that flourished in the eastern highlands of Colombia between c. 1200 and 550 cal BP—introduced intensive and extensive agriculture, developed local chiefdoms, used more refined pottery and occupied large settlement areas (Boada Reference Boada, Therrien and Enciso1996). This period is characterised by intense social and political competition between local chiefdoms and an increase in population size and social complexity (Boada Reference Boada2007).
Quantitative dietary reconstruction
Bivariate methods
Table S1 presents the statistics for human samples for the four periods, and Figures 2(A–B) and Figure 3 show δ13Ccollagen, δ13Cbioapatite and δ15N values grouped by period and plotted against calibrated BP radiocarbon ages. Tables S2 and S3 summarise the results of the isotope analyses of animal and plant samples. The δ13Ccollagen data show increasing values over time and stability in the consumption of C3 resources during the Early and Middle Holocene periods (averaging −20.1±0.3‰ and −19.9±0.1‰ for the Early and Middle Holocene, respectively). A sudden increase in C4 resource exploitation occurred during the initial Late Holocene (median: −15.8±1.1‰), and after 1300 cal BP, people were consuming mostly C4 resources, although both C3 plants and animals were also consumed (final Late Holocene median: −11.8±0.1‰). The δ13Cbioapatite data show great diversity during the Early Holocene (median: −14.0±0.5‰), indicating the consumption of predominantly C3 plants, and probably C3/C4 foods. Low δ13Cbioapatite values during the Middle Holocene (median: −14.7±0.3) and for most of the initial Late Holocene individuals (median: −13.3±1.1‰) suggest exclusive C3 diets. High apatite values during the final Late Holocene (median: −6.9±0.1‰; two initial Late Holocene individuals presented C3/C4 and C4 diets) reveal mostly C4 diets.

Figure 2. δ13Ccollagen (A) and δ13Capatite (B) values from Sabana de Bogotá human samples from each period, plotted against approximate archaeological period. EH = Early Holocene; MH = Middle Holocene; ILH = initial Late Holocene; FLH = final Late Holocene (figure by M. Delgado).
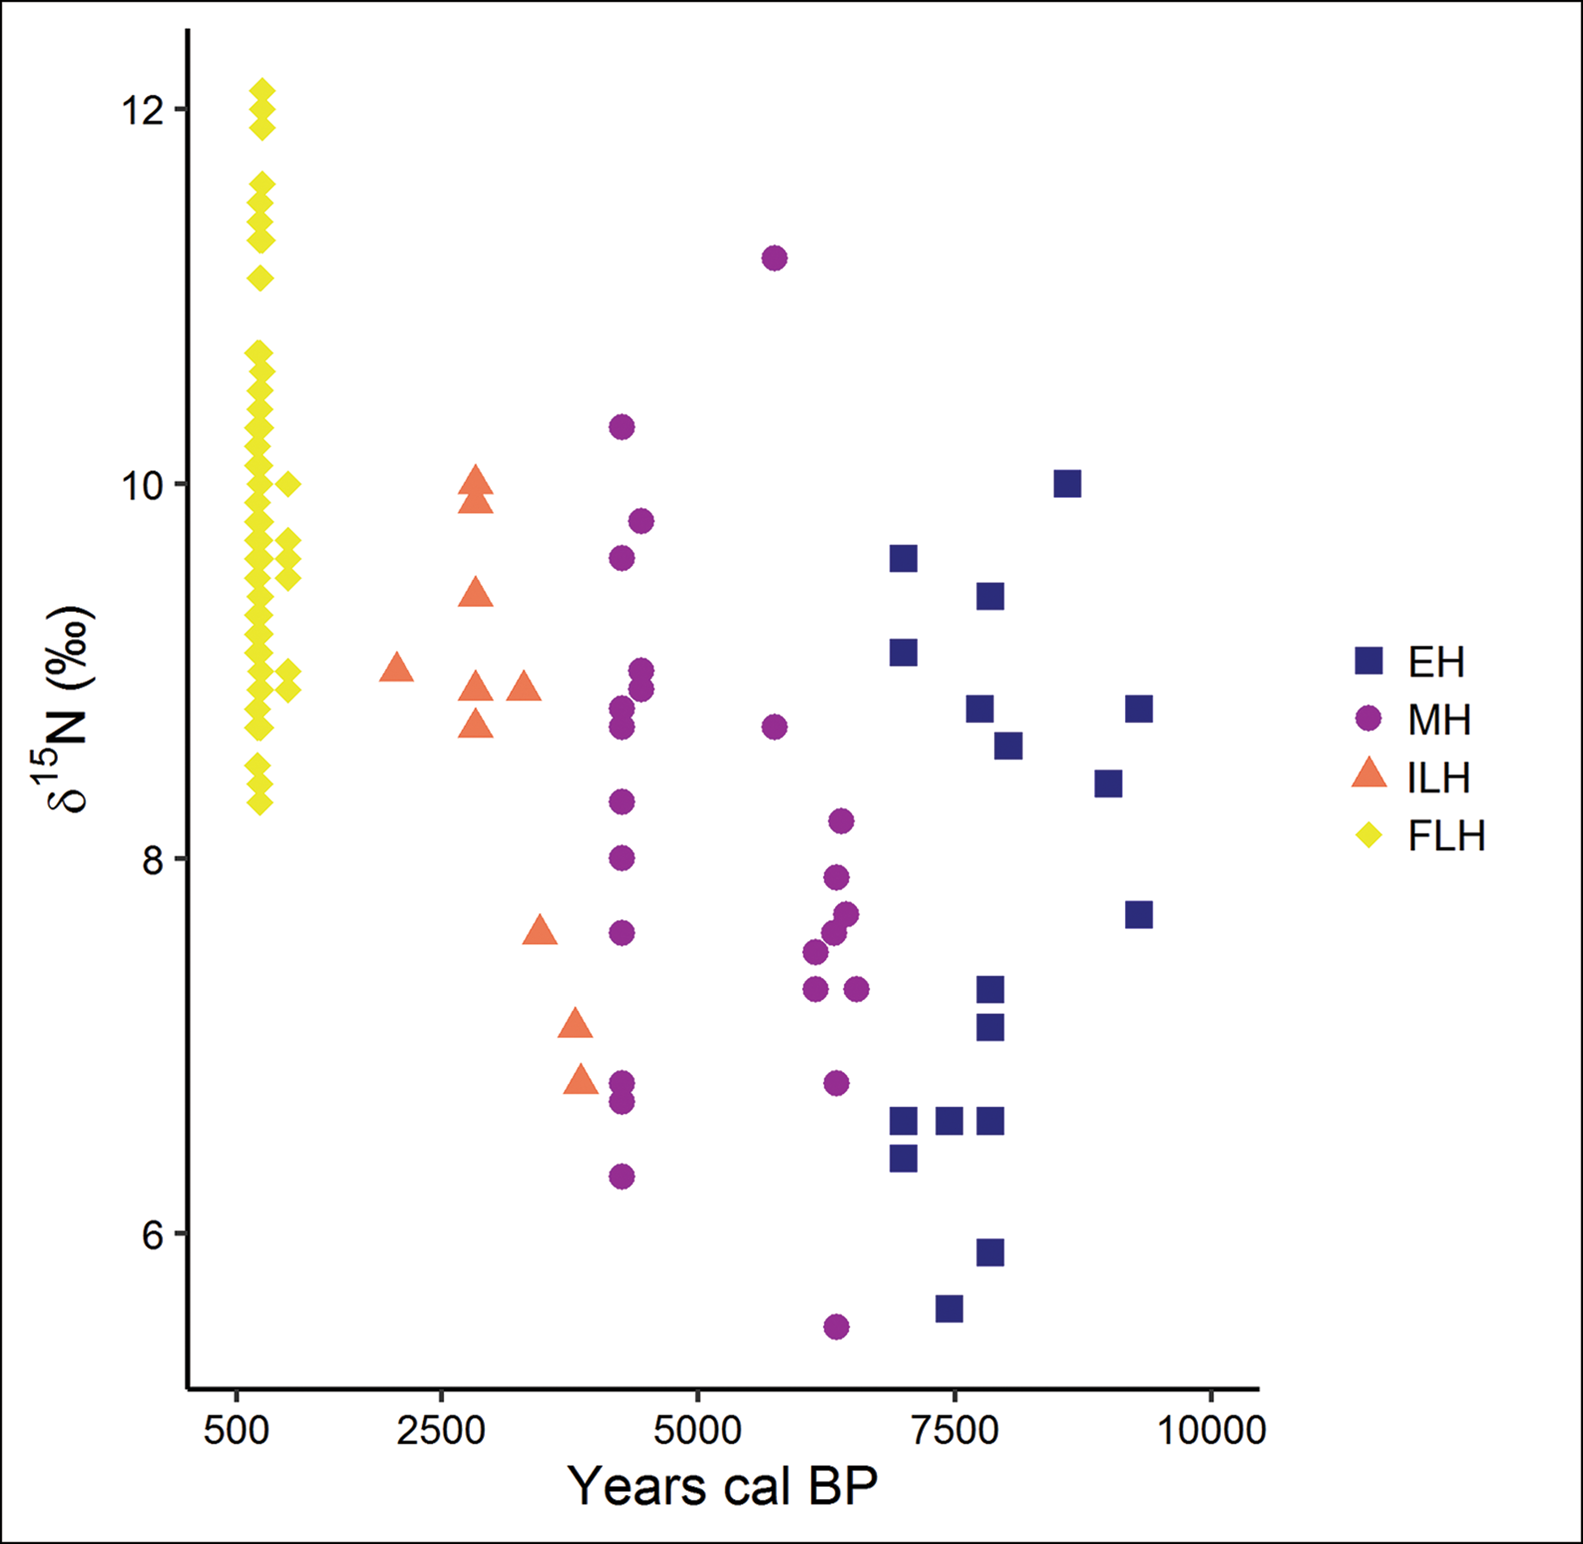
Figure 3. δ15N values from Sabana de Bogotá human samples from each period, plotted against the approximate archaeological period. EH = Early Holocene; MH = Middle Holocene; ILH = initial Late Holocene; FLH = final Late Holocene (figure by M. Delgado).
The δ15N data show no clear trend but demonstrate fluctuating values over the Holocene. They indicate the consumption of diverse C3 plants and, to a lesser extent, animals feeding on C3 plants until the Middle Holocene (medians: 7.3±0.3‰ and 8.0±0.2‰ for Early and Middle Holocene, respectively). Nitrogen values increased considerably from the initial Late Holocene onwards (median: 8.9±0.3‰), revealing changes in both the quantity and sources of dietary protein. During the final Late Holocene (median: 9.7±0.1‰), humans consumed more vegetal and animal protein from different sources, including eating more freshwater foodstuffs. Carbon (collagen) and nitrogen (Figure 4A) and carbon (collagen and apatite) (Figure 4B) plots attest to the incorporation of C4 plants during the Middle Holocene (c. 4000 cal BP). Early, Middle and some initial Late Holocene foragers consumed mostly C3 resources, especially plants. Several initial Late Holocene horticulturalists and final Late Holocene farmers had a C4-based diet, complemented by C3 foods and 15N-enriched animal protein resources.

Figure 4. δ13Ccollagen vs δ15N (A) and δ13Ccollagen vs δ13Capatite (B) plots for four Sabana de Bogotá chronological groups: EH) Early Holocene (squares); MH) Middle Holocene (circles); ILH) initial Late Holocene (triangles) and FLH) final Late Holocene (diamonds) (figure by M. Delgado).
Bayesian mixing models
Bayesian mixing models show a differential calorie contribution, in proportional terms, of distinct food groups for the samples investigated. The convergence tests showed a good convergence for all models. Figures 5–6 and Table 2 present the average calorie contribution of each food group (food per cent) for the periods investigated. For the Early Holocene, approximately 88 per cent of calories came from C3 plants, 5 per cent from C4 plants, ~5 per cent from C3 plant-eating animals and 2.1 per cent from C3/C4 plant-eating animals. Two additional models, EH2 and EH3, were tested using prior information for the Early Holocene (Correal & van der Hammen Reference Correal and van der Hammen1977). EH2 proposes an equal contribution of C3 plants and C3 plant-eating animals, while EH3 proposes a greater contribution of C3 plant-eating animals over C3 plants. The EH2 model (Table S4) shows a contribution of up to 95 per cent for C3/C4 plant-eating animals, and the EH3 model (Table S5) suggests 47 per cent for C3 plant-eating animals and 45 per cent for C3 plants. For the Middle Holocene, the estimated food groups’ calorie contributions were approximately 89 per cent from C3 plants, 4.2 per cent from C4 plants, ~4.1 per cent from C3 plant-eating animals and 2.5 per cent for C3/C4 plant-eating animals. For the initial Late Holocene, approximately 77 per cent of calories came from C3 plants, 16 per cent from C4 plants, 4 per cent from C3 plant-eating animals and 3 per cent from C3/C4 plant-eating animals. For the final Late Holocene, approximately 28 per cent of calories came from C3 plants, 66 per cent from C4 plants, 4 per cent from C3 plant-eating animals and 3 per cent from C3/C4 plant-eating animals. For the final Late Holocene, an additional model (FLH2), which takes into account ethnohistorical studies that suggest an intake of C3 and C4 plants in similar proportions (Langebaek Reference Langebaek1987), was evaluated. The result suggests a contribution of 93 per cent of C3 plants to the diet of Muisca societies (Table S6).

Figure 5. Posterior probability distribution plots of the contribution from each food group investigated. Sample codes as in Table 1. EH = Early Holocene; MH = Middle Holocene; ILH = initial Late Holocene; FLH = final Late Holocene (figure by M. Delgado).

Figure 6. Box plots grouped by food items investigated. The boxes provide a 68 per cent confidence interval (corresponding to the 16th and 84th percentiles), while the whiskers provide a 95 per cent confidence interval (corresponding to the 2.5th and 97.5th percentiles). The horizontal continuous line indicates the average while the horizontal discontinuous line indicates the median (50th percentile). Sample codes as in Table 1. EH = Early Holocene; MH = Middle Holocene; ILH = initial Late Holocene; FLH = final Late Holocene (figure by M. Delgado).
Table 2. Estimates generated by FRUITS of the average calorie contribution of each food group (food %) for each period. EH = Early Holocene; MH = Middle Holocene; ILH = initial Late Holocene; FLH = final Late Holocene.

Finally, Tables S7–8 report the estimated calorie contributions from each food fraction and from each food group towards each dietary proxy for all periods. These results show that the fraction that most contributed to human diets was energy (i.e. carbohydrates/lipids), ranging from 35–45 per cent during the final Late Holocene and Early Holocene, respectively. Notably, there are differences in the contribution of each food group among the dietary proxies. Throughout the Early and Middle Holocene, carbon and nitrogen from C3 plants contributed up to 75–90 per cent to the diet and nitrogen from C3 plant-eating animals contributed 15 per cent. During the initial Late Holocene, carbon from C3 plants contributed 80 per cent, nitrogen of C3 plants contributed 63 per cent, nitrogen of C3 plant-eating animals contributed 12 per cent and carbon and nitrogen of C4 plants contributed 15 per cent. Lastly, for the final Late Holocene, carbon and nitrogen from C3 plants contributed 30 per cent to the diet, and carbon and nitrogen from C4 plants contributed between 42 per cent and 65 per cent. Carbon (collagen and apatite) for C3 and C3/C4 plant-eating animals contributed 7 per cent, while nitrogen contributed 15 per cent from C3 plant-eating animals and 7–14% from C3/C4 plant-eating animals.
Discussion
Previous isotope-based palaeodietary studies using qualitative methods have provided useful insights into the dietary change that occurred during the Holocene in the Sabana de Bogotá region (van der Hammen et al. Reference van der Hammen, Correal and van Klinken1990; Cárdenas Reference Cárdenas2002; Delgado et al. Reference Delgado, Langebaek, Aristizabal, Tykot, Johnson, Luna, Aranda and Suby2014; Miller Reference Miller2016). Recently, the use of more sophisticated statistical methods, such as multivariate analysis and Bayesian mixing models (this study), increased the resolution of quantitative palaeodietary reconstructions at the regional level (Delgado Reference Delgado2018).
Early Holocene
Earlier studies indicated that Late Pleistocene/Early Holocene foragers consisted of specialised groups relying heavily on large- and medium-sized mammals (Correal & van der Hammen Reference Correal and van der Hammen1977; van der Hammen et al. Reference van der Hammen, Correal and van Klinken1990). More recent studies found that early foragers developed diverse and generalist subsistence strategies with a strong focus on plants and, to a lesser extent, on small-/medium-sized mammals (Cárdenas Reference Cárdenas2002; Delgado Reference Delgado2018). The present investigation uses both traditional and Bayesian mixing model methods and strongly supports these recent interpretations. Indeed, the new data show that the main energy sources were C3 plants (e.g. cucurbits and fruits), which contributed more than 80 per cent to Early Holocene forager diets. The modelled diets for this period suggest a calorie contribution of approximately 5 per cent from C4 plants. This concurs with new reconstructions of the local Holocene isotopic ecology (Delgado et al. Reference Delgado, Langebaek, Aristizabal, Tykot, Johnson, Luna, Aranda and Suby2014; Miller Reference Miller2016) and previous palaeoenvironmental studies that confirmed the presence of C4 and CAM plants during the Early Holocene, likely to be related to rapid climatic changes (Mora & Pratt Reference Mora and Pratt2002). The discovery of Early/Middle Holocene local herbivores with C4 signals lends support to both hypotheses(Delgado et al. Reference Delgado, Langebaek, Aristizabal, Tykot, Johnson, Luna, Aranda and Suby2014; Miller Reference Miller2016; Triana Reference Triana2019). The alternative models (EH2 and EH3) evaluated suggest improbable dietary scenarios, given that high proportions of animals with mixed C3/C4 diets have so far not been reported in early regional archaeological contexts (Peña & Pinto Reference Peña and Pinto1996). Furthermore, the consumption of similar proportions of plants and animals is not the norm for early and recent foragers from Neotropical regions, whose diet comprises mainly plants (Binford Reference Binford2001; Gnecco Reference Gnecco2003). Binford (Reference Binford2001), for example, found that in present-day forager economies in Neotropical Venezuela and Colombia, between 30 and 80 per cent of forager groups consumed foods derived from wild plants and between 6 and 35 per cent of foods obtained through hunting. This pattern concurs with the high proportion of C3 plants (~80 per cent) and the low contribution of C3 plant-eating animals to Early Holocene forager diets (~5–20 per cent) inferred from Bayesian mixing models. These findings argue against past statements about an alleged unfeasibility of the development of C3 plant horticulture in the Sabana de Bogotá during the Early and Middle Holocene (Cárdenas Reference Cárdenas2002) and support the idea of a probable early plant management and cultural selection of diverse vegetal resources (Gnecco Reference Gnecco2003).
In other biomes in north-western South America, such as tropical forests in the Amazon Basin, some studies have indicated that early foragers adapted to heterogeneous landscapes, relied heavily on wild plants and had generalised subsistence strategies (Gnecco & Mora Reference Gnecco and Mora1997; Morcote-Rios et al. Reference Morcote-Rios, Aceituno, Iriarte, Robinson and Chaparro-Cárdenas2020). Likewise, the results of the present study are not only consistent with interpretations from other tropical areas such as eastern-central Brazil (Da-Gloria & Spencer Larsen Reference Da-Gloria and Spencer Larsen2014), but also from sites such as Monte Verde in southern Chile (Dillehay et al. Reference Dillehay, Ramírez, Pino, Collins, Rossen and Pino-Navarro2008), where plants seem to have played a key role in the subsistence and diets of humans entering and dispersing in the Americas. Overall, these findings have wider implications for the ecology and evolution of human subsistence behaviour in tropical regions. They reveal that, since the Late Pleistocene, human diets mainly comprised a wide range of plants and that humans inhabiting tropical landscapes were not just ‘passive exploiters’, but had an impact on the environment and employed diverse plant-management strategies (Mercader Reference Mercader2003).
Middle Holocene
Despite significant environmental, cultural and population changes occurring during the Middle Holocene (Correal Reference Correal1990; Delgado Reference Delgado2012), human diets remained reasonably similar to those observed during the Early Holocene. Notably, the average contribution of C3 plant-eating animals closely resembles that of previous periods (five per cent). This implies a low contribution of guinea pigs and deer to Middle and Early Holocene forager diets, although the probability distribution plots show contributions of up to 25 per cent from such resources (Figure 5). This appears contradictory, given the large quantity of faunal remains from Early and Middle Holocene contexts, and previous suggestions concerning the central role of animals in human diets in the region (Correal & van der Hammen Reference Correal and van der Hammen1977; Peña & Pinto Reference Peña and Pinto1996). The discrepancy between the zooarchaeological and isotopic evidence probably relates to taphonomic biases, such as the better preservation of animal bones compared with other remains (e.g. archaeobotanical remains), leading to an overestimation of animal resources. Such biases can partly explain the reduced animal protein intake inferred from Bayesian mixing models.
The high nitrogen values exhibited by some of the C3 plants investigated (i.e. C3 fruits and potato) are notable, with medians of 8.5‰ and 11‰, respectively, and maximum values between 10.2‰ and 13‰ in both cases (Table S3). Such plants also show low carbon values (medians −24.7‰ and −22.8‰). This pattern of high nitrogen/low carbon can mimic that of terrestrial herbivores and would concur with an energy-intake strategy that emphasised the consumption of animal carbohydrates/lipids (Tables S7–8). Accordingly, these values could correspond with the consumption of deer, guinea pigs and other local herbivores, all of which have equally low carbon values, implying a probable underestimation of such resources in the reconstructions proposed here. This underestimation is related both to the limits of the Bayesian mixing model used and to the inclusion of C3 plants from current ecosystems with unusually high nitrogen values, which are probably related to land-management practices (i.e. using natural fertilisers). In addition, the calorie contribution of up to 20 per cent from C4 plants for this period (Figure 5) could agree with previous suggestions concerning the Early/Middle Holocene human-mediated dispersal of maize into South America, as revealed by evidence from coastal Peru, Guyana and the south-western Amazon (Kistler et al. Reference Kistler2018).
Late Holocene
During the initial Late Holocene (4200–3900 cal BP), a different trend is evident. This is characterised by a mosaic of dietary patterns focused on C3, mixed C3/C4 and C4 resources. Bayesian mixing models show that C3 plants decrease to approximately 60 per cent of dietary intake, while C4 plants reach up to 30 per cent, indicating a growing emphasis on maize. This concurs with a hypothesis concerning the adoption of maize agriculture and intensification of C3 cultigens (tubers, potato, cucurbits and the like) at this time (Correal Reference Correal1990; van der Hammen et al. Reference van der Hammen, Correal and van Klinken1990). The sudden increase in C4 resources and the change in the proportion of C3 and C4 plant intake points to the introduction of maize agriculture, which enabled important cultural changes associated with food production and animal husbandry (Cárdenas Reference Cárdenas2002; Delgado Reference Delgado2018). The negligible mean calorie contribution from C3 and C3/C4 plant-eating animals (~4 per cent) to initial Late Holocene human diets needs further clarification, as this period is considered to be key in the domestication and more intensive exploitation of certain species (e.g. guinea pigs; Lord et al. Reference Lord2020). Indeed, the probability distribution plots (Figure 5) show that C3 and C3/C4 plant-eating animals contributed up to 20 per cent of some individuals’ calories, revealing a slightly higher importance of animal protein.
For the final Late Holocene—especially during the Muisca period (c. 1200–550 cal BP)—the traditional methods and Bayesian mixing models reveal that C4 plants contributed much more to dietary calorie intake (65 per cent), but that it was still complemented by C3 resources (30 per cent). Notably, these results agree with previous investigations that have highlighted an increased emphasis on maize and highland tubers during the Muisca period (Cárdenas Reference Cárdenas, Therrien and Enciso1996). The alternative model (FLH2) hypothesises a similar C4 and C3 plant calorie contribution to human diet, but the resulting Bayesian mixing modelling (C3 plants~C3 animals) suggests an extremely high contribution of C3 plants (~93 per cent) to Muisca diets, implying an unrealistic dietary scenario. Likewise, the zooarchaeological evidence shows that a diverse range of faunal species was exploited during this time (Delgado et al. Reference Delgado, Langebaek, Aristizabal, Tykot, Johnson, Luna, Aranda and Suby2014; Lord et al. Reference Lord2020), suggesting that animal protein played an important role in human diets. Yet the Bayesian mixing models indicate a smaller average calorie contribution from C3 and C3/C4 plant-eating animals (3.6 and 3.0 per cent, respectively) during the final Late Holocene compared with earlier periods. This discrepancy requires alternative explanations, as the result of a minor role of animal resources in the Muisca diet disagrees with the archaeological evidence.
Although earlier isotopic studies have suggested an overwhelming preponderance of maize consumption (Cárdenas Reference Cárdenas1993), recent investigations (Delgado et al. Reference Delgado, Langebaek, Aristizabal, Tykot, Johnson, Luna, Aranda and Suby2014; Langebaek et al. Reference Langebaek, Gonzales, Aristizábal, Bernal, Corcione, Mendoza, Pérez, Rodríguez and Zorro2015; Miller Reference Miller2016) stress more diverse diets among the Muisca, as the present study also shows. This important dietary diversification is closely related to Muisca agricultural practices, especially with the development of an impressive, extensive and successful agricultural infrastructure (Boada Reference Boada2018).
A key research topic in Muisca archaeology is the relationship between agricultural specialisation and the emergence of social differentiation, and how this relates to diet. Although a full exploration of this is beyond the scope of the present study, the results obtained here reveal a probable link between sociopolitical complexity and agricultural intensification, especially based on maize. Previous analyses addressing this issue, however, have found no evidence for strong dietary differentiation associated with social status, suggesting that social inequality among the Muisca was not necessarily related to socially constituted dietary practices (Delgado et al. Reference Delgado, Langebaek, Aristizabal, Tykot, Johnson, Luna, Aranda and Suby2014; Miller Reference Miller2016). The lack of a clear relationship between foodways and social hierarchy among the Muisca differs from that found in other Andean societies (Ubelaker et al. Reference Ubelaker, Katzenberg and Doyon1995; Finucane Reference Finucane2009), which reveal that, in complex societies with clear social differences, the elite tend to present relatively distinct dietary patterns. This allows us to question the mechanisms used by the Muisca elite to exercise social control over diet and feeding practices, and suggests that status was not the only driver of social differences. It seems reasonable to think in terms of alternative strategies employed to negotiate social differentiation, rather than the imposition of strict control. This is in line with recent interpretations concerning the development of a non-linear social hierarchy among the Muisca and the more diffuse nature of the exercise of power by the elite (Langebaek Reference Langebaek2019).
Concluding remarks and future directions
Isotopic dietary proxies and robust statistical methods clarify the relative contribution of several food items to human diets in the Sabana de Bogotá region during the Holocene. They contribute to a more realistic model of quantitative palaeodietary reconstruction, along with new data concerning major diachronic shifts in diet and subsistence. Nevertheless, some issues remain to be addressed. Which C3 plants contributed to the human diet? What freshwater resources were consumed and what was their contribution to the human diet? Is the animal calorie contribution to human diets underestimated? And is there a protein bias against such resources? Additional isotopic and archaeobotanical data, combined with more complex modelling, are required to answer broader questions concerning the role that agriculture plays in cultural change, specialisation and social differentiation.
Acknowledgements
I would like to thank Sonia Archila and Carl Langebaek (Universidad de los Andes) for sharing their data from Ubaté, as well as Paula Galligani (FCNYM, UNLP) for help with Figure 1. Special thanks to Ana María Boada (University of Pittsburgh), Daniel Benitez (Florida Atlantic University) and the two anonymous reviewers for their comments and suggestions.
Funding statement
This research received no specific grant from any funding agency or from commercial and not-for-profit sectors.
Supplementary material
To view supplementary material for this article, please visit https://doi.org/10.15184/aqy.2021.56


