


Introduction
The trace element content of aerosols sampled in the most remote parts of our planet, primarily due to long range transport, provides valuable information on the global transport of particulates and the contribution of human activities to air pollution. In these areas, interesting records of the history of the atmosphere are preserved in snow and ice. Several authors have investigated the occurrence of trace metals in Antarctic snow and ice (Wolff et al. Reference Wolff, Suttie and Peel1999, Planchon et al. Reference Planchon, Boutron, Barbante, Cozzi, Gaspari, Wolff, Ferrari and Cescon2002) to demonstrate changes in the heavy metal content of naturally occurring and man-derived aerosols that reach the Antarctic continent over time. Determination of Antarctic aerosol composition has been the subject of intense work over the years. For example, ion content has been determined by ion chromatography and relevant sources have been discussed (Minikin et al. Reference Minikin, Legrand, Hall, Wagenbach, Kleefeld, Wolff, Pasteur and Ducroz1998, Wagenbach et al. Reference Wagenbach, Ducroz, Mulvaney, Keck, Minikin, Legrand, Hall and Wolff1998, Wolff et al. Reference Wolff, Hall, Mulvaney, Pasteur, Wagenbach and Legrand1998, Teinilä et al. Reference Teinilä, Kerminen and Hillamo2000, Jourdain & Legrand Reference Jourdain and Legrand2002, Fattori et al. Reference Fattori, Becagli, Bellandi, Castellano, Innocenti, Mannini, Severi, Vitale and Udisti2005).
Surface composition of particulate matter (PM) is of particular interest, as it represents the history of the interaction of PM with the environment during its transport. In addition, PM surface chemistry is of fundamental importance in many atmospheric processes. For example, a role for bromide at the surface of sea salt aerosol in polar ozone seasonal variations has been hypothesized. This has been supported by direct observations of substantial segregation of bromide to the surface of NaCl samples with low levels of bromide (Ghosal et al. Reference Ghosal, Shbeeb and Hemminger2000). This suggests that PM surface composition represents a significant piece of information for understanding the environmental chemistry of aerosols.
X-ray photoelectron spectroscopy (XPS) is a powerful technique for the determination of surface chemical composition of atmospheric particulates. Since its invention (Araktingi et al. Reference Araktingi, Bhacca, Robinson and Proctor1971), XPS has emerged as a tool to analyse PM collected onto filters and continues to be used for identification of surface chemical speciation (Song & Peng Reference Song and Peng2009). It can also complement information obtained by ion chromatography, as it can probe chemical speciation of insoluble species without any particular pretreatment. Elemental composition of species can be identified by X-ray fluorescence (XRF), but this technique cannot directly disclose relevant chemical speciation.
The analysis of PM collected on cellulose filters is particularly challenging as these filters have rough surfaces and insulating properties. However, recent developments in the charge compensation system for the XPS technique have addressed these issues (Cazaux Reference Cazaux2000, Johansson & Campbell Reference Johansson and Campbell2004, Kratos Analytical 2009, Mustafi et al. Reference Mustafi, Raine and James2010).
The present work represents the first exploration of the potential of XPS in the investigation of Antarctic aerosols. It reports XPS data on PM collected from an Antarctic site in the 2010–11 summer. Interesting chemical information was obtained on the distribution of surface chemical species among different size classes of PM.
Methods
Sample collection and storage
Size-segregated aerosols were collected in the coastal region of Victoria Land (East Antarctica) during the 2010–11 summer for the Italian National Program for Research in Antarctica (PNRA).
Aerosol sampling was carried out between 29 December 2010 and 8 January 2011, with 10 days resolution, using a Tisch (Cleves, OH) 6-stage cascade impactor with 10.0, 7.2, 3.0, 1.5, 0.95 and 0.49 μm particle cut-off diameters. The device was placed at Campo Faraglione (74°42'58"S, 164°06'54"E), c. 3 km south of the Mario Zucchelli Italian Station (formerly Terra Nova Bay Station). The device employed cellulose filters (Whatman) and operated at 1130 l min-1. The choice of filter was guided by the requirements of the different analytical techniques (e.g. inductively coupled plasma mass spectrometry, ICP-MS, and XPS). After sampling, the filters were placed in acid-cleaned plastic petri dishes, sealed in double polyethylene bags and stored at -20°C until analysis. Field blanks for every cut-size were concomitantly prepared by installing the filters in the sampler for c. 10 minutes without switching on the device, and then following the same procedure as used for the sample filters.
Meteorological data (e.g. wind speed, direction, relative humidity and atmospheric temperature) were also collected.
X-ray photoelectron spectroscopy analysis
Each filter was cut to c. 1.5×1 cm (central part of the filter). The XPS measurements were recorded with an AXIS ULTRA DLD (Kratos Analytical) electron spectrometer using a monochromatic AlKα source (1486.6 eV) operating at 225 W (15 kV, 15 mA). The filters were placed on a multiple sample holder and inserted into a sample treatment chamber where they were left to degas for one night. Base pressure in the analysis chamber was 6×10⁻⁹ torr. Survey scan spectra were recorded using a pass energy of 160 eV and a 1 eV step. Narrow scans of single regions were acquired using a pass energy of 20 eV and a 0.1 eV step. The hybrid lens mode was used for all measurements. During data acquisition, sample surfaces were neutralized with slow thermal electrons emitted from a hot tungsten filament and trapped above the sample by the magnetic field of the lens system. The binding energy scale was referenced to the C 1s line of C-O (cellulose) (286.73 eV) (Beamson & Briggs Reference Beamson and Briggs1992). Processing of the spectra was accomplished with CasaXPS Release 2.3.16 software. For the analysis of high resolution spectra, all peaks were deconvoluted and fitted using Shirley background and GL(30) lineshape (a combination of Gaussian 70% and Lorentzian 30%).
Quantitative analysis employing relative sensitive factors is based on the assumption that a sample is homogenous in the probed surface region. Where an inhomogeneous depth profile occurs (e.g. Mg), measured content represents only a particular averaged value in analysed depth (Briggs & Seah Reference Briggs and Seah1990).
For quantitative analysis, the relative sensitivity factors presented in the CasaXPS library for the areas of the signals were used. The following regions were recorded: C 1s, O 1s, N 1s, Na 1s, Ca 2p, Cl 2p, S 2p, Si 2p, Fe 2p, F 1s, P 2p, Zn 2p, Mg 1s and Al 2p. On the basis of the results of the ICP-MS (Grotti, personal communication 2014), regions relative to the main signals of Mo, Sr, Mn, Cr, Ti and Cu were also examined, without being able to detect any signal. Field blanks were analysed for comparison. The elemental content of the samples, obtained after subtraction of the elemental content of the field blanks, are expressed as atomic ratios to C-O (cellulose) C 1s component (Fig. 1), which is constant in all of the samples examined.

Fig. 1 High resolution spectra of C 1s region.
Results
The survey scan spectra results for the blank and sample filters are reported in Figs 2 & 3. Collection of PM on the filters is demonstrated by the appearance of elements that were not found on the blank filters, e.g. Ca, Na, S, N, etc.

Fig. 2 Survey scan spectra for blank filter.

Fig. 3 Survey scan spectra for a PM sample (size fraction: 3.0 µm particle cut-off diameter). The region in the square is shown enlarged at the right-hand side.
The narrow scan XPS analysis allowed the surface elemental composition and chemical composition of PM to be determined. The results of the narrow scan spectra are shown in Figs 4–8.

Fig. 4 High resolution spectra of Fe 2p region for PM sample (size fraction: 3.0 µm particle cut-off diameter).

Fig. 5 High resolution spectra of Al 2p region for PM sample (size fraction: 3.0 µm particle cut-off diameter).

Fig. 6 High resolution spectra of Na 1s region for PM sample (size fraction: 3.0 µm particle cut-off diameter).

Fig. 7 High resolution spectra of Ca 2p region for PM sample (size fraction: 3.0 µm particle cut-off diameter).

Fig. 8 High resolution spectra of Mg 1s region for PM sample (size fraction: 3.0 µm particle cut-off diameter).
The distribution of detected elements among the different size classes is shown in Fig. 9.

Fig. 9 Atomic ratios refer to cellulosic carbon and are obtained following subtraction of the atomic contribution of the blank filter. Absence of a bar corresponding to a particular element means that either the PM elemental content is not significantly different from the blank filter (S, F, Si) or a relevant XPS signal was not detected (Cl, Ca, Mg, Al, Fe, P, Zn).
Table I lists the binding energy values of the elements found on the surface, together with their assignments.
Table I Binding energy values of the detected elements and their assignments.

Discussion
The results show the presence of elements such as Na, S, N, F and Ca in almost all size classes. Fe and Zn are only found in a single class. It is noteworthy that Ca was not detected by ICP-MS (Grotti, personal communication 2014). This result is not surprising as XPS has the potential to detect elements (e.g. Hg) present in inhomogeneous samples at an average concentration in the order of parts per billion if the element is concentrated at the surface (Briggs Reference Briggs1978).
In addition, evidence of Mg surface enrichment was provided by a ratio of intensity of Mg 1s and Mg 2p signals (each divided by relevant sensitivity factors) equal to 1.45 (Briggs & Seah Reference Briggs and Seah1990).
The presence of Na+ and Cl- indicates a significant contribution from sea spray to the PM collected. In particular, Cl/Na ratios ranging from 0.16 to 0.38 mol/mol were observed. These values are lower than the theoretical sea water value (1.2 mol/mol) (Fattori et al. Reference Fattori, Becagli, Bellandi, Castellano, Innocenti, Mannini, Severi, Vitale and Udisti2005). A similar finding was reported for PM samples collected at another coastal site (within close proximity to the current site) during the 2002–03 summer (Fattori et al. Reference Fattori, Becagli, Bellandi, Castellano, Innocenti, Mannini, Severi, Vitale and Udisti2005), where a Cl loss from sea salt, probably caused by acid–base exchange, was noted (Cl/Na ratios: 0.3–0.6 mol/mol).
The N 1s spectra are of particular interest as they show several nitrogen species (Figs 10–12). Ammonium and nitrate were also reported by Fattori et al. (Reference Fattori, Becagli, Bellandi, Castellano, Innocenti, Mannini, Severi, Vitale and Udisti2005). The sources was attributed to penguin emissions (ammonium) and several local sources (e.g. nitrate adsorption on sea salt particles). There was no indication of organic N.

Fig. 10 High resolution spectra of N 1s region for PM sample (size fraction: 0.95 µm particle cut-off diameter).
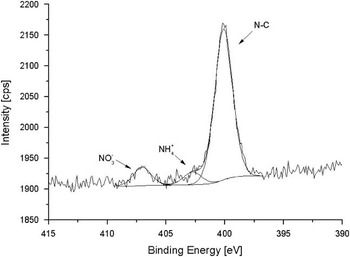
Fig. 11 High resolution spectra of N 1s region for PM sample (size fraction: 3.0 µm particle cut-off diameter).

Fig. 12 Atomic percentage indicating the distribution of the N components between size fractions.
The S 2p region also yielded interesting information. Figure 13 shows the presence of two sulphur species: sulphate (168.8 eV) and organic sulphur (163.7 eV) (Atzei et al. Reference Atzei, Fantauzzi, Rossi, Fermo, Piazzalunga, Valli and Vecchi2014). Local sources have been proposed for sulphate species (Fattori et al. Reference Fattori, Becagli, Bellandi, Castellano, Innocenti, Mannini, Severi, Vitale and Udisti2005), such as sea salt aerosol and secondary aerosol from biogenic emissions (e.g. oxidation of dimethylsulphide by phytoplanctonic blooms). The occurrence of the second process is coherent with SO4 2-/Cl ratios of 0.18–15 mol/mol estimated from Fattori et al. (Reference Fattori, Becagli, Bellandi, Castellano, Innocenti, Mannini, Severi, Vitale and Udisti2005) and higher than expected for seawater aerosol (0.052 mol/mol) (Jourdain & Legrand Reference Jourdain and Legrand2002). A similar situation was observed in the present data where SO4 2-/Cl ratios ranged from 0.39 to 17 mol/mol. The origin of the organic sulphur is not clear. The same species, at a similar content, was also present on the blank filters (Fig. 14b). However, it was not observed on the filters before exposure to the Antarctic atmosphere (Fig. 14c). Therefore, it was collected on site, but is not exclusively associated with PM. A similar species has been observed in PM10 samples collected in an urban atmosphere (Atzei et al. Reference Atzei, Fantauzzi, Rossi, Fermo, Piazzalunga, Valli and Vecchi2014). The nature of this organic sulphur is under investigation.

Fig. 13 High resolution spectra of S 2p region for PM sample (size fraction: 3.0 µm particle cut-off diameter).

Fig. 14 High resolution spectra of S 2p region for a. PM filter and b. blank filter (size fraction: 3.0 µm particle cut-off diameter), and c. clean filter.
A similar situation was observed for fluorine. While fluoride species were detected in PM for one size class (3 μm), an organic fluorine species (688.3 eV) was present on both sample and blank filters in some cases (Fig. 15), but not on the filters before exposure. The origin of this species is not clear. However, the presence of organic fluorine at an Antarctic site has been reported previously (Dreyer et al. Reference Dreyer, Weinberg, Temme and Ebinghaus2009).

Fig. 15 High resolution spectra of F 1s region for a. PM filter and b. blank filter (size fraction: 3.0 µm particle cut-off diameter), and c. clean filter.
Conclusions
This is the first application of XPS to characterize atmospheric particulate collected in Antarctica. The results illustrate distribution of surface chemical species among size classes ranging from 0.49 μm to >10 μm. The 3 μm fraction exhibited the richest composition.
Data relevant to ammonium, nitrate and sulphate species are in reasonable agreement with those reported previously.
Traces of organic sulphur and fluorine appear to be present; however, their amounts and origin require further investigation. An extension of the study is in progress to investigate the correlation with meteorological data.
Acknowledgements
Financial support was provided by Italian MIUR through the PNRA 2009 (Project PROGDEF 09_153) and by project PON 254/Ric Cod. PONa3_00334. The authors greatly thank the anonymous reviewer who suggested an interpretation of sulphate results based on local sources.
Author contribution
C. Malitesta developed the project idea, designed XPS measurements and provided expert guidance on the interpretation and discussion of data. S. Rella carried out the XPS analysis and the data processing. All authors contributed significantly to the interpretation of the data and revision of the manuscript.


