


Introduction
The longline fishery for Antarctic toothfish (Dissostichus mawsoni) in the Ross Sea region (Fig. 1) has provided two decades of observations and biological samples to aid in understanding the life history and ecology of Ross Sea region toothfish and other species. These data have been used to derive the biological parameters used for stock assessment, to develop spatial population models and to inform the design of the Ross Sea region Marine Protected Area (RSRMPA) (Mormede et al. Reference Mormede, Dunn and Hanchet2014a, Reference Mormede, Dunn, Hanchet and Parker2014b, Hanchet et al. Reference Hanchet, Dunn, Parker, Horn, Stevens and Mormede2015). The fishery occurs primarily in December and January of each year (CCAMLR 2018). Based on histological and gonad stage data collected during the summer, spawning likely occurs in the winter months when much of the potential spawning habitat is under sea ice, making direct observations difficult (Parker & Grimes Reference Parker and Grimes2010).
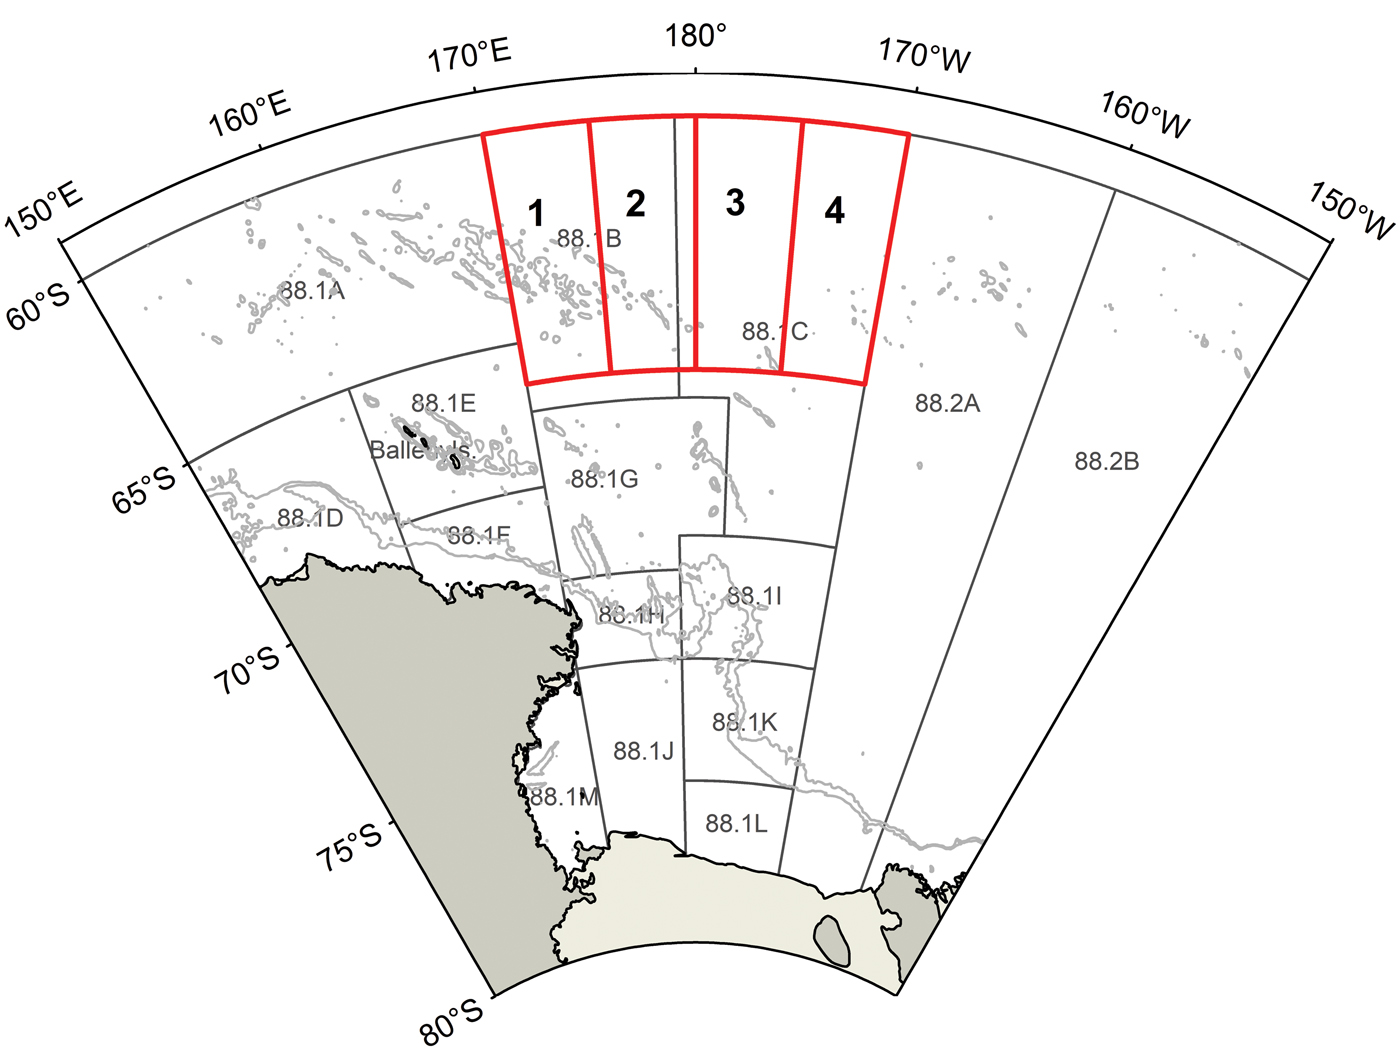
Fig. 1. The Ross Sea region Conservation of Antarctic Marine Living Resources (CCAMLR) small-scale research units (SSRUs) in Subareas 88.1 and 88.2A–B used for fisheries management, with depth contours plotted at 1000 and 2000 m. Red polygons indicate the four survey areas for the winter Antarctic toothfish survey.
Spawning on seamounts in the north is hypothesized based on the direction of movements from recaptures of tagged toothfish and gonad development in the region observed during the summer (Hanchet et al. Reference Hanchet, Rickard, Fenaughty, Dunn and Williams2008). In a review of D. mawsoni biology in the Ross Sea region, Hanchet et al. (Reference Hanchet, Dunn, Parker, Horn, Stevens and Mormede2015) concluded that in order to better determine population structure, improve spatial population models and monitor the effectiveness of the RSRMPA, information was needed to understand the population dynamics occurring outside the summer period. Dissostichus mawsoni inhabiting the slope region in the summer have a different sex ratio, age structure and condition factor (derived from the length–weight relationship) than those in the northern Ross Sea region at the same time. Hanchet et al. (Reference Hanchet, Dunn, Parker, Horn, Stevens and Mormede2015) hypothesized that if fish on the slope showed an annual return spawning migration to the northern Ross Sea region during the winter, those characteristics should change in the northern region population during the winter months.
We report on the first winter toothfish longline survey in the Ross Sea region. The survey was designed to document the timing and location of spawning activity, to collect biological information about reproductive status during the spawning season and to look for temporal signals in size and age structure, condition factor and sex ratio during the winter.
Methods
Survey implementation
Much of the northern Ross Sea region is under sea ice during the winter (June–August), even at latitudes north of 65°S (Markus et al. Reference Markus, Comiso and Meier2018). To target northern seamount features that were likely to be accessible during June and July, four survey strata were defined where relatively high (> 4%) gonadosomatic indices of D. mawsoni had been observed in the summer fishery and where sea ice concentration was typically low (Parker & Grimes Reference Parker and Grimes2010, https://nsidc.org/sites/nsidc.org/files/G02135-V3.0_0.pdf). The strata were bounded by 60–66°S latitude and 170°E–170°W longitude, and the survey was conducted as far south as possible within those strata given sea ice constraints at the time (Figs 1 & 2).
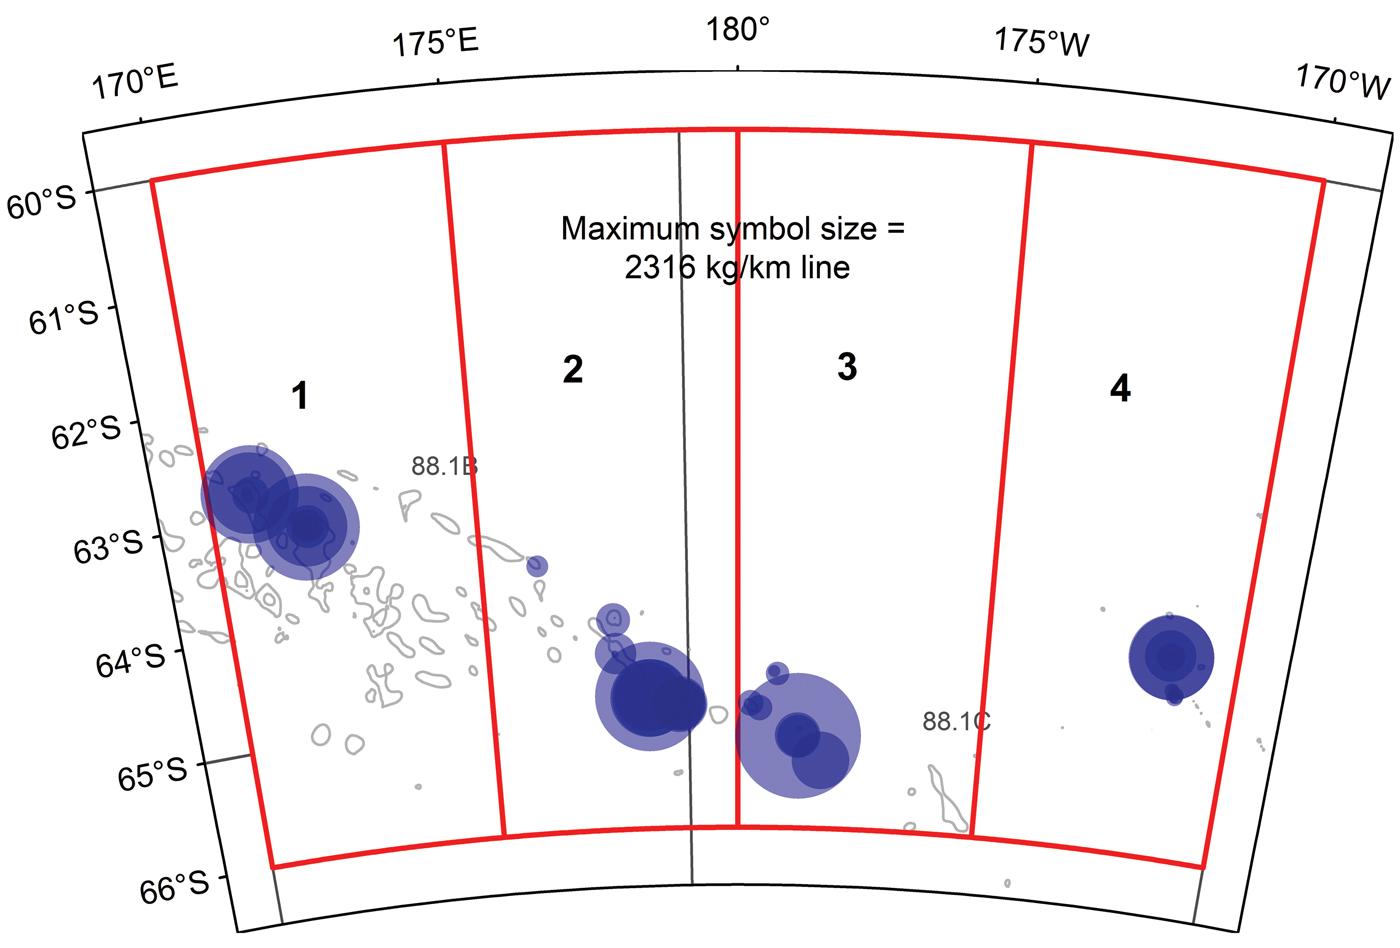
Fig. 2. Locations and catch rates of Dissostichus mawsoni for 55 lines of the 2016 winter survey, overlaid on the survey areas (red) with symbol area proportional to catch rate. Maximum symbol size = 1304 (kg km-1 line).
The survey was conducted from 22 May to 20 July 2016, with sampling targeted at hills and seamounts at the northern edge of the sea ice extent near latitudes 63–66°S at depths of 872–1915 m. The New Zealand flagged longline fishing vessel Janas was chartered for the survey. The vessel used standardized procedures for comparison with data from other toothfish surveys. Integrated weight bottom longline was used for all lines, composed of 50 g of lead per metre of 11 mm, four strand polyester mainline. The gangions were multifilament 150 kg breaking strength and 450 mm long. They were spaced at 1.4 m intervals and connected via rotors and swivels that were permanently attached to the mainline, and to 15/0 Dyrkorn™ hooks baited with arrow squid (Nototodarus sp.) using an automatic baiting machine (c. 30 g per hook). Lines were set for a target soak time of 18 ± 6 h subject to environmental conditions (ice, weather, etc.). All lines were composed of 3440 hooks.
Length, weight, sex, gonad stage and gonad weight were recorded for the first 100 D. mawsoni captured on each line. Fish were measured to the nearest centimetre at or below the total length. Sex and macroscopic reproductive stage were determined using the Commission for the Conservation of Antarctic Marine Living Resources (CCAMLR) five-stage system, composed of immature, resting, developing, ripe and spent stages (CCAMLR 2011). Gonads were weighed to the nearest 10 g using a motion-compensated balance (Marel, Iceland). Toothfish otolith pairs were collected with a sampling target of at least five males and five females per 1 cm length class for determination of age structure via an age–length key.
Fishery data
The toothfish fishery uses only bottom longlines and occurs during December–January each summer. Fishery data used for comparison with winter survey data were derived from a CCAMLR extract of the vessel logbook and scientific observer data for all fishing vessels in the Ross Sea region (see CCAMLR 2018 for further information). Catch and effort (e.g. location, depth) data were matched to biological data on individual fish collected by observers.
The resulting dataset contained records of 42 073 D. mawsoni sampled at random from fishing events in the 2015/2016 fishery throughout the Ross Sea region. Similar biological data such as length, weight, sex, gonad weight and gonad stage using the CCAMLR five-stage scale were also collected for fishery catch. Otoliths were collected randomly from fish sampled from each line.
Biological parameters
Gonad weight data were checked for outliers. The gonadosomatic index (GSI) was calculated as the gonad weight (g) / 1000 / total weight (kg) × 100 for both males and females. Changes in weight for fish of a given length were compared using the exponents from the sex-specific length–weight relationship to generate the index for each sex (Anderson & Neumann Reference Anderson, Neumann, Murphy and Willis1996, Hanchet et al. Reference Hanchet, Dunn, Parker, Horn, Stevens and Mormede2015). The index of condition was calculated as total weight (kg) / length (cm)x × 100 000, where x was 2.965 for females or 3.108 for males (Hanchet et al. Reference Hanchet, Dunn, Parker, Horn, Stevens and Mormede2015).
Otolith age estimates were determined using the ‘bake and embed’ method (Horn Reference Horn2002, Horn et al. Reference Horn, Sutton. and DeVries2003), scaled to the total catch, and ages were assigned using an annual age–length key (Mormede et al. Reference Mormede, Dunn and Hanchet2014a).
To compare biological characteristics between winter and summer samples, we used generalized additive models (GAMs) to remove potentially confounding effects of space, depth, sex or fishing event. For models with response variables of length, condition factor and GSI, the models were fit as: Response ≈ tensor(latitude, longitude) + sex + season + depth + random effect(event), family = Gaussian, and weighted by the proportion of catch sampled for each line (event) using the R package mgcv (https://www.R-project.org). To fit the proportion female observed in each line, a quasi-binomial distribution was used without the random effect because data were aggregated to one observation per event. However, the weighting included the number of fish sampled in determining the proportion female.
For all models, non-significant variables were removed one at a time until a final model was obtained. Model diagnostics were checked for goodness of fit using residual plots and Q–Q plots using the plot.gam function. Because age distributions were derived from scaled length distributions via an age–length key, the statistical comparisons were identical to those for length and not reported.
Results
Toothfish characteristics
A total of 1749 toothfish were caught during the survey. The mean catch per unit effort was 193 kg km−1 line (coefficient of variation (CV) = 1.48), compared with a value of 220 kg km−1 line and CV = 1.98 for the same vessel in the commercial fishery in the area 6 months previously, showing that catch rates are variable in the region within both winter and summer periods, but are less variable in the winter.
The length frequency distributions for male and female D. mawsoni showed unimodal size distributions with a mean of 142 cm for males (range 100–183 cm) and 154 cm for females (range 100–186 cm) (Fig. 3). The GAM supported the results of the t-test with no detectable difference in the length of males or females between the summer of 2016 and the following winter samples (Table I). The final model retained only length and the random effect of the sampling event. The weights of individual D. mawsoni sampled ranged from 10 to 83 kg.

Fig. 3. Length distributions scaled to total catch of male (left) and female (right) Dissostichus mawsoni from the summer fishery and the winter survey in 2016.
Table I. Results of generalized additive models used to test for differences in response variables between the summer and winter seasons.

The sex ratio was skewed towards males, with 72.9% male during the winter survey, compared to 71.6% male observed during the summer fishery in the northern region. The GAM supported the results of the t-test with no significant change in the sex ratio between the summer fishery and the winter spawning periods (Table I). Although the overall sex ratio did not change with season and was dominated by males, the sex ratio observed on individual lines varied between 0% and 100% female, suggesting fine-scale spatial heterogeneity in sex composition during the spawning season (Fig. 4). The GAM did support a significant spatial pattern in the sex ratio (F (9, 93) = 3.463, P < 0.001); however, this may be aliasing a pattern in the spatial distribution of individual lines given the low sample sizes.

Fig. 4. Histogram of the proportion of female Dissostichus mawsoni in each line during the winter survey.
Timing of spawning
The appearance of males in spawning condition (freely expressing milt) followed by the appearance of both gravid and post-spawning females at the end of the survey period suggests that males aggregate in spawning condition before females reach a fully mature stage (i.e. ovulation) (Table II). For most of the survey, female D. mawsoni generally had maturing gonads with no visible hyaline eggs, but on 8 and 9 July, 7 and then 14 running ripe females were caught (Fig. 5). The combination of gravid and post-spawning females suggests that, in 2016, D. mawsoni in the northern Ross Sea region began spawning in early July.
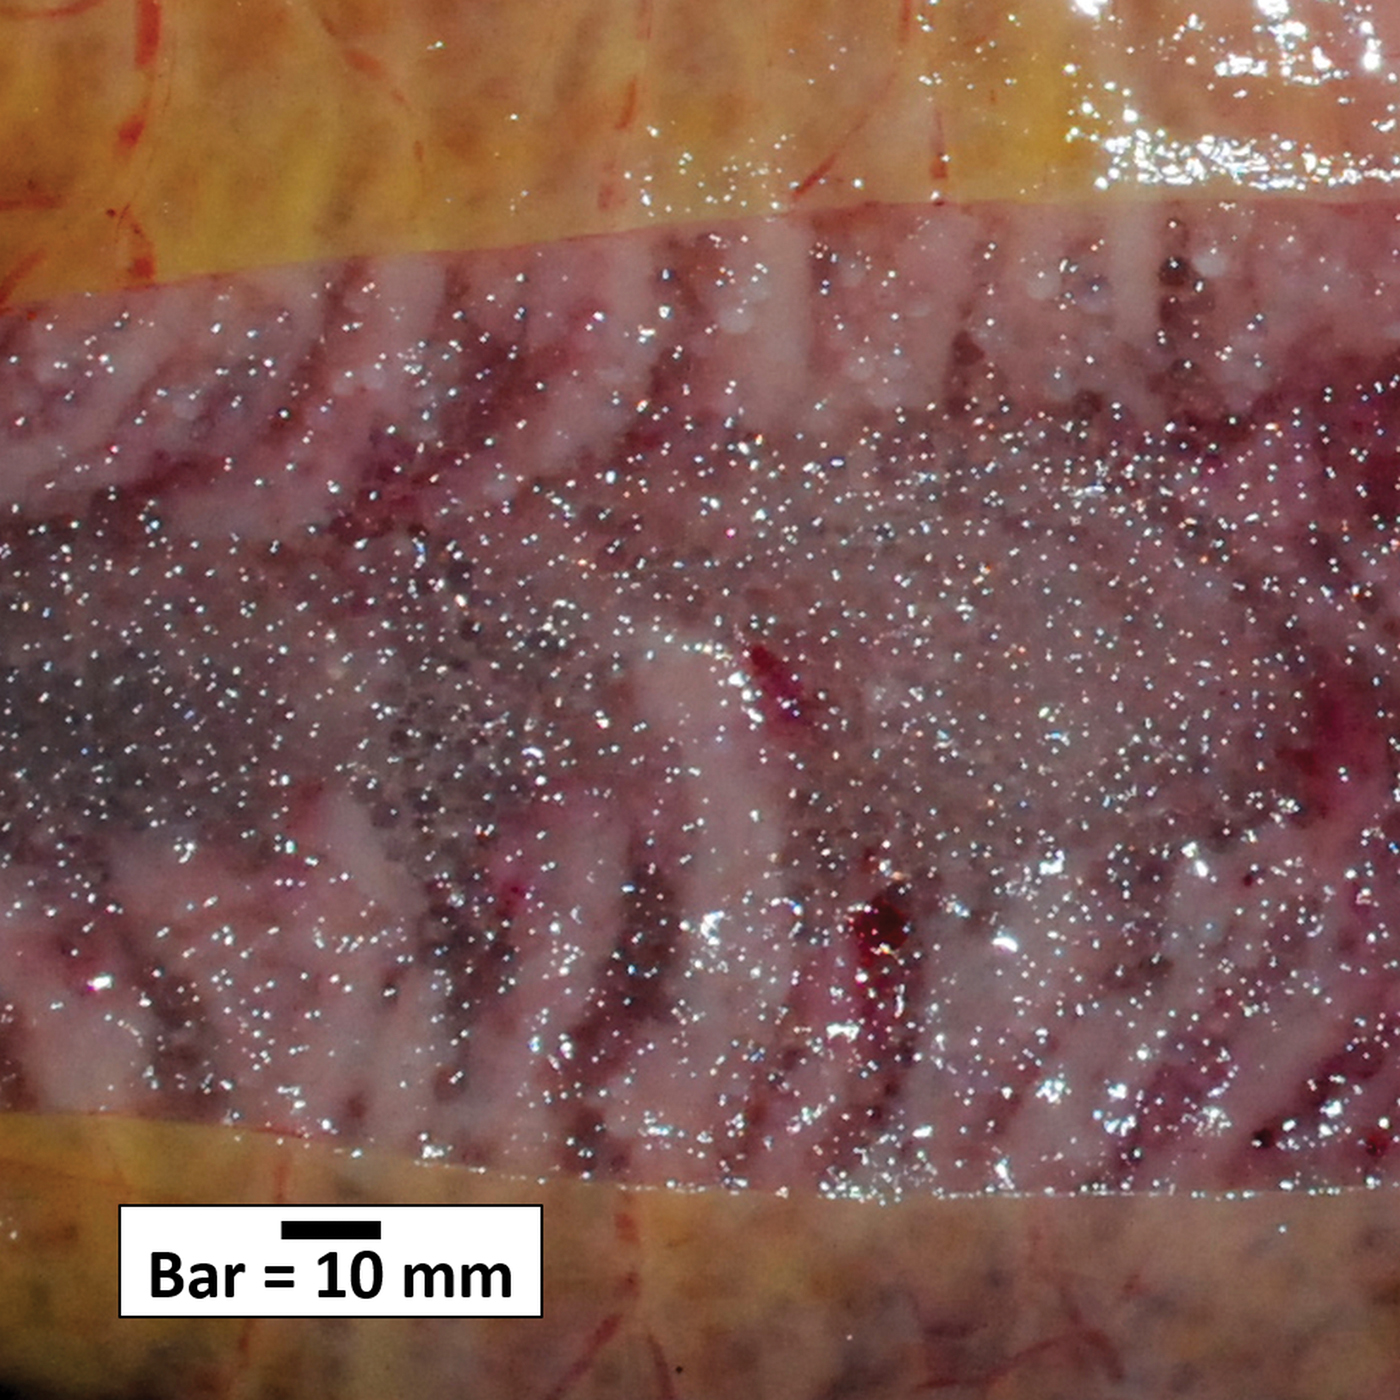
Fig. 5. Photograph of ‘running ripe’ loose ovulated eggs of a female Dissostichus mawsoni gonad.
Table II. Numbers of Dissostichus mawsoni at each Commission for the Conservation of Antarctic Marine Living Resources (CCAMLR) gonad stage (2 = resting, 3 = developing, 4 = ripe, 5 = spent; see CCAMLR 2011) by sex (F or M) for each day of the survey. Days with no numbers indicate no catch was landed on that day.

Gonadosomatic index
The GSI was calculated for 1058 male and 395 female D. mawsoni. Males and females had different GSI values just prior to spawning. The males had a narrow distribution with a mode at 9% and a maximum of 17%, while females had a broader distribution with a main mode at 17% and a maximum of 35% (Fig. 6). A second, smaller mode for females near 5% comprised mainly spent fish and resting/maturing fish. Fish staged as ‘resting’ and with GSI of < 8% (the lower mode) in June were likely to skip spawning in the current season (n = 40/332 or 12.0%; see Jørgensen Reference Jørgensen, Ernande, Fiksen and Dieckmann2006, Parker & Grimes Reference Parker and Grimes2010).

Fig. 6. Histograms of gonadosomatic index (GSI) by for male (left) and female (right) Dissostichus mawsoni collected during the summer fishery in the northern Ross Sea region in 2016 and the winter survey.
The GSI in the northern Ross Sea region fishery samples was near 4% for females and 3% in males, showing little change during December and January. Values increased from February through a peak in late June, followed by a decrease during spawning (Fig. 7). Similar patterns were observed for females and males, with the timing of male development slightly advanced compared to females.

Fig. 7. Boxplots of weekly gonadosomatic index (GSI) distributions for female and male Dissostichus mawsoni in the northern Ross Sea region from fishery and survey data from 1997 to 2017. Box width is proportional to sample size in each week. Horizontal lines indicate the median, boxes the interquartile range, dashed lines 1.5 times the interquartile range and dots values outside that range.
Condition factor
Both male and female condition factors were the same in winter as they were in the previous summer samples (Fig. 8). The GAM supported the results of the t-test, showing no indication of an increase in condition, which would be expected if fish with higher condition factors from the slope were to migrate to the northern region (Table I). This comparison assumes that the energetic costs of a migration north would not result in a degraded condition of the magnitude observed between the two areas during the summer period (c. 12%).

Fig. 8. Sex-specific condition factors for male (left) and female (right) Dissostichus mawsoni from the summer fishery in the northern Ross Sea region in 2016 and the winter survey.
There was no distinct group of males or females with low condition factors. Of the 1460 D. mawsoni sampled, 257 D. mawsoni were in poor body condition as qualitatively evaluated on board, c. 15% of the total landed. The condition factor of the 15th percentile for females was 0.52, and for males it was 0.95, which could be used as nominal thresholds for evaluating poor body condition (Fenaughty et al. Reference Fenaughty, Eastman and Sidell2008) (Fig. 8).
Age distribution
A total of 466 pairs of otoliths were collected from D. mawsoni. No difference was detected in the scaled age distributions for males between the summer and winter samples (as per length) (Fig. 9 & Table I).

Fig. 9. Age distributions scaled to total catch for male (left) and female (right) Dissostichus mawsoni caught in the summer 2016 fishery and the subsequent winter 2016 survey.
Discussion
Understanding the stock structure of exploited fish populations is a difficult yet key component of fisheries management. In polar environments, this is even more challenging because the population is often difficult to access for samples because of sea ice, depth and remoteness. Dissostichus. mawsoni has the additional characteristic that a population can be distributed over a large area, in this case the entire Ross Sea gyre, which spans more than 3 million km2 from the Antarctic coast to seamounts deeper than 2000 m near 60°S and is under sea ice for more than half of the year (Hanchet et al. Reference Hanchet, Dunn, Parker, Horn, Stevens and Mormede2015).
The most similar ecological analogues of D. mawsoni are probably Pacific halibut (Hippoglossus stenolepis), Atlantic halibut (Hippoglossus hippoglossus) and sablefish (Anoplopoma fimbria). These species share characteristics of longevity, long ontogenetic migrations, pelagic eggs, long larval phases, a large geographic distribution and the ecological niche of a large piscivore. Life history research with these species has used archival tagging (among other techniques) to understand movement patterns (Webster et al. Reference Webster, Clark, Leaman and Forsberg2012, Echave Reference Echave2016, Le Bris et al. Reference Le Bris, Fisher, Murphy, Galbraith, Castonguay and Loher2018), a technique not yet applied to D. mawsoni due the prevalence of sea ice and the depths they inhabit. However, D. mawsoni appears to show similar characteristics. Eggs and larvae are distributed over large areas by currents spanning more than a year (Hanchet et al. Reference Hanchet, Dunn, Parker, Horn, Stevens and Mormede2015), followed by a slow ontogenetic migration back to the spawning areas. Seasonal movements appear restricted to seasonal changes in depth (Kimura et al. Reference Kimura, Shimada and Shaw1998, Webster et al. Reference Webster, Clark, Leaman and Forsberg2012, Jasonowicz et al. Reference Jasonowicz, Goetz, Goetz and Nichols2016, Le Bris et al. Reference Le Bris, Fisher, Murphy, Galbraith, Castonguay and Loher2018).
The 58 day survey demonstrated that winter studies are feasible in the northern Ross Sea region given flexibility regarding variations in the seasonal ice extent. The catch rates suggest that running ripe toothfish are still attracted to bait (i.e. feed) close to spawning, although the variability in catch rates was higher than in the summer period.
The skewed sex ratio observed in the north is likely driven by a combination of factors, but the relative influence of each factor is not known. One major influence is that males mature at almost four years younger than females (Parker & Grimes Reference Parker and Grimes2010). Maturing at a younger age combined with a movement of mature fish to the north creates a skew in the observed sex ratio in the north. A second factor is likely the effect of fishery removals, which mostly target the high-density areas of the continental slope. The sex ratio on the slope is biased towards females (as males migrate to the north at a younger age; Table III). These removals may then influence the numbers of females reaching the north. It is also possible that females have a higher level of natural mortality than males, or that females have a shorter residence time in the north than males, potentially to seek out areas with higher productivity to regain spawning condition.
Table III. Biological characteristics (mean values) of female Dissostichus mawsoni in the north and slope regions of the Ross Sea during summer (1997–2017) versus those observed during the winter survey in 2016. Catch rate is the vessel-specific catch rate for summer versus winter in 2016.

CV = coefficient of variation, VB = Von Bertalanffy growth model.
The observations of ripe males and females show that development progresses to a spawning period by early July, at least in the northern Ross Sea region. The duration and spatial extent of spawning remains unknown, but the significant decrease in GSI and observations of spent fish soon after ripe fish were observed suggest that the spawning season may be brief, at least on a local spatial scale. A small but significant proportion of females in the north appeared to have insufficient gonadal development to mature and spawn in the current season. It is not possible to determine the frequency with which an individual may skip spawning or how many successive seasons may be skipped. However, Parker & Grimes (Reference Parker and Grimes2010) concluded using histological analysis that all of the females examined in the north were developing to spawn in the upcoming season, and they also showed evidence of spawning in the previous season through the presence of post-ovulatory follicles, suggesting that skip spawning was not common.
Patagonian toothfish (Dissostichus eleginoides) were found mainly in the north-western Ross Sea region (see Fig. 1). The developmental stages of the few D. eleginoides captured were much less advanced than those of D. mawsoni, indicating a much later spawning season in that region. Timing of spawning may be one mechanism that creates species reproductive isolation.
Hanchet et al. (Reference Hanchet, Dunn, Parker, Horn, Stevens and Mormede2015) hypothesized several changes that should be observed in the northern population in winter if the mature portion of the younger, fatter and higher percentage female population on the slope migrated to the northern seamount areas to spawn. This migration could occur between the end of the summer fishery (February) and a winter spawning season (July–August), returning to the slope before the following summer fishery (December). However, our results showed no difference in size and age composition, condition factor or sex ratio between the December fishery samples and samples collected in June and July in the northern Ross Sea region (Table III).
There are two possible explanations for the lack of change between the summer and winter samples. The summer population in the northern area could be so large that the fish arriving from the slope have no measurable effect on the biological characteristics of the population of toothfish in the north. This is not supported by spatial population modelling or mark-recapture estimates of population size that suggest < 18% by number (37% by biomass) of D. mawsoni in the Ross Sea region inhabit the small seamount areas in the north (Mormede et al. Reference Mormede, Dunn, Hanchet and Parker2014b). Alternatively, the mature slope fish may not migrate to the north and simply spawn on the continental slope, leaving all observed movement of tagged fish to the north as ontogenetic movement. A slow dispersal away from seamounts would explain the shorter residence time in the north observed in tagged toothfish compared with those on the slope (Hanchet et al. Reference Hanchet, Dunn, Parker, Horn, Stevens and Mormede2015). A dispersal away from seamounts would also explain the occurrence of fresh adult D. mawsoni in sperm whale stomachs over deep water (Yukov Reference Yukov1971). This alternative is consistent with the numbers of tagged fish observed moving from the slope to the northern region and the few tagged fish moving from the north to the slope region (i.e. a return migration; Hanchet et al. Reference Hanchet, Dunn, Parker, Horn, Stevens and Mormede2015). It is also consistent with the current life history model (Hanchet et al. Reference Hanchet, Rickard, Fenaughty, Dunn and Williams2008, Ashford et al. Reference Ashford, Dinniman, Brooks, Andrews, Hofmann and Cailliet2012), where maturing fish follow northward flows across the shelf and off the slope to spawning areas and adult fish then follow the Ross gyre circulation back to the slope area.
The life history model proposed by Hanchet et al. (Reference Hanchet, Rickard, Fenaughty, Dunn and Williams2008) used the spatial patterns in fish size and age as well as larval dispersal simulations to show the relationship to the Ross gyre, but it used differences in diet, the need to regenerate condition after spawning and chemical composition of tissues to suggest a return migration to the slope to feed, although perhaps not annually. Stable isotope data suggest that the muscle tissue of D. mawsoni in the north shows a source diet from the slope area composed of fishes such as channichthids and macrourids. This indicates a low residence time in the north before returning to the slope for feeding (Pinkerton et al. Reference Pinkerton, Bury, Brown, Forman and Kilimnik2014). Indeed, diet studies conclude that D. mawsoni in the north feed mainly on macrourids, Antimora sp. and squid, with a higher percentage of fish with empty stomachs (Stevens et al. Reference Stevens, Dunn, Pinkerton and Forman2014). A long northern residence time is also not supported by low muscle tissue mercury levels in toothfish (Hanchet et al. Reference Hanchet, Tracey, Dunn, Horn and Smith2012). Mercury levels were high in three main prey species in the north, but lower in prey species on the slope. Both the mercury and stable isotope results based on muscle tissue samples could be biased because mature D. mawsoni may partition energy to liver and gonad tissues for spawning activities.
It is still unclear how, when or whether the spawning adults inhabiting the northern region recover body condition post-spawning. While both Hanchet et al. (Reference Hanchet, Rickard, Fenaughty, Dunn and Williams2008) and Ashford et al. (Reference Ashford, Dinniman, Brooks, Andrews, Hofmann and Cailliet2012) suggest a return to the slope area, there are few tagging data to support this, while at the same time tagging data suggest a residence of only 2–4 years in the north. If fish slowly leave northern seamounts, their destination or fate remains unknown. Hypotheses that the lower condition factor in the north signals a higher natural mortality in these fish is also problematic because spatial patterns in condition factor can have a number of drivers that may not be related to nutritional state and could simply indicate a different allometric growth function for adult fish (Le Cren Reference Le Cren1951, Froese Reference Froese2006, Thorson Reference Thorson2015).
These winter observations show that spawning does occur in the northern Ross Sea region as hypothesized (Hanchet et al. Reference Hanchet, Dunn, Parker, Horn, Stevens and Mormede2015), but do not support an annual return spawning migration of mature toothfish between the Ross Sea slope and the northern seamounts. There are several implications of this for management of the Ross Sea region toothfish fishery, especially with regards to the RSRMPA. For example, if D. mawsoni spawns in situ (i.e. with no annual migration), then the effects of fishery removals in the north, slope and Special Research Zone of the RSRMPA will depend on the spatial source of recruitment to the overall population. If recruits are generated mainly from the northern seamount areas, then the mature spawning biomass on the slope may not contribute substantially to recruitment. This in itself may not be problematic, as historical recruitment would also have been subjected to the same dynamics. However, a change in the relative biomass between the two areas could have a disproportionate effect. For example, if spawning biomass was reduced more in the north than on the slope and recruitment was linked mainly to the northern population, recruitment could be more impacted. Spatial population models (Mormede et al. Reference Mormede, Dunn, Hanchet and Parker2014b) could be used to explore the potential effects of these dynamics.
Acknowledgements
We thank the Italian National Programme of Antarctic Research (PNRA) for providing Davide Di Blasi with the opportunity to participate in the survey under the project DISMAS (PNRA project 2015/B1.02). We thank the on-board scientific observers Mike Prasad (MPI observer) and Dawie Potgieter (CCAMLR international observer) for carrying out sample collection at the high sampling rates required for the survey, Colin Sutton for determination of ages from sampled fish and Simon Hoyle and Jennifer Devine for advice on statistical analysis. We also thank Talley's Ltd and the crew of the FV Janas for their safety focus, cooperation and assistance throughout the survey. Funding for the survey was provided by MPI project ANT201501. We thank the members of the New Zealand Ministry for Primary Industries Antarctic Working Group for their comments on this report.
Author contributions
SJP developed the concept and conducted analyses, DWS and DD performed experiments and SJP, DWS, DD, LG, ML and MV prepared and edited the manuscript.


