


Introduction
The western Antarctic Peninsula (WAP), a region of high phytoplankton production supporting a large and productive food web, is currently undergoing the most pronounced recent rapid regional warming in the southern hemisphere (Vaughan et al. Reference Vaughan, Marshall, Connolley, Parkinson, Mulvaney, Hodgson, King, Pudsey and Turner2003). Average air temperature on the WAP has increased at a rate of 3.6 ± 1.4°C per century, several times the global average (Vaughan et al. Reference Vaughan, Marshall, Connolley, Parkinson, Mulvaney, Hodgson, King, Pudsey and Turner2003). The majority of glaciers in the region are retreating, and the rate of this retreat is accelerating (Cook et al. Reference Cook, Fox, Vaughan and Ferrigno2005). At sea, an increase of > 1°C has been recorded in the surface waters in summer, decreasing to near zero at 100 m depth (Meredith & King Reference Meredith and King2005). There has also been a significant reduction in sea ice duration, with trends of later advance and earlier retreat in the Marguerite Bay area (Stammerjohn et al. Reference Stammerjohn, Martinson, Smith, Yuan and Rind2008).
Unique in its proximity to the Antarctic Circumpolar Current (ACC), the WAP is subject to frequent incursions of Circumpolar Deep Water (CDW), which transports heat, salt and nutrients (Klinck Reference Klinck1998) onto the shelf, thereby influencing water mass properties and productivity along the WAP. Martinson et al. (Reference Martinson, Stammerjohn, Iannuzzi, Smith and Vernet2008) showed increasing trends in ocean heat content over the shelf, consistent with an increase in frequency of CDW incursions, believed to be at least partially driven by changes in atmospheric circulation (Martinson et al. Reference Martinson, Stammerjohn, Iannuzzi, Smith and Vernet2008, Meredith et al. Reference Meredith, Wallace, Stammerjohn, Renfrew, Clarke, Venables, Shoosmith, Souster and Leng2010). The observed changes in glacial retreat are also consistent with warmer waters, as it has been shown that the temperature of marine waters can significantly impact the melt rates of marine-terminating glaciers (Pritchard et al. Reference Pritchard, Ligtenberg, Fricker, Vaughan, van den Broeke and Padman2012).
From a biological perspective, a key influence on primary productivity along the WAP is stratification, as a more stable water column provides higher average light levels to cells in near-surface waters, thus encouraging phytoplankton growth (Venables et al. Reference Venables, Clarke and Meredithin press). Changes in freshwater inputs, heat content, and the associated changes in sea ice cover can affect stratification, and therefore productivity in this region. Indeed, phytoplankton dynamics already show changes linked to sea ice cover and stratification in both the northern and southern regions of the WAP (Montes-Hugo et al. Reference Montes-Hugo, Doney, Ducklow, Fraser, Martinson, Stammerjohn and Schofield2009). In addition to light, growth of phytoplankton in Southern Ocean waters can be further limited by availability of micronutrients, primarily iron (Hoffmann et al. Reference Hoffmann, Peeken and Lochte2008). Freshwater inputs (surface runoff, glacial meltwater and groundwater) are clearly important to biological production due to their role in stratification, but are also a potential source of micronutrients such as iron (Raiswell Reference Raiswell2011), an element known to limit phytoplankton productivity in large regions of the Southern Ocean.
To address these topics, radium (Ra) in seawater was measured at a coastal Antarctic site at the WAP. Radium is produced continuously in both continental and deep sea sediments by the decay of the particle reactive element thorium (Th). Radium occurs naturally in seawater as four radioisotopes: the short-lived isotopes 223Ra and 224Ra (half-life (t1/2) = 11.435 days and t1/2 = 3.66 days, respectively), and the long-lived 226Ra and 228Ra (t1/2 = 1600 years and t1/2 = 5.75 years, respectively). Radium Delayed Coincidence Counting (RaDeCC), a radon (Rn) detection system proposed for use with Ra isotopes by Moore & Arnold (Reference Moore and Arnold1996), allows measurement of 223Ra and 224Ra in the field, as well as activity of progenitor radionuclides (actinium (227Ac) and 224Rasupported (= 228Th), respectively) following the decay of the short-lived isotopes.
The information obtained by RaDeCC analysis covers isotopes of different half-lives, as well as of different sources. The concentration of Ra isotopes is highest at sediment margins due to the Th source, and decreases away from these margins due to dilution and radioactive decay. In the case of 227Ac, the dominant source is deep water, open ocean sediments, where low sediment accumulation rates and deep overlying water columns lead to higher accumulation of the parent isotope than in shallow shelf settings (Geibert et al. Reference Geibert, Rutgers van der Loeff, Hanfland and Dauelsberg2002). The different sources and decay rates can be exploited to detect and differentiate multiple inputs (e.g. for different groundwater reservoirs) as well as to estimate rates of the processes affecting these inputs on different timescales. In the last two decades, the short-lived isotopes of Ra have been used in the Southern Ocean to investigate coastal mixing rates and eddy diffusivity coefficients (Charette et al. Reference Charette, Gonneea, Morris, Statham, Fones, Planquette, Salter and Garabato2007), water mass pathways (van Beek et al. Reference Van Beek, Bourquin, Reyss, Souhaut, Charette and Jeandel2008), iron inputs (Dulaiova et al. Reference Dulaiova, Ardelan, Henderson and Charette2009) and terrigenous material from icebergs (Shaw et al. Reference Shaw, Raiswell, Hexel, Vu, Moore, Dudgeon and Smith2011).
The aim of this study was to use Ra isotopes to further constrain the sources of surface water in Ryder Bay and the extent to which they interact with sediments, while establishing a baseline against which any future change in Ra distributions may be interpreted. These Ra radioisotopic data are the most southerly (67°34.02′S) reported to date. The relative importance of surface water sources, marine and glacial sediment interaction, and the timescales on which mixing processes occur will aid in understanding not only oceanographic processes and local circulation patterns, but also trace metal availability in a region of very rapid change (Wallace et al. Reference Wallace, Meredith, Brandon, Sherwin, Dale and Clarke2008, Meredith et al. Reference Meredith, Wallace, Stammerjohn, Renfrew, Clarke, Venables, Shoosmith, Souster and Leng2010).
Background
Study site and oceanographic context
Ryder Bay is a shallow (maximum c. 500 m) coastal embayment at the northern end of Marguerite Bay (Adelaide Island; Fig. 1), and is subject to processes that influence physical and biogeochemical conditions along the coastal WAP region (e.g. seasonal ice cover, glacial inputs). Largely representative of Marguerite Bay (Clarke et al. Reference Clarke, Meredith, Wallace, Brandon and Thomas2008), it is the site of the Rothera Oceanographic and Biological Time Series (RaTS) programme conducted by the British Antarctic Survey at nearby Rothera Research Station. This programme has monitored water column conditions and biological activity year-round in Ryder Bay since 1997 (Clarke et al. Reference Clarke, Meredith, Wallace, Brandon and Thomas2008). The accessibility of the RaTS site and long-term environmental dataset make this an ideal location for investigating mixing rates and sediment interaction in coastal WAP waters, in the context of understanding cycling of glacial- and marine sediment-derived micronutrients.
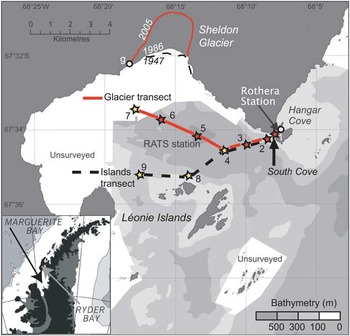
Fig. 1 Station numbers and locations in Ryder Bay. Red stations sampled 13–14 February, yellow stations sampled 25 February. Maximum depth is 520 m (at station 5, which is also the Rothera Oceanographic and Biological Time Series monitoring site). Station 1 is within South Cove, and is adjacent to the British Antarctic Survey's Rothera Research Station. Also shown is the edge of Sheldon Glacier, and the point used for glacially-derived mixing rates (denoted by “g”).
The oceanography of the Marguerite Bay region, and the WAP more broadly, differs from other Antarctic shelf regions in its large fluxes of glacial meltwater from land and proximity to the ACC (Clarke et al. Reference Clarke, Meredith, Wallace, Brandon and Thomas2008). In Ryder Bay, use of oxygen isotopes has identified meteoric (glacial and snow) water as the dominant source of the freshwater inputs to Antarctic Surface Water (AASW) during summer, as opposed to melting sea ice (Meredith et al. Reference Meredith, Wallace, Stammerjohn, Renfrew, Clarke, Venables, Shoosmith, Souster and Leng2010). The contribution of this meteoric water to the surface mixed layer varies annually, but is typically 2–6%, compared with maximum 2% sea ice meltwater (Meredith et al. Reference Meredith, Wallace, Stammerjohn, Renfrew, Clarke, Venables, Shoosmith, Souster and Leng2010). As such, the glacial influence in Ryder Bay surface waters is likely to be near the upper limit of the range relevant to the WAP (Clarke et al. Reference Clarke, Meredith, Wallace, Brandon and Thomas2008, and references therein).
Water masses along the WAP, as well as in Marguerite Bay and Ryder Bay, are well described (e.g. Clarke et al. Reference Clarke, Meredith, Wallace, Brandon and Thomas2008, Meredith et al. Reference Meredith, Wallace, Stammerjohn, Renfrew, Clarke, Venables, Shoosmith, Souster and Leng2010). Briefly, the dominant water mass at depth derives from warm (> 1.0°C), high-nutrient CDW, which intrudes onto the continental shelf in relatively unmodified form (Martinson et al. Reference Martinson, Stammerjohn, Iannuzzi, Smith and Vernet2008) due to the local absence of an Antarctic Slope Front (Klinck Reference Klinck1998). While CDW can be divided into upper (UCDW) and lower (LCDW) water masses, LCDW is present only in deep troughs (Moffat et al. Reference Moffat, Beardsley, Owens and van Lipzig2008) and it is UCDW that dominates above the continental shelf. Upward mixing of UCDW provides heat and macronutrients to the near-surface layers, and studies indicate that this mixing occurs primarily in coastal and shallow regions (Howard et al. Reference Howard, Hyatt and Padman2004, Wallace et al. Reference Wallace, Meredith, Brandon, Sherwin, Dale and Clarke2008). Above the UCDW, surface waters cool and gain salt during sea ice formation in autumn and winter, resulting in a seasonally deep mixed layer. The remnant of this persists into summer as a temperature minimum layer at depths around 100 m, termed winter water (WW). During summer, this WW layer is capped at the surface by lighter waters that have been warmed by insolation and freshened by meltwater, producing AASW.
Methods
Sample collection and processing
Samples for RaDeCC analysis were collected from a small boat using a 12 V impeller pump attached to acid-cleaned (10% HCl) silicon tubing. The tubing was rinsed with at least 25 l of seawater before collecting an appropriate volume (110–180 l) of seawater from 10 m depth into clean 20 l containers. Five samples were collected on 13 and 14 February 2010, along a transect from shore to the RaTS site, which is located c. 2 km from shore in Ryder Bay (station 5; Fig. 1). Mixing rates derived from RaDeCC measurements along this line were used to assess the potential of sediment-derived nutrient sources for near-surface productivity at this site. Following this transect, four additional samples were collected on 25 February 2010, in order to investigate potential input signals from nearby islands and Sheldon Glacier. Sampling transects are shown in Fig. 1.
Samples were slowly (c. 200 ml min-1; van Beek et al. Reference Van Beek, Bourquin, Reyss, Souhaut, Charette and Jeandel2008) passed through a column filled with c. 20 g loosely-packed MnO2-impregnated acrylic fibre, which quantitatively adsorbs Ra from seawater (97% extraction for samples up to 400 l; Moore Reference Moore2008). The Mn-fibre was then rinsed with Milli-Q water (Millipore systems) to remove salts and particles. Excess water was removed by squeezing, and a moisture to fibre ratio of 0.3–1 gH2O:gfibre was maintained in order to maximize movement of Rn from the columns to the counting chambers.
Columns were then introduced into the RaDeCC system, following full sample preparation and processing procedures as described by Moore (Reference Moore2008). Counting was performed for as long as possible whilst still allowing all samples from a single sampling event to be analysed within a two day period. Counting time averaged 1000 min per sample, and in all cases exceeded 400 min.
Raw counts were corrected as described by Garcia-Solsona et al. (Reference Garcia-Solsona, Garcia-Orellana, Masqué and Dulaiova2008) and Moore (Reference Moore2008), and converted to 223Ra and 224Ra activities in decays per minute (dpm) using the efficiencies measured for each scintillation chamber (c. 0.35 and 0.60, respectively). Detector efficiency was monitored using standards obtained from the International Atomic Energy Agency (Monte Carlo, Monaco) and prepared at LEGOS, OMP (Toulouse, France), according to published methods (Dimova et al. Reference Dimova, Dulaiova, Kim and Burnett2008, Moore Reference Moore2008, Scholten et al. Reference Scholten, Pham, Blinova, Charette, Dulaiova and Eriksson2010). Standards were measured several times throughout the duration of the study to monitor detector efficiency. Problems have been reported with decay of 227Ac standards (≤ 12%; Scholten et al. Reference Scholten, Pham, Blinova, Charette, Dulaiova and Eriksson2010) in the first c. 50 days after preparation, although we were unable to assess this for our standards due to the timing of preparation and measurement. As this would affect only absolute (not relative) activities and are within the error reported here, this effect is not considered further.
All samples were measured at least four times in order to correct for interference from longer-lived Ra isotopes. Initial counting was done as soon after collection as possible, and samples were re-counted after 8, 21, and > 90 days to correct for interference from 224Ra, 224Ra supported by 228Th, and 227Ac, respectively.
Estimation of error followed the equations of Garcia-Solsona et al. (Reference Garcia-Solsona, Garcia-Orellana, Masqué and Dulaiova2008), with minor changes to the error propagation in correcting for long-lived isotopes. In our case, the third and fourth counts were used to estimate 228Th and 277Ac, respectively. Interference from these sources was assumed to be constant and therefore not corrected for time since sample collection. Ingrowth of 228Th from 228Ra was not accounted for, as this contributed < 1% of 228Th in all cases. These long-lived interferences were subtracted from the time-corrected first counts according to the formula:
 $$ {{A}_{ex}}\: = \:{{A}_1} \,\cdot \,{{e}^{{\rm{ - }}\lambda {\rm{t}}}} \,{\rm{ - }} \, {{A}_{3/4}}, \eqno\rm$$
where Aex is the excess activity (at the time of collection), A 1 is the activity measured in the first count, A 3/4 is the activity measured during the third or fourth count, $\lambda$ is the decay constant of 223Ra or 224Ra, and t is the time between collection and the first count. Error combination followed the standard formula:
 $$ \rDelta A_{{ex}}^{2} \: = \:{{(\rDelta {{A}_1} \,\cdot \,{{e}^{{\rm{ - }}\lambda t}} )}^2} \: + \:\rDelta A_{{3/4}}^{2}, \eqno\rm$$
where Δ denotes the absolute error of each term. Note that reported 227Ac has not been corrected for activity supported by 231Pa. Assuming 231Pa to be c. 0.1 dpm m-3 (determined by Geibert et al. (Reference Geibert, Rutgers van der Loeff, Hanfland and Dauelsberg2002) for surface waters south of the Antarctic Polar Front), the corrected 227Acex would be 0.1 dpm m-3 less than the numbers shown here.
Gamma counting
Once the analyses using RaDeCC were performed, the Mn-fibres were ashed (16 h at 820°C) and transferred into sealed vials for gamma counting, following Charette et al. (Reference Charette, Buesseler and Andrews2001). Radium isotopes adsorbed on MnO2 ash were analysed using low-background gamma-ray spectrometry at the underground laboratory of Ferrières (LAFARA, LAboratoire de mesure des FAibles RAdioactivités) located in the French Pyrénées, 100 km from Toulouse (van Beek et al. Reference Van Beek, Souhaut and Reyss2010, van Beek et al. Reference Van Beek, Souhaut, Lansard, Bourquin, Reyss, Jean and von Ballmoosin press). Radium-228 activities were determined using the 338, 911 and 969 keV peaks of 228Ac. Uncertainties reported for 228Ra activities are errors due to counting statistics (one standard deviation).
Results
Oceanographic context
Seasonal records of water column conditions are available for station 5 (the RaTS Site) as part of the RaTS monitoring programme (British Antarctic Survey, Cambridge, UK). Upper layer temperature and salinity data indicate a typical seasonal progression from well-mixed wintertime waters in November (with temperatures < 0°C and comparatively high salinity) to more stratified summer conditions characterized by warmer surface waters (> 1°C) and significant freshening due to meltwater input (salinity as low as c. 33.1; Fig. 2). Beneath the summertime surface layer, the WW layer is apparent as a temperature minimum at c. 100 m depth, with properties largely dictated by those of the previous winter mixed layer.
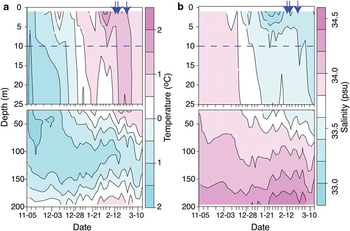
Fig. 2 a. Temperature, and b. salinity at station 5 (Rothera Oceanographic and Biological Time Series monitoring site). The top 25 m is expanded in the top plots. Arrows show dates of sampling, and dashed line marks sampling depth (10 m). Data courtesy of BAS.
From these temperature and salinity records, it can be seen that physical conditions between the two sampling events were very similar, implying that no significant upwelling or mixing events occurred (such as might be expected during, for example, strong weather events), and that any lateral advection occurred within a relatively uniform water mass. We therefore interpret stations from both transects on the assumption that differences chiefly reflect steady-state diffusive and advective processes.
Short-lived isotopes
Activity of 223Raex (below detection limit (bdl)–0.649 dpm m-3) is considerably lower than that of 224Raex (0.066–14.6 dpm m-3), although both isotopes show very similar trends (Table I). Very low activities were found in the central, deep area of Ryder Bay (stations 3, 4 and 5; depth > 300 m; hereafter “mid-bay”), on average 0.023 and 0.076 dpm m-3 for 223Raex and 224Raex, respectively. The most pronounced enrichment is seen at station 1, nearest the shore (in South Cove, alongside Rothera Station) and in shallowest water depth (< 30 m). This high activity decreases with distance from the shore, through stations 1–5. An enrichment is also seen in the sample nearest the Léonie Islands group (station 8), which is sustained in 223Raex at station 9, but not in 224Raex. The two samples taken from nearer to Sheldon Glacier (stations 6 and 7) exhibit higher activities of 224Raex relative to mid-bay samples. This enrichment is also seen in 223Raex at station 7, although station 6 223Raex was below detection limits.
Table I Station details and short-lived radium activities from Radium Delayed Coincidence Counter (RaDeCC) analysis. As sample collection occurred on two occasions, station superscript “b” denotes samples from the second sampling event. Distances given are to the nearest shoreline for each individual station. For glacial stations, distances are given to a point on the edge of Sheldon Glacier (denoted in the table by *, location shown on Fig. 1).
bdl = below detection limit.
Many of the values reported here, especially those from central Ryder Bay, are below the detection limits estimated by Moore (Reference Moore2008) for RaDeCC analysis (0.2 and 0.5 total collected dpm for 223Ra and 224Ra, respectively). However, the background activity measured with our RaDeCC system was much lower than all samples analysed (mean 3% and 9% of raw counts for 219 and 220 channels, respectively) and reproducibility was good (c. 20% standard deviation for three consecutive readings). Furthermore, samples from similar areas display much less variation than the error of individual samples (see Discussion). Therefore we consider our results above the detection limit of RaDeCC analysis, except in the three cases noted in Table I.
Parent isotopes
The average activity of 227Ac is lower than that of 228Th (227Ac: 0.052–0.897 dpm m-3; 228Th: bdl–3.40 dpm m-3; Table II), in keeping with the relationship between the daughter nuclides (223Raex < 224Raex). The spatial distribution of 228Th is similar to that of 223Raex and 224Raex, with marked enrichment near Rothera station (South Cove, stations 1 and 2) and nearest the islands (station 8). As with 224Raex, the increase in 228Th near station 8 is not seen at station 9, slightly further from land and in deeper water.
Table II Progenitor isotope activities from Radium Delayed Coincidence Counter (RaDeCC) analysis (228Th and 227Ac) and gamma spectroscopy (228Ra). Also shown are ratios of 228Ra:227Ac. As in Table I, station superscript “b” denotes samples from the second sampling event. All activities are given in dpm m-3.
bdl = below detection limit.
The distribution of 227Ac shows very different trends from the short-lived Ra isotopes. The highest activity reported (0.897 ± 0.217 dpm m-3) is at station 7, nearest Sheldon Glacier, with all other stations displaying less than half of this value. Excluding station 7, the trends of 227Ac are roughly opposite to those of the Ra suite, with mid-bay stations displaying high values (0.37 ± 0.02 dpm m-3), and nearshore stations (1, 2, 8, 9) having slightly lower activities of 0.29 ± 0.17 dpm m-3, although these are not statistically different to mid-bay waters.
Long-lived Ra isotopes
The long-lived Ra isotope 228Ra shows slightly different trends from the short-lived isotopes (Table II). Station 1 again shows enrichment, although this is minor compared with the enrichment seen in 223Raex, 224Raex and 228Th. Stations 3–5 show relatively consistent values (c. 17.5 dpm m-3) but, in contrast to other Ra isotopes, station 2 displays lower activity than the mid-bay stations. The highest 228Ra activity was measured at station 6, coincident with a peak (although not to maximum activity) of 228Th.
Due to the different sources of each radioisotope, ratios such as 228Ra:227Ac can be helpful in distinguishing between different source waters. Station 6 shows a peak in the ratio of 228Ra:227Ac (Table II). A second peak is seen at station 9, and a minimum at station 7, although these latter variations are driven by the activity of 227Ac, and within error these ratios are not significantly different from the average for other stations.
Discussion
Radium sources to Ryder Bay
From the activities of 223Raex and 224Raex along both transects, we identify sources near South Cove, the Léonie Islands, and Sheldon Glacier. Station 1, with the shallowest water depth and short distance from shore, would be expected to exhibit the greatest activity, and indeed shows strong enrichment in 223Raex, 224Raex and 228Th.
Radium-223, in excess of that supported by decay of dissolved 227Ac, is produced from the decay of 227Th, which is strongly bound to sediments. Thus 223Raex displays a strong source along any interface (land-water or sediment-water). A clear enrichment in 223Raex is evident at station 1 (Table I), to values of 0.65 dpm m-3. To our knowledge, these are the first coupled short-lived Ra isotope activities reported for Antarctic waters. The only published 223Raex activities from coastal Southern Ocean waters are 0.42–5.2 dpm m-3, from waters within 2.6 km of the sub-Antarctic Iles Crozet (Charette et al. Reference Charette, Gonneea, Morris, Statham, Fones, Planquette, Salter and Garabato2007), generally higher than the range for this study (bdl–0.65 dpm m-3) but in keeping with activity in our South Cove sample. Further offshore from Iles Crozet, however, 223Raex dropped to 0.02–0.19 dpm m-3 (c. 12 km from shore; Charette et al. Reference Charette, Gonneea, Morris, Statham, Fones, Planquette, Salter and Garabato2007), in close agreement with the values reported here for distances of 0.5–2 km.
As with 223Raex, 224Raex shows a strong signal of enrichment from sediments due to its Th progenitor. The decay of 228Ra, present mainly in the dissolved phase, produces 228Ac, which quickly decays (t1/2 = 6.15 h) to 228Th. This 228Th is rapidly scavenged and slowly releases 224Ra from sediments. In coastal areas, 228Th may also be sourced from the surrounding rock in addition to its production within the water column, and indeed this terrigenous source is much greater than the marine source. Published values for 224Raex range from 3.1–47 dpm m-3 (Iles Crozet; Charette et al. Reference Charette, Gonneea, Morris, Statham, Fones, Planquette, Salter and Garabato2007) and 8–17 dpm m-3 (coastal Antarctic Peninsula surface waters; Dulaiova et al. Reference Dulaiova, Ardelan, Henderson and Charette2009). Only station 1 of the Ryder Bay samples falls within this range (14.6 dpm m-3), although other nearshore samples clearly show this land-interface signal.
This shore-derived signal is transported offshore, and stations 2 and 8, both at similar distances from the shoreline (South Cove and Leonie Islands, respectively) and at similar depths, display very similar activities of all nuclides measured here (Tables I & II). Station 9 also shows some enrichment in 223Raex relative to mid-bay samples, which does not appear in the other isotopes. This could be explained by slow mixing such that 224Ra, with its shorter half-life, would decay more quickly than 223Ra during a given period of mixing. Additionally, the difference in signal between these two isotopes may be small, as the errors on 223Raex are relatively large due to the much lower activity of this isotope and sampling constraints preventing the collection of larger volume samples. This signal of higher activities in the nearshore sampling locations is consistent with a Ra source from surrounding rocks, and/or production of Ra in shallow marine sediments.
Notably, there are also enrichment signals towards Sheldon Glacier which, in the case of 224Raex, 228Th and 228Ra, are very high given the distance from land at these stations. Glacial flour, subglacial and/or surface meltwater flows, or sediment/seawater interaction beneath the ice shelf could all potentially act as sources for Ra enrichment near Sheldon Glacier. While we are unable to discriminate here between these processes, it is probable that the signal is at least partly derived from the glacier (and entrained terrigenous material) itself. Shaw et al. (Reference Shaw, Raiswell, Hexel, Vu, Moore, Dudgeon and Smith2011) reported 224Raex activities of c. 1.2–9.4 dpm m-3 in surface waters near free-drifting icebergs in the Weddell Gyre, showing that glacial material alone can account for a highly significant 224Raex enrichment in the absence of any bottom sediments.
There is some variability between the activities at stations 6 and 7, although records of δ18O (Meredith et al. Reference Meredith, Venables, Clarke, Ducklow, Erickson, Leng, Lenaerts and van den Broekein press) in water samples at the RaTS site indicate similar proportions of meteoric (glacial/snow) water in the water column on both sampling days. Thus we infer that glacial sources of Ra are highly variable, as might be expected given the potential for different processes (ice melt versus subglacial sediment-water mixing) to contribute terrigenous material, in addition to potential differences in the composition of that material. Additionally, small-scale flow filaments could contribute to different Ra activity being collected from these two stations, even if sediment composition were invariant. Despite this variability, the average activities at stations nearest Sheldon Glacier show a clear signal of all four Ra nuclides (Fig. 3). “Glacier” stations exhibit statistically higher 224Raex and 228Th than mid-bay samples (3.30 dpm m-3 vs 0.78 dpm m-3, P = 0.0344; 0.24 vs 0.027, P = 0.050; respectively, two-sample t-tests). The two glacier stations show very different 223Raex activities, consistent with high variability of glacial sources. One sample is below the detection limit, but activity nearest the glacier (0.277 dpm m-3, station 7) is an order of magnitude higher than the mid-bay average of 0.023 dpm m-3, indicating an intermittent but significant glacial source of 223Raex, as with 224Ra.

Fig. 3 Radium activities grouped by location type, and relative to the highest measured activity (in all cases at station 1 (shore), error bars show sample uncertainty). Nearshore stations: 2, 8 and 9. Mid-bay stations: 3, 4 and 5. Glacier stations: 6 and 7. Error bars on nearshore, mid-bay and glacier stations represent one standard deviation, except in the case of 223Raex at the glacier station where sample error is shown because only one sample was above the detection limit.
Trends in 228Ra are also consistent with a glacial source, as station 6 displays pronounced enrichment to an activity approximately twofold higher than at station 1 (Table II). While variable, average 228Ra was 28.3 dpm m-3 near the glacier, compared to 18.9dpmm-3 in mid-bay stations, although this difference was not statistically significant (P = 0.236). The highly significant enrichment at station 6 leads to elevated 228Ra:227Ac ratios (Table II) compared to all other stations, suggestive of a distinct water source that is enriched in 228Ra. This enrichment, coupled with the very low 227Ac activity (produced in deep ocean sediments - see below) indicates a terrestrial source, consistent with glacial meltwater. In keeping with its much longer half-life (t1/2 = 5.75 years), the distribution of 228Ra shows less variability between the different location types than the shorter-lived isotopes. Due to its long half-life, variations in 228Ra activity within Ryder Bay must reflect dilutive processes, rather than decay during advection which is seen in the shorter-lived isotopes. The increase in 228Ra activity near the glacier is consistent with an input of enriched water to the surface, as by a thin lens of glacial meltwater. Even a modest extent of mixing with the underlying water column would then dilute this signal due to the very small relative volume of a thin meltwater lens, in accordance with the lower values of 228Ra in mid-bay stations.
Deep water renewal
Activities of the short-lived isotopes of Ra and their progenitors are low compared to many coastal areas (Table III). Few studies have examined Ra isotopes in Southern Ocean locations, but the scarce data suggest that as a whole the Southern Ocean displays low Ra activity, except for 226Ra (Hanfland Reference Hanfland2002) which decays much more slowly (t1/2 = 1600 years). Reported activities for 223Ra and 224Ra in coastal areas of the Antarctic Peninsula (Dulaiova et al. Reference Dulaiova, Ardelan, Henderson and Charette2009) and Iles Crozet (Charette et al. Reference Charette, Gonneea, Morris, Statham, Fones, Planquette, Salter and Garabato2007), as well as waters offshore of Iles Kerguelen (van Beek et al. Reference Van Beek, Bourquin, Reyss, Souhaut, Charette and Jeandel2008) are higher on average than those reported here, but the ranges overlap in all cases.
Table III Mean (range) activities for short-lived Ra isotopes (223Raex and 224Raex) and their parent isotopes (227Ac and 228Th/228Ra). Ranges of activities reported from similar environments are also given for comparison. All activities are given in dpm m-3.

aFrom the South Atlantic Bight.
bFrom the Mississippi and Atchafalaya River mixing zones, and Tampa Bay, Florida (for samples with salinity > 27 parts per thousand).
bdl = below detection limit.
For coastal waters, the activities of short-lived Ra isotopes reported here are extremely low. Studies from the Iles Crozet and South Shetland Islands (Charette et al. Reference Charette, Gonneea, Morris, Statham, Fones, Planquette, Salter and Garabato2007, Dulaiova et al. Reference Dulaiova, Ardelan, Henderson and Charette2009) reported similar, very low ranges compared to locations outside the Southern Ocean. The South Atlantic Bight, for example, displays inshore Ra activities of 22.4 and 144 dpm m-3 (223Raex and 224Raex, respectively; Moore Reference Moore2000a) - up to four orders of magnitude higher than those in Ryder Bay. However, even other Southern Ocean samples, when compared by distance from shore, have high activity compared to Ryder Bay. As such, the 223Raex and 224Raex activities in Ryder Bay are among the lowest reported for an inshore (< 5 km) setting.
Activities are especially low in the case of mid-Ryder Bay samples, where mean 223Raex was 0.023 dpm m-3, and that of 224Raex was 0.76 dpm m-3. Activity of 223Raex offshore from Iles Crozet is reported as 0.02–0.19 dpm m-3 (c. 12 km from shore; Charette et al. Reference Charette, Gonneea, Morris, Statham, Fones, Planquette, Salter and Garabato2007), and the Ryder Bay values are in keeping with the lower limit of this range despite being significantly closer to shore. Low values of 224Raex were also observed in Southern Ocean surface waters: Dulaiova et al. (Reference Dulaiova, Ardelan, Henderson and Charette2009) reported 224Raex activities of 2–4 dpm m-3 above the continental shelf, while Drake Passage/ACC waters were found to contain no 224Raex. The activities measured here for mid-Ryder Bay samples are in keeping with offshore waters, suggesting limited input from sediment-water interaction, coastal runoff or submarine groundwater discharge. Taken together, the activities of both short-lived Ra isotopes in central Ryder Bay suggest an open ocean source for surface waters, with slow diffusion of Ra enrichment derived from interfaces (sediment-water and land-water).
The distribution of 227Ac is very different from that of short-lived Ra species. Actinium-227 is produced from decay of 231Pa, which itself is produced from 235U, an isotope with a near-uniform distribution throughout the global ocean. Upon production, 231Pa is rapidly scavenged, and builds up in slowly-accumulating deep sea sediments (Geibert et al. Reference Geibert, Rutgers van der Loeff, Hanfland and Dauelsberg2002). Thus the deep sea is a major source for the more soluble 227Ac which diffuses out of the sediment into the overlying bottom water. Geibert et al. (Reference Geibert, Rutgers van der Loeff, Hanfland and Dauelsberg2002) showed that UCDW and LCDW can be distinguished based on their 227Ac activities, with the deeper LCDW having higher activity. However, Shaw & Moore (Reference Shaw and Moore2002) showed that in surface waters of the Southern Ocean, enrichment of 227Ac can also be seen in continental shelf and coastal regions due to decay of terrigenous 235U in shelf sediments: a global dataset of 227Ac by delayed coincidence counting has demonstrated that 227Ac is supplied to some extent by coastal environments (Geibert & Vöge Reference Geibert and Vöge2008).
The 227Ac values reported here, with the exception of station 7, show highest activities in mid-bay samples (0.37 ± 0.02 dpm m-3). The higher activity at station 7 may be due to a glacial source with extremely high spatial and temporal variability, as is indicated by the Ra isotopes. However, since there is no definitive single explanation for the higher values at station 7, we restrict discussion of 227Ac data to mid-bay stations. Most sites along the islands transect are within error of the mid-bay samples, and significant variations in 227Ac activity would not be expected, as the very long half-life of 227Ac (21.77 years) vastly exceeds the timescale relevant to circulation in Ryder Bay.
The mean mid-bay 227Ac activity of 0.37 dpm m-3 is somewhat higher than those reported by Shaw & Moore (Reference Shaw and Moore2002) for open Drake Passage surface waters (0.13–0.23 dpm m-3), and even for on-shelf sites around the South Shetland Islands and South America (0.20–0.27 dpm m-3). The greater activity may either reflect interaction with the continental shelf or slope, or 227Ac-rich source waters. Geibert et al. (Reference Geibert, Rutgers van der Loeff, Hanfland and Dauelsberg2002) studied 227Ac with depth in the Weddell Gyre and Drake Passage, finding that UCDW was characterized by 227Acex activities of 0.2–0.4 dpm m-3 (equivalent to 227Ac c. 0.43–0.75 dpm m-3). Waters in the Drake Passage were found to have slightly lower activities, with surface water reported at 0.10–0.27 dpm m-3 (Shaw & Moore Reference Shaw and Moore2002) and UCDW (c. 500 m) 227Ac activity measured as 0.37 dpm m-3 (supplemental data from Geibert et al. (Reference Geibert, Rutgers van der Loeff, Hanfland and Dauelsberg2002); we compare 227Ac activities rather than 227Acex to avoid introducing any uncertainty arising from an estimation of the 231Pa correction for our data). The values measured in Ryder Bay, especially the mid-bay stations, are in better agreement with the 227Ac of subsurface (500 m) Drake Passage waters than surface waters. Current understanding of regional circulation is that Marguerite Bay is subject to frequent but irregular incursions of UCDW at depth via Marguerite Trough (Martinson et al. Reference Martinson, Stammerjohn, Iannuzzi, Smith and Vernet2008, Moffat et al. Reference Moffat, Owens and Beardsley2009), with CDW being the ultimate source of waters in Marguerite Bay and Ryder Bay. This water mixes up into the WW and AASW layers, with mixing expected to occur primarily in coastal and shallow regions (Wallace et al. Reference Wallace, Meredith, Brandon, Sherwin, Dale and Clarke2008). Additionally, δ18O data at station 5 indicates that > 96% of the water at 15 m comes from CDW during the sampling period (Meredith et al. Reference Meredith, Venables, Clarke, Ducklow, Erickson, Leng, Lenaerts and van den Broekein press). The lack of enrichment in Ryder Bay 227Ac relative to UCDW values indicates very little continental shelf input of 227Ac.
However, 228Ra is higher than expected for open-ocean UCDW, indicating some recent interaction of the water mass with sediments, which also has the potential to contribute some 227Ac. Activity of 228Ra for Antarctic Polar Front and ACC waters has been reported as 0.25–2 dpm m-3 (see Charette et al. Reference Charette, Gonneea, Morris, Statham, Fones, Planquette, Salter and Garabato2007). Our measurements are an order of magnitude higher than these open water values, but consistent with surface waters near Iles Crozet (8.9–41 dpm m-3; Charette et al. Reference Charette, Gonneea, Morris, Statham, Fones, Planquette, Salter and Garabato2007) and in the Weddell Gyre (21–32 dpm m-3; Rutgers van der Loeff Reference Rutgers van der Loeff1994). Despite being higher than more oceanic regions, the activities measured here are still much lower than temperate coastal areas (e.g. 75–246 dpm m-3 in the South Atlantic Bight; Moore Reference Moore2000a), suggesting relatively minor 228Ra inputs relative to river-influenced locations.
The elevated 227Ac and 228Ra activities in Ryder Bay can be explained by a combination of the UCDW source water and modest interaction with the continental shelf or shelf-break. Indeed, the path of UCDW from the ACC onto the WAP shelf is consistent with a shelf-break or margin source, which has been proposed as a major contributor to oceanic micronutrient budgets (e.g. Jeandel et al. Reference Jeandel, Peucker-Ehrenbrink, Jones, Pearce, Oelkers, Godderis, Lacan, Aumont and Arsouze2011). While 228Ra indicates some continental shelf interaction, there is no observed enrichment in 227Ac relative to offshore UCDW, which is as expected for a shelf setting. Relatively shallow depths (c. 500 m) allow for limited 231Pa production, and a high rate of sediment accumulation on the shelf will dilute 231Pa in sediments, leading to low 227Ac release. The 227Ac activities also suggest negligible inputs from coastal or land sources. However, without depth profile samples it is not possible here to quantify 227Ac from terrigenous sources versus UCDW. We suggest that future work assessing 227Ac activities in deeper waters could aid in constraining the extent of UCDW incursions integrated over several years.
Mixing rates within Ryder Bay
Short-lived Ra isotopes have previously been used to estimate horizontal eddy diffusivity in other Southern Ocean waters (Charette et al. Reference Charette, Gonneea, Morris, Statham, Fones, Planquette, Salter and Garabato2007). If the distribution of Ra can be described by diffusion, as opposed to advection, then a one-dimensional diffusion model can be used to calculate eddy diffusion coefficients (kh) along an onshore-offshore transect, as developed by Moore (Reference Moore2000a). In this case, activity can be expressed according to the equation:
 $${{A}_x}\: = \:{{A}_o} \,\cdot \,{{e}^{{\rm{ - }}x\sqrt {{\lambda \mathord{\left/ {\vphantom {\lambda {{{k}_h}}}} \right. \kern-\nulldelimiterspace} {{{k}_h}}}} }}, \eqno\rm$$
where Ax and Ao are the activities at distance x (from shore) and at the source (x = 0), respectively, and $\lambda$ is the decay constant. From this equation, if ln(Ax) is plotted versus distance (x), the slope (m) can be expressed as follows:
 $$m = \sqrt {\lambda /{{k}_h}} .\eqno\rm$$
Thus the decay constant and slope from the ln(Ax) versus distance plot can be used to calculate kh (Moore Reference Moore2000a). This estimate of eddy diffusivity does not solely reflect eddy diffusion, and significant advection will result in a non-linear relationship, either concave (onshore advection) or convex (offshore) (see Dulaiova et al. Reference Dulaiova, Ardelan, Henderson and Charette2009). Thus, provided the data display a reasonably linear fit, the kh can be considered an “effective” horizontal eddy diffusion coefficient giving an estimate of offshore mixing (Charette et al. Reference Charette, Gonneea, Morris, Statham, Fones, Planquette, Salter and Garabato2007). For transects from South Cove into central Ryder Bay, the kh values determined for this study are 1.0 m2 s-1 for 224Raex (0.64 m2 s-1 if island stations are included) and 0.13 m2 s-1 for 223Raex (0.31 m2 s-1 if island stations are included; Fig. 4).

Fig. 4 a. Determination of effective eddy diffusivity coefficients (kh) based on activity of 223Raex and 224Raex versus distance for the islands transect. Due to the semi-enclosed nature of Ryder Bay, distance was measured to nearest land (including the islands), to better reflect a source of Ra in sediments which would be present along the entire shoreline, rather than solely at a fixed point such as South Cove. Shown are all stations along the islands transect as well as station 5 (the Rothera Oceanographic and Biological Time Series site). Filled symbols are those stations nearest the Léonie Islands group (stations 8 and 9); stations 1–5 are shown as open symbols. b. Effective eddy diffusivity coefficients (kh) from 224Raex for the glacier transect. Glacier transect distances are relative to a point on the edge of Sheldon Glacier (indicated in Fig. 1), included are stations 3–7.
As Ryder Bay is enclosed on three sides, a simple diffusion model may be inadequate to represent the pattern of circulation in Ryder Bay, and the data here are unlikely to fulfil the assumption that activity decreases to zero at some distance. However, while there are significant potential caveats in the determination of kh here, the semi-enclosed nature of Ryder Bay should contribute to higher Ra activities in mid-bay stations than if the only Ra source was a point source (i.e. station 1), which would result in the calculated mixing rates being overestimates. As a result, the overall magnitude of mixing suggested here (≤ 1.0 m2 s-1) is worthy of note.
This range of eddy coefficients from the islands transect (0.13–1.0 m2 s-1) is much lower than the 6.6–39 m2 s-1 range estimated by Charette et al. (Reference Charette, Gonneea, Morris, Statham, Fones, Planquette, Salter and Garabato2007). Both of these kh estimates are extremely low in comparison to those estimated for other coastal regions (e.g. 360–420 m2 s-1 for the South Atlantic Bight; Moore Reference Moore2000a) including the northern Antarctic Peninsula (596–63 000 m2 s-1; Dulaiova et al. Reference Dulaiova, Ardelan, Henderson and Charette2009). This strongly supports very slow diffusion from the margins to the centre of the bay, implying that mid-bay waters are sourced predominantly from more open ocean or deep waters, with very little influence from land-water exchange. Any sedimentary source of micronutrients (e.g. iron), would thus be expected to be very low in central Ryder Bay, and probably Marguerite Bay as well, and to occur via sediment-water interaction before the modified UCDW enters Ryder Bay. However, as noted above, 228Ra is higher than in open ocean surface waters, and the longer t1/2 reflects the longer timescale of the postulated sediment interaction. This interaction is probably on the order of several months to several years before the water enters Ryder Bay, while the very low short-lived Ra isotope activities reflect little or no input on the scale of one week to one month.
In addition to mixing rates, short-lived Ra measurements can also be used to estimate the length of time a water parcel has been isolated from the Ra source. Ratios of 224Raex:228Ra were used to estimate ages in mid-bay samples, following Moore (Reference Moore2000b) and Dulaiova et al. (Reference Dulaiova, Ardelan, Henderson and Charette2009). Taking the activity ratio at station 1 as the source end-member, stations 3–5 display Ra ages of 13, 14 and 18 days, respectively. The very low rates of horizontal transport determined above are consistent with these age estimates, as studies in other regions have found younger ages for water much farther offshore (e.g. Ra age of approximately seven days up to 150 km offshore; Dulaiova et al. Reference Dulaiova, Ardelan, Henderson and Charette2009).
Similar evaluation of kh was performed for the glacier transect. As Sheldon Glacier terminates over a large area at the northern end of Ryder Bay, distances were measured from an arbitrarily chosen point on the nearest ice-edge (shown in Fig. 1). As the calculation for kh depends on the slope of the plot versus x, only relative distances are taken into account, such that the absolute distance between source and sample does not affect the estimated kh. Due to the two values bdl for 223Raex, only 224Raex activity was used to assess kh, giving an estimate of 18 m2 s-1 for mixing between the area around Sheldon Glacier and mid-Ryder Bay (Fig. 4). In agreement, ages derived using station 7 ratios as a source (0.5 and 8 days, for stations 6 and 5, respectively), are considerably lower than those calculated for sediment sources. That the kh estimate for glacial mixing is an order of magnitude greater than the estimates for the islands transect may reflect the nature of the underlying dispersive processes. If the enrichment signal derives from glacial meltwater as postulated, this would be present in a shallow freshwater lens at the surface. This water could be differentially affected by processes that induce horizontal mixing at the surface (potentially atmospherically-forced; i.e. wind, inertial currents etc.), in addition to overall horizontal mixing occurring in the water column. This may potentially account for the faster effective horizontal diffusivity of a glacier-derived signal compared to that from sediments.
Previous studies have combined estimates of kh with 228Ra gradients to estimate offshore fluxes of 228Ra (see Dulaiova et al. Reference Dulaiova, Ardelan, Henderson and Charette2009). Following this approach, we used the islands transect stations, plus the RaTS site, to assess the gradient of 228Ra away from shore in Ryder Bay, which gave a slope of 0.61 ± 2.0 dpm m-3 km-1. There was considerable scatter in the data and the r 2 value for the regression (228Ra vs distance to nearest land) was very low (0.18). To obtain an upper estimate for 228Ra flux, we used an upper limit of the 228Ra-gradient slope plus error (2.6 dpm m-3 km-1) multiplied by the highest value estimated for kh (1.0 m-2 s-1; from 224Raex data along this transect), which gives a 228Ra flux of 230 dpm m-2 d-1. While there is a high degree of uncertainty in this calculation, reflected in the standard error of the slope, the magnitude of this upper 228Ra flux estimate is relatively low compared to other Southern Ocean locations. For example, the 228Ra flux calculated by Charette et al. (Reference Charette, Gonneea, Morris, Statham, Fones, Planquette, Salter and Garabato2007) around Iles Crozet is 1630–9660 dpm m-2 d-1. The estimate for Livingston Island (South Shetland Islands) is 31 900 dpm m-2 d-1, although the estimate for Elephant Island (South Shetland Islands) is very low (15.8 dpm m-2 d-1, Dulaiova et al. Reference Dulaiova, Ardelan, Henderson and Charette2009). We suggest that location plays a large role in determining fluxes: low values are found in Ryder Bay (coastal Antarctic), high values near Iles Crozet (sub-Antarctic islands), and the large range of the Dulaiova et al. (2009) study at the northern tip of the western Antarctic Peninsula may include regions with both Antarctic and sub-Antarctic characteristics. Our analysis shows that land-ocean inputs are low in the Antarctic environment, and as such ice-ocean fluxes may dominate in these regions.
Analysis by Cochran & Krishnaswami (Reference Cochran and Krishnaswami1980) determined that bioturbation is the dominant process contributing to sedimentary 228Ra flux, and as such our very low upper estimate of 228Ra flux may indicate a relatively low amount of bioturbation in Ryder Bay and/or the sediments underlying the path of water entering Ryder Bay. Marine surveys around Rothera Research Station report high abundances of benthic organisms and largely bare rock substrates (Smale et al. Reference Smale, Barnes, Fraser and Peck2008). Thus, it is more probable that the low Ryder Bay fluxes reflect comparatively low amounts of sediments in shallow (mixed-layer) waters, as opposed to scarcity of bioturbating organisms. Frequent scouring by icebergs, as is the case in shallow waters of Ryder Bay (Smale et al. Reference Smale, Barnes, Fraser and Peck2008), or the very steep sides of the bay, may also contribute to low amounts of sediment.
Conclusions
Here we present short-lived Ra isotope activities in a shallow embayment on the western Antarctic Peninsula, and the activities of their progenitor isotopes. These measurements are the most southerly to date. The activities of both 223Raex and 224Raex were low compared to other coastal Southern Ocean locations, and extremely low compared to those reported for low latitude regions.
Waters near Sheldon Glacier show a clear enrichment signal in 223Raex, 224Raex, and 228Ra. Although seawater-sediment interaction underneath the ice is also a potential source for this enrichment, material entrained within the ice itself is a more likely source, as other studies have found.
The mid-bay activities resemble relatively open water, indicating very little interaction with sediment-water or land-water interfaces, although elevated 228Ra indicates some continental shelf influence over timescales on the order of several months to years. The high activities of 227Ac reflect that the ultimate source for Ryder Bay surface waters is UCDW, which is known to intrude onto the WAP shelf episodically.
Horizontal mixing rates between mid-bay and shore waters are significantly slower than those reported for other coastal areas, consistent with relatively high Ra ages for such an environment. Given the slow mixing rates and extremely low short-lived Ra activities for a relatively shallow coastal environment, sediment interaction and coastal runoff are therefore not likely to be a major source of micronutrients to Ryder Bay. The mixing rate estimate for glacial to mid-bay waters, however, is more than an order of magnitude greater than those for non-glacial samples, indicating that glacially influenced waters represent a more dispersive source of terrestrial material (and any associated micronutrients) in coastal areas.
Acknowledgements
The authors would like to thank the Rothera Research Station marine staff, in particular Danny Edmunds, for help with sample collection, and the British Antarctic Survey for logistical support. Jan Scholten at the International Atomic Energy Agency in Monaco kindly provided standards, and helpful discussion regarding methodology. The editor (L. Padman) and two anonymous reviewers provided valuable comments to improve the manuscript. This work was supported by an Antarctic Science Bursary, Collaborative Gearing Scheme funding (through the National Environment Research Council, UK), the British Council-EGIDE ALLIANCE/Franco-British Research Partnership Programme, an NSERC scholarship and the University of Edinburgh.


