


Introduction
Ice thickness is a crucial parameter for ice mass balance calculations, ice flow modelling, etc. Although the ice thickness and subglacial topography model (Bedmap2) is developed for all Antarctica, it does not represent a number of small glaciers and ice caps located around Antarctica (Fretwell et al. Reference Fretwell, Pritchard, Vaughan, Bamber, Barrand and Bell2013), including these on the Argentine Islands (Fig. 1). Ice thickness measurements and accurate volume estimates, except for those for the Antarctic ice sheet, are known for only a few ice caps and glaciers (Davies et al. Reference Davies, Hambrey, Smellie, Carrivick and Glasser2012, Engel et al. Reference Engel, Nývlt and Láska2012). The newest Glacier Thickness Database (GlaThiDa, version 3.0.1) also does not include the glaciers of the Argentine Islands (www.gtn-g.ch/glathida). Despite relevant efforts in terms of ice mass balance calculations of Antarctica (Cook et al. Reference Cook, Holland, Meredith, Murray, Luckman and Vaughan2016), there are still areas where data coverage is limited or wholly lacking.

Fig. 1. Location of the Argentine Islands. Left. Antarctic Peninsula, prepared using the Scientific Committee on Antarctic Research Antarctic Digital Database (ADD). Right. The Argentine Islands and adjoining part of the Antarctic Peninsula, prepared using a Sentinel 2-A image (20160210T195419), copyright of European Space Agency, and a sea mask of ADD.
Glaciers across the Antarctic Peninsula (AP) are very sensitive and respond more directly to climate change (Rau et al. Reference Rau, Mauz, De Angelis, Jaňa., Neto and Skvarca2004). The warming in this region is considerable (Turner et al. Reference Turner, Colwell, Marshall, Lachlan-Cope, Carelton and Jones2005, Steig et al. Reference Steig, Schneider, Rutherford, Mann, Comiso and Shindell2009) and has an influence on glacier reduction trough temperature-albedo feedback mechanisms. A general retreat of glaciers around the AP has been observed since 1975 (Cook et al. Reference Cook, Holland, Meredith, Murray, Luckman and Vaughan2016). However, local glaciological investigations of small glaciers on islands at the western coast of the AP are rare (for a review on works before 1973, see Rundle Reference Rundle1973). Monitoring of glacier changes in selected areas of the AP has been conducted by Arigony-Neto et al. (Reference Arigony-Neto, Skvarca, Marinsek, Braun, Humbert, Júnior, Jaña, Kargel, Leonard, Bishop, Kääb and Raup2014) and others, but these studies usually do not investigate small ice caps. Other observations of glaciers near the Argentine Islands are very rare. For example, surveys on the ice ramp at Rothera Point on Adelaide Island suggest receding since 1989 (Smith et al. Reference Smith, Vaughan, Doake and Johnson1998), but it is also concluded that there is a substantial difference between sites located even very small distances apart and at similar elevations, emphasizing the fact that the local nature of meteorological conditions largely result from local topography.
To fully understand the responses of such sensitive glacial systems to climate change and to be able to predict their future behaviour, volumetric characterizations of individual glaciers and glacier bed topographies are necessary (Engel et al. Reference Engel, Nývlt and Láska2012). The first measurements of ice thickness across Graham Coast of the AP were done in the late 1960s using airborne ground-penetrating radar (GPR) (Smith Reference Smith1972), but often the main focus has been on the outlet glaciers and ice cover that are situated on the AP, and not on the numerous islands located off the coast of the AP. Nonetheless, measurements of the ice thickness and subglacial topography of those small island glaciers could provide crucial information regarding the history and development of the glaciers of Graham Coast and all of the west coast of the AP in general.
The beginning of glaciological studies of the ice caps on the Argentine Islands dates back to 1934, when Fleming and his colleagues conducted some early observations of the Argentine Islands ice caps in the course of Graham Coast outlet glaciers studies (Fleming et al. Reference Fleming, Stephenson, Roberts and Bertram1938). The focus of these studies was mainly on ice surface topography. In the following years, attempts were also made to explain the historical origins of these ice caps (Fleming Reference Fleming1940). More detailed studies followed in the 1960s, when detailed observations of snow thickness and density, air and snow temperature and ice movement were carried out all year (Thomas Reference Thomas1963, Sadler Reference Sadler1968). However, it must be recognized that, understandably, detailed measurements were mostly done on the ice cap that is situated on Galindez Island, meaning that the rest of the ice caps on other islands underwent sporadic if any observation (Sadler Reference Sadler1968). In the timespan between the 1970s and 1990s, no published work related to the study of these ice caps can be found.
After 1996, when the former British Faraday station (now called Akademik Vernadsky) was transferred to Ukraine, some new methods were used to study the ice caps of the Argentine Islands. Ground-penetrating radar and vertical electrical resonance sounding methods were used to measure the thickness of the Galindez Island ice cap (Levashov et al. Reference Levashov, Yakymchuk, Usenko, Korchagin, Solovyov and Pishchany2004, Bakhmutov et al. Reference Bakhmutov, Vaschenko, Grischenko, Korchagin, Levashov and Pishchany2006), and monitoring of the frontal parts of the ice caps on Galindez and Winter islands was started in 2002 using the photogrammetric method (Hlotov et al. Reference Hlotov, Kovalenok, Milinevskyy, Nakalov and Fulitka2003, Cisak et al. Reference Cisak, Milinevsky, Danylevsky, Glotov, Chizhevsky, Kovalenok, Capra and Dietrich2008, Tretyak et al. Reference Tretyak, Hlotov, Holubinka and Marusazh2016). Phototheodolite measurements were taken on Galindez Island (Hlotov et al. Reference Hlotov, Kovalenok, Milinevskyy, Nakalov and Fulitka2003), and terrestrial laser scanning was used for the first time for observation of the termination line of the ice caps on Galindez and Winter islands in 2014 (Tretyak et al. Reference Tretyak, Hlotov, Holubinka and Marusazh2016). The GPR survey of the internal structure of the ice caps on Galindez, Winter and Skua islands was started in April 2017 (Chernov Reference Chernov2017, Chernov et al. Reference Chernov, Karušs, Lamsters, Krievāns and Otruba2018), and interior anomalies, which are correlated with moisture content and crevasse development, were identified.
Despite the fact that some glaciological studies had already been started on the Argentine Islands by the 1930s, no detailed volume calculations and ice thickness measurements have been conducted on the ice caps of the Argentine Islands up to now. In this study, we provide high-resolution models of the ice thickness and subglacial topography constructed from detailed GPR measurements, as well as volume estimates of the ice caps of the Argentine Islands.
Site description
The Argentine Islands lie between latitude 65°12’S and 65°16’S and longitude 64°11’W and 64°21’W ~8 km from the Graham Land coast. There are at least 11 large islands that support permanent ice cover and many more small islands in the group. Thomas (Reference Thomas1963) described islands as roche moutonnées with their stoss ends pointing north. Our obtained digital surface models (DSMs), however, reveal their complex morphology. Taking into account possible ice flow direction and morphometric variations of the Argentine Islands, it seems that their primary shape is mostly determined by their geological structure, and they cannot be considered a single roche moutonnée or whaleback.
Investigations of sea bathymetry have revealed that the Palmer Deep ice stream (Davies et al. Reference Davies, Hambrey, Smellie, Carrivick and Glasser2012), which operated during the last glaciation, also acted across the Argentine Islands, where it has flowed approximately to the NNW and more to the NW in the Bismarck Strait. This ice stream, which was 230 km long and 60 km wide, created remarkably streamlined subglacial bedform assemblages, including drumlins and mega-scale glacial lineaments on the seabed (Davies et al. Reference Davies, Hambrey, Smellie, Carrivick and Glasser2012), and it sculpted the rocks of the Argentine Islands (Fig. 2).
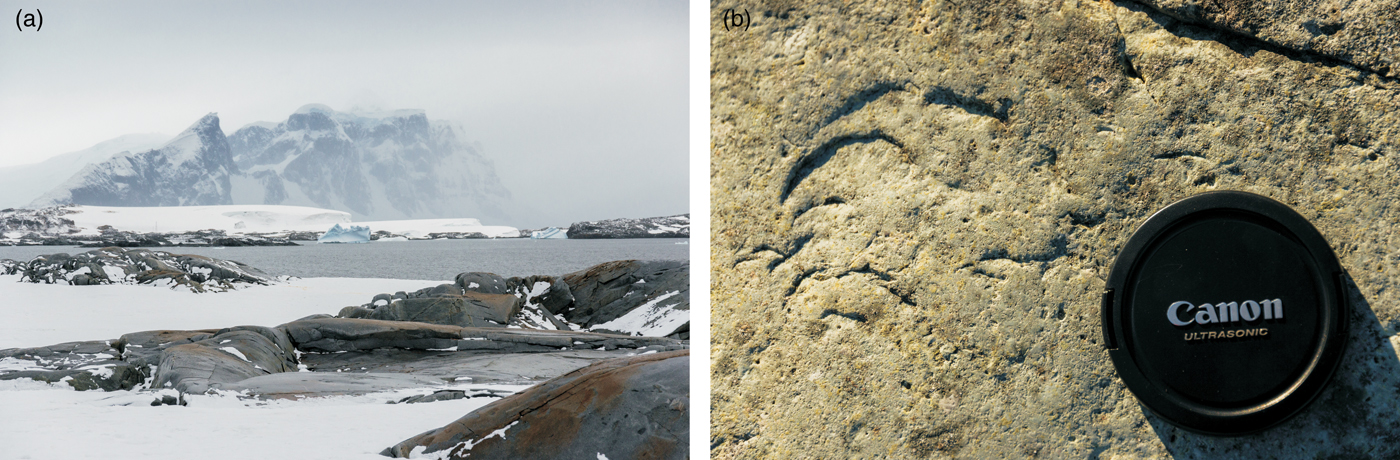
Fig. 2. The features of the Argentine Islands suggesting active palaeo-ice streaming. a. A view towards the Antarctic Peninsula from the Barchans. b. Chatter marks on the rocks of Skua Island, constituting evidence of glacial plucking.
The central and eastern parts of the Argentine Islands are composed of volcanic rocks of the AP Volcanic Group, while the western islands are formed of plutonic rocks of the AP batholith. The oldest rocks are mainly andesite lavas and pyroclastic members of the Upper Jurassic Volcanic Group that have been intruded by pre-Andean dykes and sills. They are exposed on the Galindez, Skua, Winter, Corner, Irizar and Uruguay islands. The plutonic rocks of the AP batholith (Andean Intrusive Suite) with an Early Cretaceous peak of activity (Leat et al. Reference Leat, Scarrow and Millar1995) have metamorphosed and metasomatized the volcanic and hypabyssal rocks. During the later dyke phase, which cuts both the volcanic and plutonic rocks, veins and dykes were represented mainly by andesites, diabases and basalts. Finally, there are a few late, comparatively unaltered Tertiary dykes (Elliot Reference Elliot1964). The plutonic rocks of gabbro–granite composition (with a prevalence of diorites) are exposed on the Barchans. The radiometric age of this rock is 55–70 Ma. More information about the geology and radiometric dating is presented in Bakhmutov & Shpyra (Reference Bakhmutov and Shpyra2011).
Regarding glaciation history, the newest reconstructions show that the largest islands of the west coast of the AP remained covered by ice during the deglaciation of the AP ice sheet (Ó Cofaigh et al. Reference Ó Cofaigh, Davies, Livingstone, Smith, Johnson and Hocking2014), but the precise history of the island glaciers is unknown. It is possible that the ice caps on the Argentine Islands and surrounding islands near the western AP at least decreased in size during the mid-Holocene warm period. The question of whether these small ice caps retreated completely still remains unanswered, but we know that many glaciers rapidly retreated at the AP during the mid-Holocene climatic optimum c. 4000–3000 ka bp (Ingólfsson et al. Reference Ingólfsson, Hjort, Berkman, Björck, Colhoun and Goodwin1998).
The majority of the ice caps on the Argentine Islands are located on the lee of the exposed rocks, which are usually found on the northern sides of the islands. The shape of the ice caps is governed by preferential ablation on the northern side, rock shape and wind direction (Fleming Reference Fleming1940, Thomas Reference Thomas1963). As a result, ice cover forms large drift structures with the axis of symmetry in the direction of the prevailing winds from the north (Turner et al. Reference Turner, Chenoli, Marshall, Phillips and Orr2009, Tymofeyev et al. Reference Tymofeyev, Beznoshchehenko and Shcheglov2017). Areas where there is no snow cover are marked by features of glacial erosion (Fig. 2).
The AP and especially its western coast experienced major warming over the last 50 years of the twentieth century (Turner et al. Reference Turner, Colwell, Marshall, Lachlan-Cope, Carelton and Jones2005, Steig et al. Reference Steig, Schneider, Rutherford, Mann, Comiso and Shindell2009). Air temperatures have increased on both sides of the AP. It is evident from station records that the AP has warmed by 3.7 ± 1.6°C during the twentieth century (Vaughan et al. Reference Vaughan, Marshall, Connolley, Parkinson, Mulvaney and Hodgson2003). The largest increases in surface air temperature at the beginning of the twenty-first century have been recorded at Vernadsky and Rothera stations (Tymofeyev Reference Tymofeyev2014). An annual mean surface temperature increase of 2.5°C since the 1950s is reported (Turner et al. Reference Turner, Colwell, Marshall, Lachlan-Cope, Carelton and Jones2005). Contrary to the aforementioned warming during the twentieth century, a cooling trend is reported for the AP over the last two decades (Turner et al. Reference Turner, Lu, White, King, Phillips and Hosking2016). In the earlier studies, Thomas (Reference Thomas1963) recognized that the surface mass balance varies considerably from year to year because of different summer temperatures. Nevertheless, it is worth mentioning that snow accumulation on the ice caps of the Argentine Islands continues through the warmer summer period (Hlotov et al. Reference Hlotov, Kovalenok, Milinevskyy, Nakalov and Fulitka2003). This was also observed during our fieldwork in February and March 2018. Nevertheless, during expeditions in the 1930s, there were observations that suggested that no snow was left on the ice caps in summer (Fleming Reference Fleming1940).
Previous work
The first theories regarding the origins and possible future development of the ice caps of the Argentine Islands were elaborated by Fleming (Fleming Reference Fleming1940, Fleming et al. Reference Fleming, Stephenson, Roberts and Bertram1938) during his studies of outlet glaciers of the Graham Coast. He theorized that the ice caps on the Argentine Islands had been reduced to their present shape from a previously more extensive ice sheet that had broken up recently.
By the 1960s, the measurements of Thomas (Reference Thomas1963) and Sadler (Reference Sadler1968) showed that the ice caps were not wasting away rapidly, as suggested by Fleming. By comparing highest point measurements on Galindez Island in 1934 (53.9 m) with his own measurements from the summer of 1961 (54.1 m), Thomas (Reference Thomas1963) concluded that in the timespan from 1935 until 1961, the Galindez Island ice cap was in a state of equilibrium. Measurements of the highest point in the summer of 1966 (56 m) further supported this hypothesis (Sadler Reference Sadler1968).
More recent observations demonstrate that the ice caps are indeed shrinking today. Hlotov et al. (Reference Hlotov, Kovalenok, Milinevskyy, Nakalov and Fulitka2003) compared the shape of the Galindez Island ice cap in 2002 with the shape of this ice cap that was reported by Thomas (Reference Thomas1963). It was found that the southern part of the glacier is shrinking at a speed of 3 cm year−1. Hlotov et al. (Reference Hlotov, Kovalenok, Milinevskyy, Nakalov and Fulitka2003) also observed that some parts of the glaciers are experiencing greater losses of ice than others, but they concluded that the ice caps are shrinking in general. This observation was supported by a comparison of British Antarctic Survey aerial photographs and Quick Bird satellite images, suggesting that the main receding area is the western part of the ice cap (Cisak et al. Reference Cisak, Milinevsky, Danylevsky, Glotov, Chizhevsky, Kovalenok, Capra and Dietrich2008).
Cisak et al. (Reference Cisak, Milinevsky, Danylevsky, Glotov, Chizhevsky, Kovalenok, Capra and Dietrich2008) calculated that since 2000 the Galindez Island ice cap has lost 2–3% of its volume in general, which corresponds to 20 000 m3 year−1. Later, based on created digital terrain models, Tretyak et al. (Reference Tretyak, Hlotov, Holubinka and Marusazh2016) estimated that the western part of the Galindez Island ice cap had lost 12 000 m3 year−1 in volume, while the southern part had lost 9150 m3 year−1 in the timespan from 2002 until 2014. Over the same period, the southern part of the ice cap on Winter Island had lost 8800 m3 year−1. This means that the southern and western fronts of the Galindez Island ice cap had retreated from their positions in 2002 by ~10 m over this timespan. The historical retreat of the southern cliff of the Galindez Island ice cap is also evident from historical photographs (Fig. 3). By comparing the surface profiles of the Galindez Island ice cap, it was shown that there has been a reduction in height between the 1961 and 1998 surveys from ~3 m at the southern end of the ice cap to ~1 m closer to the northern part of the ice cap (Cisak et al. Reference Cisak, Milinevsky, Danylevsky, Glotov, Chizhevsky, Kovalenok, Capra and Dietrich2008). Cisak et al. (Reference Cisak, Milinevsky, Danylevsky, Glotov, Chizhevsky, Kovalenok, Capra and Dietrich2008) have also observed that some patches of ice and snow near Vernadsky Station have increased.

Fig. 3. The south-west slope of the Galindez Island ice cap at different periods of time: a. August 1935 (Rymill Reference Rymill1938), published with permission from Royal Geographical Society, b. 1949 (Robert Moss 1949, reproduced courtesy of the British Antarctic Survey Archives Service, archives ref.: AD6/19/2/BM132, www.bas.ac.uk/about/about-bas/history/british-research-stations-and-refuges/faraday-f/2bm132), c. May 1966 (fig. 3 in Sadler Reference Sadler1968), d. March 2018.
Up until now, little attention has been paid to the subglacial topography and volume of the ice caps on the Argentine Islands. Thomas (Reference Thomas1963) suggested that the subglacial surface of Galindez Island gradually decreases from the top of Woozle Hill to the ice cliff in the south. Direct thickness measurements of the Galindez Island ice cap were conducted for the first time in 1998 by the scientists Macheret and Moskalevski from the Russian Academy of Sciences Institute of Geography using GPR (Bakhmutov et al. Reference Bakhmutov, Vaschenko, Grischenko, Korchagin, Levashov and Pishchany2006). It was reported that the maximum thickness of ice reaches 59 m and that some part of the subglacial surface is below sea level. In addition, the existence of a hypothetical subglacial lake below the western part of the ice cap was suggested. Similar results were obtained in the summer of 2004 when vertical electrical resonance sounding was used to determine the thickness of the Galindez Island ice cap (Levashov et al. Reference Levashov, Yakymchuk, Usenko, Korchagin, Solovyov and Pishchany2004). It was concluded that the subglacial surface gradually decreases from the top of Woozle Hill to the ice cliff in the south where the ice thickness reaches 48 m. An impressive step in the subglacial topography (vertical difference of 19 m) in the western part of the ice cap facing south was also identified.
Methods
The expedition to the Argentine Islands was conducted from 18 February to 4 April 2018. During the expedition, the GPR measurements of ice thickness and the aerial survey of small ice caps located on the largest Argentine Islands, comprising Galindez, Winter, Skua, Uruguay, Corner and Irizar islands and the northern and southern Barchans, were performed.
A ground-penetrating radar survey
Ground-penetrating radar (sometimes also called ice-penetrating radar) has been used extensively for the measurement of glacier thickness (Engel et al. Reference Engel, Nývlt and Láska2012, Lamsters et al. Reference Lamsters, Karušs, Rečs and Bērziņš2016). During the expedition, GPR was used to record data regarding the thickness and inner structure of the ice caps. The area of the performed GPR survey covers ~0.81 km2, and in total, > 62 km of GPR profile lines were recorded. As the exposed rock surface on all of the surveyed islands was heavily articulated and we suspected that the subglacial surface would have the same characteristics on all of the islands except Uruguay Island, which has very steep ice slopes, GPR profiles were aligned cross-wise in a dense survey grid. The distance between profile lines was kept at 25 m. Each GPR profile consisted of numerous 50 m long, separately recorded sections, which were merged later during the post-processing of the data.
The ice thickness measurements were performed by two GPR systems: Zond 12-e with 75 MHz antennae and VIY3-300 with 300 MHz antennae. Two GPR systems were used due to the unexpected issues with Zond 12-e that prevented the further use of this GPR. This allowed us to compare the precision of data obtained using two GPR systems, which proved to be very accurate and fully comparable. While working with Zond GPR, a 1200 ns time window was used, as this allows for the detection of reflections of a glacier bed at up to 100 m beneath the ice surface. For VIY GPR, a 330 ns time window was used. The GPR data obtained with Zond GPR were processed and interpreted with Prism 2.6 software. During processing, a time-dependent signal gain function, a background removal filter and an Ormsby bandpass filter with a low-frequency cut-off at 8 MHz and a high-frequency cut-off at 145 MHz were applied. Data obtained with VIY GPR were processed and interpreted with Synchro and Planner software. During the processing of the VIY data wavelet, background removal, bandpass filters and a time-dependent signal gain function were used.
The electromagnetic impulse propagation speed was determined using englacial hyperbolic reflections (Benjumae et al. Reference Benjumae, Macharet, Navarro and Teixidó2003, Bradford & Harper Reference Bradford and Harper2005, Lamsters et al. Reference Lamsters, Karušs, Rečs and Bērziņš2016). As on surveyed ice caps, an englacial drainage system is not developed, so it was difficult to find any hyperbolic reflections within glaciers. Altogether, only eight hyperbolas were inspected. It was calculated that ε = 3.60 ± 0.21 at the 99% confidence level. The calculated value of ε corresponds to the ε value reported for glaciers located on small islands around the AP (2.62–3.65; Benjumae et al. Reference Benjumae, Macharet, Navarro and Teixidó2003, Blindow et al. Reference Blindow, Suckro, Rückamp, Braun, Schindler and Breuer2010).
Usually, the vertical resolution is determined as half of the wavelength of a used antenna (Pellikka & Rees Reference Pellikka and Rees2010). For Zond GPR, this corresponds to ~1.31 m, but for VIY GPR, this corresponds to 0.27 m. As we are combining datasets obtained with both GPRs into single dataset, we accept the lowest resolution as the resolution of the dataset: 1.31 m. The lateral resolution is commonly approximated by the radius of the first Fresnel zone (Pellikka & Rees Reference Pellikka and Rees2010), which, in our case, corresponds to the area at the ice/bed interface from which the signal is reflected. For our dataset, the radius of the first Fresnel zone conforms to 1.32 m at places where the ice thickness is ~1 m, and it is up to 6.32 m in places where the ice thickness reaches 30 m.
During data interpretation, the two-way travel time for the basal reflection was determined along with each GPR profile. The distance between individual data points for ice thickness values is up to 10 m depending on the complexity of the subglacial topography. Using the determined time values and calculated GPR signal propagation speeds, the ice thickness was calculated.
Aerial surveying
A DJI Phantom III Advanced quadcopter was used to obtain aerial images of all of the studied islands. The drone was launched from the highest parts of the islands at 60 m above the surface and the image overlap was set to 85% in the lateral and 77% in the longitudinal directions. Mission planning and execution were done with Pix4Dcapture software. Fourteen ground control points (GCPs) were used on each island on average. Orthomosaics and DSMs were developed in Agisoft Metashape Professional software. The resolution of the DSMs is 13.8 cm px−1 and the resolution of the orthomosaics is 3.4 cm px−1 on average. The root mean square re-projection error of GCPs is 29 cm on average.
We used the Magellan ProMark 3 global navigation satellite system (GNSS) receiver for coordinate and altitude acquisition of drone GCPs and for positioning of the start and end points of each GPR profile section. The measurement system consisted of two GNSS receivers: one base station and one rover. The base station location were always < 1 km away from the survey territory and the log file was continuously recorded for 3–10 hours per day. The rover was used in the fix-and-hold mode and the acquisition time of the coordinates varied from 30 s to 1 min. The GNSS update ratio was 1 Hz, which resulted in 30–60 measurements per point.
The post-processing of the GNSS data was done in GNSS Solutions software. The location of the base station was corrected with GNSS signal corrections from Palmer GNSS station, which is located ~53 km away from the survey territory. The deviation of base station coordinates in all cases was ~4 cm. Since many GNSS hardware manufacturers specify that a longer baseline accumulates greater error, one can add an additional 1 mm km−1 to the accuracy of the base station coordinates (https://geodesy.noaa.gov/PUBS_LIB/UserGuidelinesForSingle BaseRealTimeGNSSPositioningv.3.1APR2014-1.pdf), which results in ~9.3 cm average base station position accuracy.
The rover raw log files were processed against the base station signal corrections. The GNSS precision of GCPs was 8 cm on average, with a horizontal confidence of 11 cm and a vertical confidence of 16 cm. The average rover measurement deviation for the start and end points of the GPR profile sections was ~7 cm in the horizontal and ~11 cm in the vertical planes. There were few points with significantly larger deviation (> 1 m), and in total, 95% of all measurements had deviations of < 20 cm. The start and end points of the GPR profile sections were connected with a straight line in QGIS software. The obtained profile lines were divided into a number of points according to the GPR trace count. Then, coordinates were assigned to each GPR trace and the data were imported into GPR data-processing software for interpretation.
Construction of ice thickness and subglacial topography models
The subglacial topography models were created using kriging (ordinary) interpolation in ESRI ArcMap 10.6.1 software. For the points with measured ice thickness, the value of the surface elevation was automatically determined from the created DSMs. Then, the measured ice thickness was subtracted from the surface elevation. The masks of glacier outlines were used for the interpolation. The outlines of glaciers were manually digitized from the orthomosaics, considering a glacier as an area covered by permanent ice/snow. Separate snow patches were not considered as parts of a glacier. A few areas, including the ice on the northern part of Galindez Island (almost separated from the main ice cap by a hill) and a few weakly connected areas on Corner Island, were excluded from the interpolation because of the lack of ice thickness measurements and the erroneous interpolation due to this. The outlines of glaciers were converted into points and included in the interpolation. Firstly, a value of 0 was set for these ice thickness points, but due to the very small and unrealistic interpolated value, we instead used a value of 0.3 m. The outlines of individual rocks inside glaciers were also manually digitized. The outlines were converted into points and an ice thickness value of 0 was applied. In such a way, a more realistic interpolation was performed regarding these rocks. Finally, the rocks were clipped out from the final models.
For the construction of the ice thickness models, we subtracted the interpolated subglacial topography models from the DSMs. In such a way, more accurate ice thickness models were obtained near ice cliffs than using interpolation from points with measured ice thicknesses. However, for Corner and Irizar islands, where the ice thickness was < 10 m, the direct interpolation from ice thickness points gave better results. All of the models were created to 1 m cell size. To evaluate the optimal spacing between GPR profile lines in the future, we constructed subglacial topography models for Winter Island and the northern Barchan using GPR profile lines oriented in two perpendicular directions separately. Then, the difference maps of both models and root mean square error (RMSE) values were calculated. The volume of the ice caps was calculated from the ice thickness models using the ArcMap ‘Surface Volume’ tool.
Results
Subglacial topography
The reflections from the subglacial surface in all of the obtained GPR profiles with 75 MHz antennae are strong and easily identifiable (Fig. 4a & b) because the maximum thickness of the studied ice caps does not exceed 36 m (Table I). In the thickest parts of the ice caps, there were some difficulties in identifying the reflection from the subglacial surface in profiles that were obtained with 300 MHz antennae, but these reflections were easy distinguishable up to a depth of ~20 m (Fig. 4c). Almost all of the profiles suggest that the subglacial topography of the Argentine Islands is not flat, but quite articulated. The most rugged subglacial topography was observed on the northern Barchan, where a number of small humps (~10 m wide and up to 2 m high) are present (Fig. 5). Separate higher humps are present on both of the Barchans (~35 m wide and up to 3 m high; Fig. 5). Similar wider humps are also found on Winter Island, where they reach a width of 50 m and a height of 3.5 m (Fig. 5). Skua Island has the smoothest subglacial surface, with only three larger humps. Their diameter is ~130 m and their height reaches 10 m. One of those humps is fully covered with ice (Fig. 5).

Fig. 4. Examples of obtained ground-penetrating radar profiles a. on Galindez Island, b. on the northern Barchan island and c. on Irizar Island. For the locations of the profiles, see Fig. 5. Arrows indicate reflections from the subglacial surface.
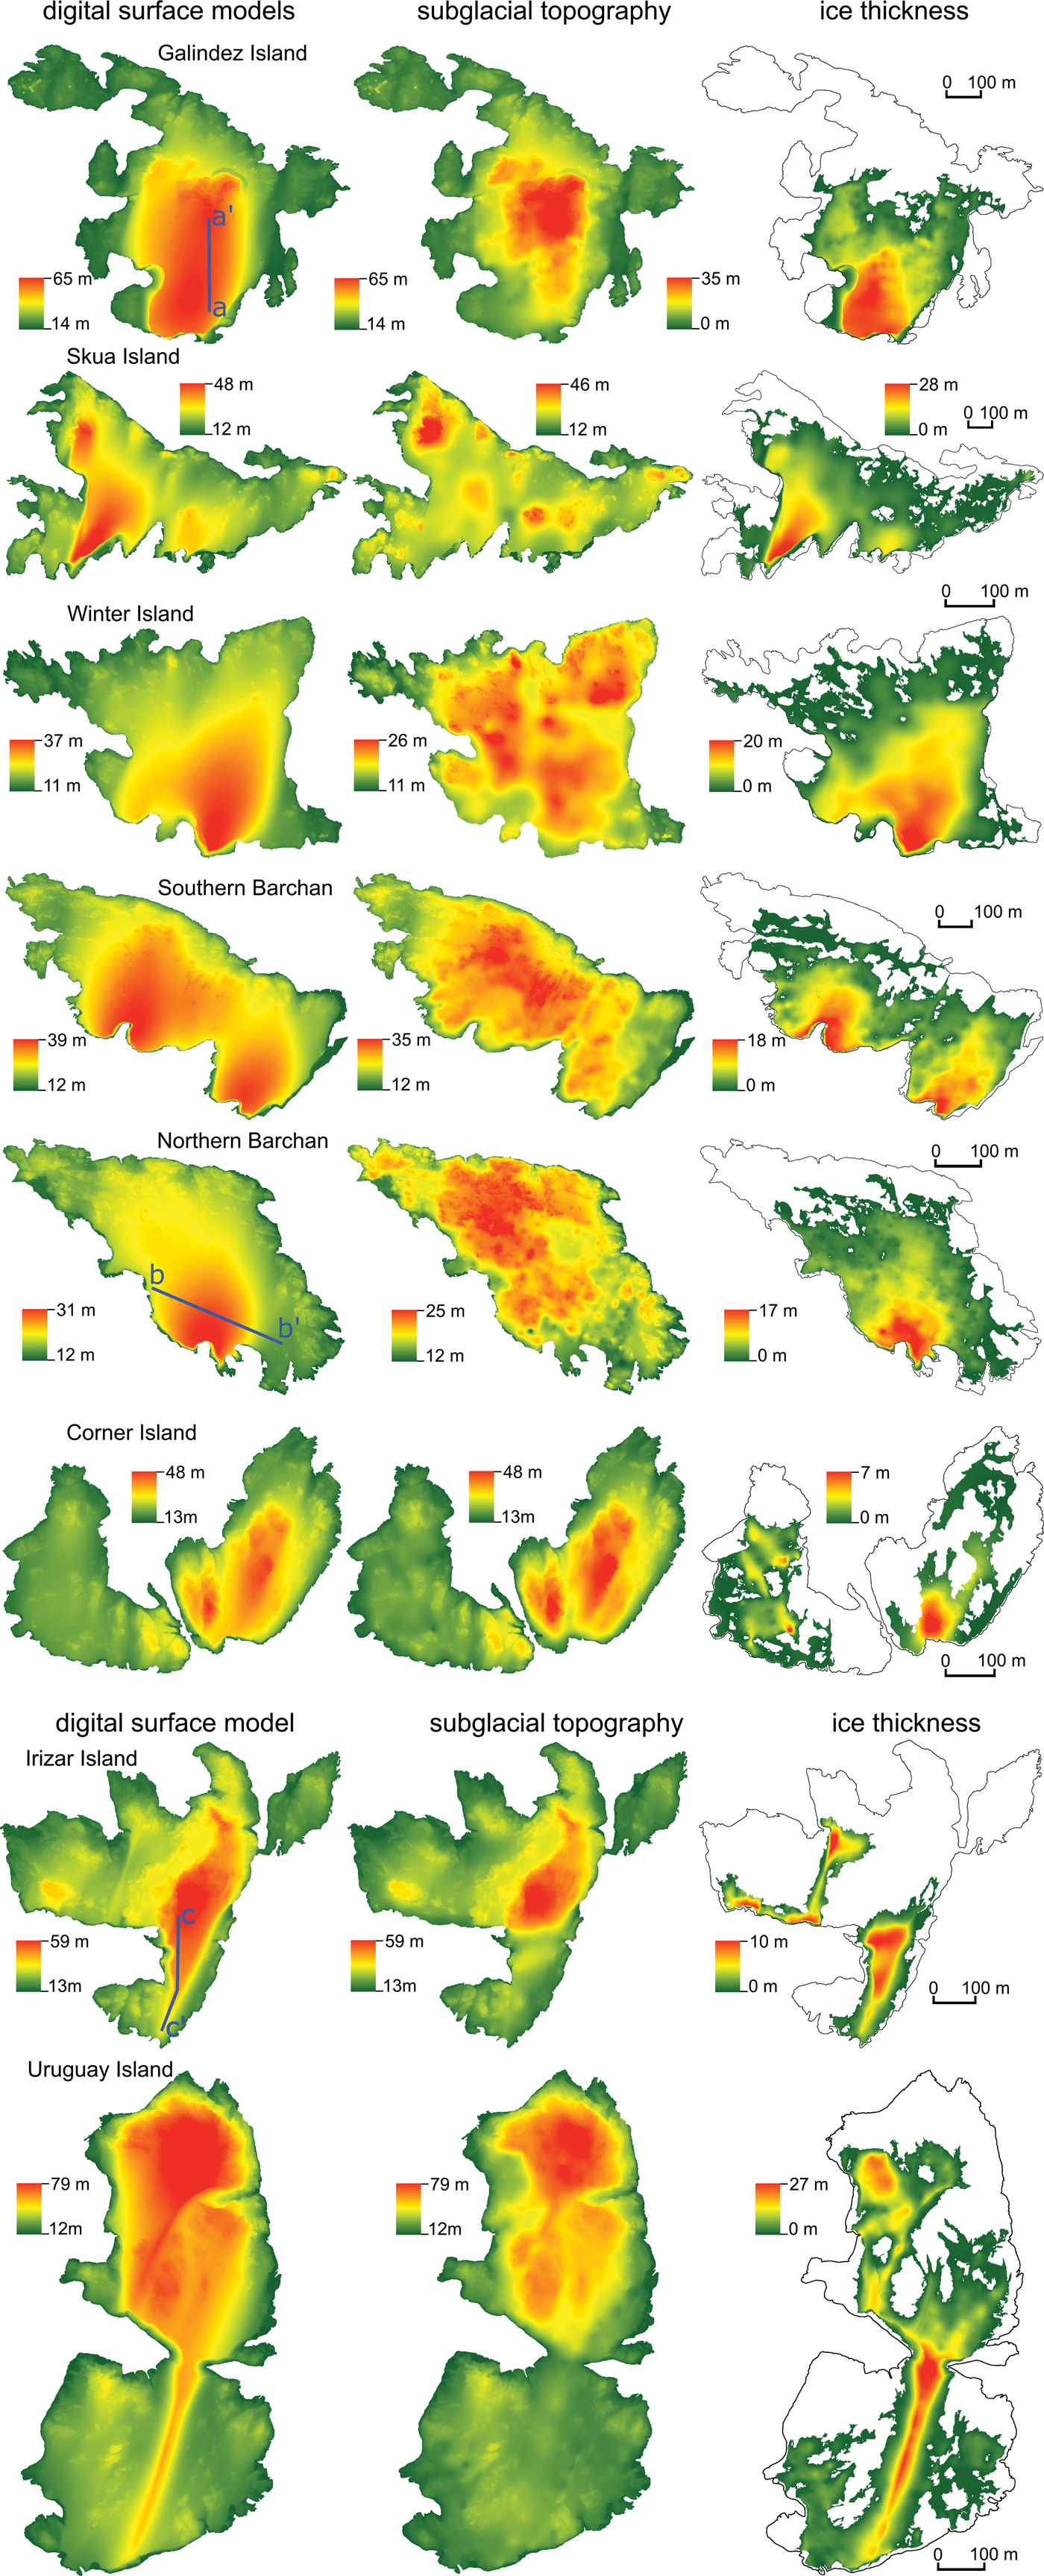
Fig. 5. Digital surface, subglacial topography and ice thickness models of the largest Argentine Islands.
Table I. Characteristics of the surveyed ice caps.

On Uruguay and Irizar islands, one distinct rock hill is located in the northern part of the island, while some individual humps of ~50 m in width and 3 m in height are present in the southern parts of the islands (Fig. 5). From the examination of the profiles obtained on Uruguay Island, it was found that the very narrow, elongated ice ridge is not supported by any topographic uplift in the subglacial topography (Fig. 5). This is also true of the largest ice ridge on the southern part of Irizar Island.
On Galindez Island, a distinct rock hill, which is called Woozle Hill, is located in the central part of the island (Fig. 5). Woozle hill is quite symmetrical in the west to east direction, but it is elongated and gradually decreasing in the north to south direction. All of its slopes, excluding the southern slope, which is currently covered by ice, are quite steep.
It is evident that the subglacial topography of the Barchans is more rugged than on other islands (Fig. 5). Previous geological studies (Elliot Reference Elliot1964, Leat et al. Reference Leat, Scarrow and Millar1995, Bakmutov & Shypra Reference Bakhmutov and Shpyra2011) have shown that there are also distinct differences between the compositions of the magmatic rocks of the Argentine Islands. Exposed rocks of the Barchans are composed of granodiorite of an Andean intrusive suit (radiometric age: 55–70 Ma). The others of the surveyed Argentine Islands are composed of much older, heavily jointed Upper Jurassic volcanic rocks (dacite breccia and porphyritic andesite; Elliot Reference Elliot1964). Such distinct differences of subglacial topography between two of the Barchans and the rest of the surveyed islands most probably are related to the differences in the compositions of the magmatic rocks of the islands. It is also plausible that the orientations of the hills and humps on these mainly volcanic islands are related to their geological structure. The erosion of palaeo-ice stream seams has attributed to the local smoothing of rocks, as is evident, for example, at the shores of the Barchans (Fig. 2a).
Glacier thickness and distribution
The ice caps of the Argentine Islands are quite small in general. They cover ~50% of the land surface of the islands on average. Exceptions are Irizar Island, where ice covers only ~23% of the island surface, and Winter Island, where ice covers 72% of the surface. Individual snow/ice patches, which are separated from the main ice caps, are found on all of the islands, but they are in the minority and change their shape from year to year. It is also true that almost half of the land area became ice free during the warmer summer months.
The maximum thickness of only two islands (Galindez and Skua) exceeds 30 m, while the average thickness of all of the islands is only 5 m, as determined from created ice thickness models (Table I). Galindez Island is an exception, where the average ice thickness reaches 11.6 m, while the average ice thickness on both Corner islands is only 1 m. Discounting the ice thickness on Galindez Island, the average ice thickness for all of the other islands varies from 1 to 7 m. Despite such a low average ice thickness, the maximum thickness is over 20 m on Galindez, Skua, Uruguay and Irizar islands, reaching a maximum on Galindez Island at 35.3 m.
The thickest and also the largest (by volume) ice caps are observed on Galindez, Uruguay and Skua islands (Fig. 5). Areas with the greatest ice thickness are located in the wind shadow of the largest hills if there is land to the south of the hill. It is known that dominant winds in the Argentine Islands are from north and south, although north winds are more associated with strong wind events that occur mainly in winters (Turner et al. Reference Turner, Chenoli, Marshall, Phillips and Orr2009, Tymofeyev et al. Reference Tymofeyev, Beznoshchehenko and Shcheglov2017). Prominent and very narrow ice ridges have developed in the wind shadows of the largest hills on Uruguay and Irizar islands, and these are not related to any subglacial features (Fig. 5). Ice caps on Galindez, Corner and Skua islands seem also to have developed as ice shadow features (Fig. 5). The ice caps on Winter Island and the Barchans are not related to prominent bedrock features, but as the highest parts of the ice caps are located in the southern parts of the islands, we relate their location to the activity of north winds as well (Fig. 5).
Discussion
In our opinion, one of the biggest uncertainties regarding ice thickness determination is related to the precision with that the electromagnetic impulse propagation speed is determined. In this study, the electromagnetic impulse propagation speed was determined using englacial hyperbolic reflections. This method is frequently applied in glacier studies (Benjumae et al. Reference Benjumae, Macharet, Navarro and Teixidó2003, Bradford & Harper Reference Bradford and Harper2005) and can be regarded as precise if there are plenty of such reflections. As the englacial drainage system of the surveyed ice caps is poorly developed, we managed to identify only eight englacial hyperbolic reflections. For future studies of such small ice caps around the AP, we advise using the common mid-point method or direct comparison of obtained GPR data with ice thickness measurements from drillings for determination of the electromagnetic impulse propagation speed.
The distance between GPR profile lines during data acquisition was kept at 25 m, and GPR profiles were aligned cross-wise to achieve the best possible resolution of the subglacial topography, which was expected to have numerous local undulations. To evaluate the optimal spacing between GPR profile lines in the future on similar islands, we constructed two subglacial topography models for Winter Island and the northern Barchan using two different sets of GPR profile lines: one contained profiles that were oriented in a north to south direction, while the other contained profiles that were oriented in a west to east direction. It is also worth noting that on Winter Island west to east profiles were recorded by VIY3-300 GPR with 300 MHz antennae, and these ice thickness measurements conform very well to the results from the north to south profiles obtained by Zond 12-e with 75 MHz antennae. The RMSE between the models of the subglacial topography on Winter Island made from ice thickness points obtained from GPR profile lines oriented in two perpendicular directions is only 44 cm. The differences between the models created from all of the points and the models created using only points aligned in one direction are even less, at 28 and 20 cm. For the northern Barchan, on which GPR datasets were gathered by only one GPR (Zond 12-e), the RMSE is greater, but still quite small. The RMSE between the models created from profiles oriented in perpendicular directions is 72 cm. This means that the main source of errors is not differences in GPRs or antennae, but the articulation of the subglacial topography itself. In addition, we found that the surface and subglacial surface undulations on the northern Barchan are the most pronounced. Furthermore, the greatest differences are located in very local areas, usually where the GPR profile line in one or another direction is missing.
Comparing the models of the subglacial topography on both Winter Island and the northern Barchan constructed from profiles oriented in north to south and west to east directions, we conclude that a cross-wise grid allows for the detection of only very local undulations on the glacier bed. For future studies, it is suggested to record GPR data across the entire possible glacier area rather than to concentrate efforts in a crosswise manner for data recording. Both GPRs with different antennae were sufficient for the ice thickness determination of up to 20 m. When ice thickness exceeded 20 m, it was difficult to follow reflections from the subglacial surface recorded with 300 MHz antennae.
The general trends and the orientation of the main elements of the subglacial topography of the Argentine Islands usually correspond quite well with their expression on the general surface topography, although a few local discrepancies are found. For example, the elongated ridges on the southern parts of the Uruguay and Irizar islands are purely ice ridges and are not supported by any subglacial features (Fig. 5).
The subglacial topography of the historically most studied ice cap on Galindez Island decreases gradually from ~60 m in the north to ~20 m in the south, but the maximum ice thickness is considerably less than previously thought. We measured the ice thickness with two completely different GPRs and all of the measurements fit very well on Galindez and other islands. In addition, recent ice drillings on Galindez Island further confirm our measurements (D. Pishniak, personal communication 2019). This suggests that previous ice thickness measurements on Galindez Island by Macheret and Moskalevski in 1998 (Bakhmutov et al. Reference Bakhmutov, Vaschenko, Grischenko, Korchagin, Levashov and Pishchany2006) were overestimates: 59.0 m (previous study) vs 35.3 m (this study). The results obtained by vertical electrical resonance sounding in 2004 were more realistic because it was determined that the maximum thickness of the Galindez Island ice cap reaches 48 m (Levashov et al. Reference Levashov, Yakymchuk, Usenko, Korchagin, Solovyov and Pishchany2004). Our results do not support an impressive step in subglacial topography with a vertical difference of 19 m. Only some local steps facing south with amplitudes of only a few metres are identifiable. The differences between our data and the data obtained by Levashov et al. (Reference Levashov, Yakymchuk, Usenko, Korchagin, Solovyov and Pishchany2004) probably arise because of differences in applied methods of glacier thickness determination. Our results also do not support the hypothesis of a subglacial lake beneath the Galindez Island ice cap, as previously suggested by Bakhmutov et al. (Reference Bakhmutov, Vaschenko, Grischenko, Korchagin, Levashov and Pishchany2006), as none of obtained GPR profiles shows any signs of a water body beneath or in the ice on Galindez Island.
Conclusions
In this study, we used GPR to measure the ice thickness of the largest ice caps on the Argentine Islands and constructed the first ice thickness and subglacial topography models comprising Galindez, Winter, Skua, Corner, Uruguay, Irizar islands and the northern and southern Barchans.
The ice caps of the Argentine Islands cover ~50% of the land surface of the islands on average. The maximum thicknesses of only two islands (Galindez and Skua) exceed 30 m, while the average thickness of all of the islands is ~5 m. The maximum ice thickness was recorded on Galindez Island at 35.3 m.
The ice thickness distribution is mainly governed by prevailing wind direction. Areas with the greatest ice thickness are located in the wind shadows of the largest hills if there is land to the south of a hill. The prominent narrow ice ridges on Uruguay and Irizar islands are not supported by topographic uplift in the subglacial topography, thus being features maintained mainly by the wind shadow effect.
Almost all of the GPR profiles suggest that the subglacial topography of the Argentine Islands is not flat but quite articulated, and it is mainly governed by the geological structure and composition of the magmatic rocks of the islands. The erosion of palaeo-ice streams seems to have only contributed to the local smoothing of rocks. The most rugged subglacial topography was observed on the northern Barchan, where a number of small humps (~10 m wide and up to 2 m high) are present.
Our GPR data recording pattern of profiles aligned in a crosswise survey grid with 25 m between profile lines allowed for the creation of models of the subglacial topography with very high accuracy. However, for future investigations, we recommend using a one-way grid with a distance between profile lines of 25–50 m depending on the expected subglacial topography and research goal. This must be optimal for high-resolution GPR data acquisition on small glaciers.
Acknowledgements
This work was supported by the performance-based funding of the University of Latvia within the ‘Climate change and sustainable use of natural resources’ and by the specific support objective activity 1.1.1.2. ‘Post-doctoral Research Aid’ (Project ID 1.1.1.2/16/I/001) of the Republic of Latvia, funded by the European Regional Development Fund, Kristaps Lamsters Research Project No. 1.1.1.2/VIAA/1/16/118. The expedition to Antarctica was also partially financed by a donation from Mikrotik (administered by the University of Latvia Foundation) and the company Ceļu būvniecības sabiedrība ‘Igate’ Ltd. We thank the National Antarctic Scientific Centre (NASC) of Ukraine and the crew of the 22nd Ukrainian Antarctic Expedition at Akademik Vernadsky Station for all of their help during our stay and fieldwork in Antarctica, as well as the reviewers who helped to improve the manuscript. We are grateful to the reviewers for their very constructive and useful comments on the manuscript.
Author contributions
Jānis Karušs, Anatolii Chernov, Kristaps Lamsters and Māris Krievāns gathered GPR and GNSS data in the field. Jānis Karušs and Anatolii Chernov processed and interpreted the GPR data. Kristaps Lamsters created the subglacial topography and ice thickness models. Māris Krievāns planned and executed the aerial mapping of the area with unmanned aerial vehicle. Jurijs Ješkins processed the obtained GNSS data and constructed DSMs of the islands. All of the authors prepared corresponding parts of the manuscript and edited the whole manuscript.


