Introduction
Plankton communities in surface waters of the Southern Ocean are usually characterized by lower 13C/12C isotope ratios compared with those found at the equator, which correspond to a decrease of δ13CPOC values from -19 to -22‰ at low latitudes down to -31‰ at high latitudes (Wada et al. Reference Wada, Terazaki, Kabaya and Nemoto1987, Rau et al. Reference Rau, Takahashi and Marais1989, Reference Rau, Sullivan and Gordon1991, Dehairs et al. Reference Dehairs, Kopczynska, Nielsen, Lancelot, Bakker, Koeve and Goeyens1997). In early studies, this important isotopic trend was ascribed to the effect of temperature decrease on cell metabolism (Sackett et al. Reference Sackett, Eckelmann, Bender and Bé1965, Degens et al. Reference Degens, Guillard, Sackett and Hellebust1968). However, ensuing investigations have shown that isotope fractionation of carbon by plankton is affected by a combination of several factors related to ambient conditions and physiological processes. These include the changes of CO2 concentration in surface waters, species diversity, light intensity and nutrient availability (Rau et al. Reference Rau, Takahashi and Marais1989, Reference Rau, Sullivan and Gordon1991, Dehairs et al. Reference Dehairs, Kopczynska, Nielsen, Lancelot, Bakker, Koeve and Goeyens1997), differences in metabolic carbon pathways and in cross-membrane transport, which regulates the intracellular CO2 content (Descolas-Gros & Fontugne Reference Descolas-Gros and Fontugne1990, Goericke et al. Reference Goericke, Montoya and Fry1994, Dehairs et al. Reference Dehairs, Kopczynska, Nielsen, Lancelot, Bakker, Koeve and Goeyens1997), as well as the utilization of dissolved organic carbon (DOC) instead of CO2aq as a source of carbon by mixotrophs and heterotrophs (Bentaleb et al. Reference Bentaleb, Fontugne, Descolas-Gros, Girardin, Mariotti, Pierre, Brunet and Poisson1998). For these reasons, an accurate understanding and modelling of the processes that drive isotope fractionation of carbon in the modern ocean is of basic importance for the utilization of 13C/12C isotope ratios in sedimentary organic matter as a proxy for the reconstruction of CO2 content in ancient surface waters and atmosphere (Gibson et al. Reference Gibson, Trull, Nichols, Summons and McMinn1999).
The 15N/14N isotope ratio of PON may also be viewed as a proxy for the extent of nitrate utilization in the upper mixed layer, and for the efficiency of export production that is used, in particular for the Southern Ocean, to link the changes in 15N isotope composition of sedimentary organic matter with those in the concentrations of atmospheric CO2 during glacial/interglacial ages (Altabet & Francois Reference Altabet and Francois2001, Robinson & Sigman Reference Robinson and Sigman2008). In the Antarctic Polar Front Zone, winter maxima of nitrate concentration in surface waters (≈ 30 μM N) are related to values of δ15NNO3 (≈ 5.5‰) close to those typical of deeper waters. However, because of the preferential incorporation of 14N into phytoplankton cells, the uptake of nitrate in partially isolated mixed layers causes its isotopic enrichment during summer (δ15NNO3 ≤ 9‰ for (NO3) ≥ 15 μM N). This process induces a subsequent increase of 15N in newly formed PON, which may be further exacerbated by the degradation of particulates during sinking or by its reworking after the transfer to higher trophic levels (δ15NPON ≤ 5‰; Wada et al. Reference Wada, Terazaki, Kabaya and Nemoto1987, Rau et al. Reference Rau, Sullivan and Gordon1991, Altabet & Francois Reference Altabet and Francois2001).
In spite of the critical role played by the Southern Ocean in global oscillations of atmospheric CO2, to date present and past contributions of ice algae have not been exhaustively included in isotopic modelling of POM in this region (Gibson et al. Reference Gibson, Trull, Nichols, Summons and McMinn1999, Altabet & Francois Reference Altabet and Francois2001, Thomas et al. Reference Thomas, Kennedy, Kattner, Gerdes, Gough and Dieckmann2001, Robinson & Sigman Reference Robinson and Sigman2008). The growth of ice biomass usually occurs in closed or semi-closed habitats (i.e. surface ponds, gap waters, brine channels, bottom ice and unconsolidated platelet layers), where primary production may cause a strong decrease of the concentrations of CO2aq and inorganic nutrients, the increase of pH, and the super saturation of dissolved oxygen. As a result of these conditions, δ13CPOC values obtained from ice cores (-24 to -8‰) are often less negative than those found in the Antarctic pelagic environment (-32 to -20‰; Fischer Reference Fischer1991, Kopczynska et al. Reference Kopczynska, Goeyens, Semeneh and Dehairs1995, McMinn et al. Reference McMinn, Skerratt, Trull, Ashworth and Lizotte1999, Kennedy et al. Reference Kennedy, Thomas, Kattner, Haas and Dieckmann2002, Arrigo et al. Reference Arrigo, Robinson, Dunbar, Leventer and Lizotte2003, Papadimitriou et al. Reference Papadimitriou, Thomas, Kennedy, Haas, Kuosa, Krell and Dieckmann2007). Abiotic processes that take place during sea ice formation, like carbonate precipitation and CO2 degassing, are supposed to be further factors contributing to the reduction of available CO2aq in brine channels, although they do not seem to be predominant with respect to the assimilation by biota (Papadimitriou et al. Reference Papadimitriou, Kennedy, Kattner, Dieckmann and Thomas2003). Moreover, physiological adaptations of ice algae to the extreme ambient conditions met in their habitats may also increase δ13CPOC values because of the direct uptake of bicarbonate (δ13CDIC from 0–2‰), and of the potential utilization of carbon-fixing enzymes with a reduced capacity of isotopic fractionation compared with those used by pelagic species (Goericke et al. Reference Goericke, Montoya and Fry1994).
As regards nitrogen, little information on the variability of 15N/14N isotope ratios of PON and on the processes that modulate nitrogen fractionation is available for sympagic communities. High δ15NPON values were reported for pack ice and for surface waters surrounding sea ice (10.2 ± 9.4‰), showing an inverse correlation with δ13CPOC values, which was attributed to the growth of algae in closed habitats (Rau et al. Reference Rau, Sullivan and Gordon1991). More recently, the extension of sea ice cover and the presence of polynyas in coastal zones of the Ross Sea were recognized as important factors modulating the supply of ice detritus versus freshly produced biomass to the underlying water column, thus influencing the structure of the marine food web and the 15N signature in benthic invertebrate species (Norkko et al. Reference Norkko, Thrush, Cummings, Gibbs, Andrew, Norkko and Schwarz2007).
On the whole, several processes are recognized to induce isotope fractionation of carbon and nitrogen in ice POM. However, due to the high variability of the ambient conditions and the strong dynamics of production processes and regeneration that take place in ice habitats, their effects remain difficult to quantify. The role of aged detritus versus living POM sinking from sea ice into the water column remains largely uncertain, as well as the understanding of their contribution to large scale isotope composition of particulate matter in the Antarctic seas (Dunbar & Leventer Reference Dunbar and Leventer1992, Kennedy et al. Reference Kennedy, Thomas, Kattner, Haas and Dieckmann2002).
The present study focuses on short term evolution of 13C/12C and 15N/14N isotope ratios of POM in land fast ice, the unconsolidated platelet layer and the underlying water column in the coastal zone of Terra Nova Bay. The sampling was carried out in spring, during a phase of ice retreat, thus permitting the analysis of the transition from an ice-covered area to open coastal waters. The effect of accumulation and regeneration of ice biomass on the stable isotope signature of POM was analysed by comparing isotopic data with those of nutrients and dissolved organic matter (DOM). The link between the dynamics of ice POM and the settling events in the underlying water column provided information on the potential role played by sea ice on isotopic composition of pelagic POM in the coastal waters of the Ross Sea.
Materials and methods
Study site
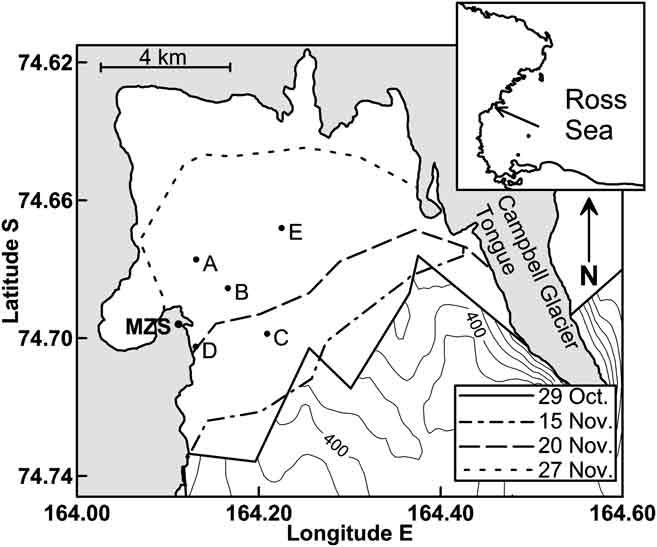
The inner area of the Gerlache Inlet is covered annually by land fast ice, whose extension is limited during winter by the formation of the Terra Nova Bay polynya (Fig. 1). In springtime, the ice system exhibits highly variable physical conditions, evolution of sympagic biomass and timing of breakout, which vary according to previous processes of ice formation and of current meteo-marine conditions at a local scale.

Fig. 1 Sampling sites (A, B, C, D and E) on the annual fast ice (white area) in the Gerlache Inlet. The retreat of sea ice margin from 29 October–27 November 2004 and the position of the Italian Station “Mario Zucchelli” (MZS) are also shown.
The major increase of dissolved inorganic nitrogen (DIN) in fast ice is usually due to spring accumulation of remineralized nitrate in the bottom layer (< 87 μM N). By contrast, nutrient concentration may temporarily decrease in upper horizons of consolidated ice as a consequence of uptake by interior communities. A pronounced increase in the concentration of DOM also occurs in the bottom ice and in the unconsolidated platelet layer (DOC < 1300 μM C, DON < 110 μM N) because of the imbalances between the processes of release and those of remineralization taking place in these semi-closed ice habitats (Cozzi Reference Cozzi2008, Pusceddu et al. Reference Pusceddu, Dell’Anno, Vezzulli, Fabiano, Saggiomo, Cozzi, Catalano and Guglielmo2009).
Algae assemblages dominated by pennate diatoms characterize the bottom ice, whereas cryopelagic species mostly dominate the unconsolidated platelet layer. In these layers, ice biomass during spring reaches concentration up to three orders of magnitude higher than those in seawater beneath sea ice. Temporal changes in the taxonomic composition of the sympagic community may be observed in these ice habitats, with an overall shift from mixed algal assemblages during the pre-bloom phase to diatom-dominated assemblages during the full-bloom phase (Lazzara et al. Reference Lazzara, Nardello, Ermanni, Mangoni and Saggiomo2007).
A high accumulation of particulate biopolymeric carbon, rich in proteins and characterized by a high food quality, is observed along with the highest increases of ice biomass. When ice melts, its release causes high concentrations of particulate organic carbon (POC) and particulate organic nitrogen (PON) in the underlying water column (< 942 μg C l-1, < 174 μg N l-1) and high downward fluxes that may fuel the pelagic and the benthic food webs (Fabiano et al. Reference Fabiano, Chiantore, Povero, Cattaneo-Vietti, Pusceddu, Misic and Albertelli1997, Fabiano & Pusceddu Reference Fabiano and Pusceddu1998, Pusceddu et al. Reference Pusceddu, Cattaneo-Vietti, Albertelli and Fabiano1999, Reference Pusceddu, Dell’Anno, Vezzulli, Fabiano, Saggiomo, Cozzi, Catalano and Guglielmo2009).
Field activity and sampling strategy
In November 2004, fifteen ice cores were collected at five sampling sites (A, B, C, D and E) on the annual fast ice in the Gerlache Inlet (74°41′S 164°10′E, water column 200–500 m deep; Fig. 1). Seven ice cores were collected at station A from 3–25 November at intervals of 3–4 days. Four ice cores were collected at station B from 4–24 November, whereas in the stations C, D and E only 2, 1, and 1 ice cores were collected, respectively (Table I).
Table I Dates of sampling and general characteristics of ice cores collected in the Gerlache Inlet (BI = bottom ice, UPI = unconsolidated platelet ice, IW = interstitial water).

*unconsolidated grains of ice not in form of platelets.
Ice cores were drilled using an aluminium corer (internal diameter 10 cm) and they were immediately sliced, in dim light conditions to avoid plankton photodamage, into sections of 10 or 20 cm thick. Sections were melted in the dark into 1 litre acid-washed bottles using a thermostatic bath (2°C, 4–6 h), and subsampled for the determinations of salinity, DIN and DOM. On the basis of vertical profiles of nutrients in sea ice, three horizons were chosen for the determination of particulate organic matter (POM) and its stable isotope composition: bottom ice (BI; 0–10 cm in height), one interior ice layer (50–70 cm in height) and top ice (170–190 cm in height for station A, 90–110 cm for stations B, C, D, E). Samples for isotopic analysis of POM in fast ice were obtained by collecting replicates of ice cores used for nutrient analysis, which were afterwards treated using the same methodology.
The unconsolidated platelet ice (UPI) that rose into the holes of ice cores was collected after each drilling, separated from the water by means of a sieve, and stored in 1 litre acid-washed bottles for the nutrient analysis. The inflowing water mixed to ice platelets (hereafter defined as interstitial water; IW) was also collected through these holes, for the determination of nutrients and for isotope analysis on the particulates. The sampling of IW was carried out using a customized 1 litre stainless steel bottle, which was equipped with small inflow and outflow valves to prevent the sampling of ice platelets. Despite the fact that the unconsolidated platelet layer beneath the bottom ice may be disturbed by the drilling of cores, the water collected with this method was considered to be mainly interstitial water when the platelet layer is thick, whereas it was mixed with seawater at the interface with the bottom ice when the unconsolidated layer was thin or absent.
The evolution of the characteristics of seawater column beneath the fast ice was investigated at station A, using CTD downcasts and bottle sampling. From 8–26 November 2004, five vertical profiles of salinity and temperature were acquired at intervals of 4–5 days, using a SBE 19plus SEACAT profiler. Samples for the analysis of nutrients and POM in the water column were collected at a depth of 10, 20 and 50 m using 5 litre Niskin bottles.
A repetitive evaluation of ice extent in the bay was carried out by means of helicopter flights, during which the changes in the position of ice margin were measured by GPS (Fig. 1). Air temperature 1 m above sea ice was measured daily at station A.
Analytical methods
Bulk salinity in the samples of consolidated ice, IW and UPI was measured using an Autosal Guildline salinometer. Salinity profiles acquired by CTD were corrected against the data obtained by bottle sampling in the water column (n = 28) using the same salinometer (Sal.(CTDcorr.) = Sal.(CTDraw) - 0.0068).
Samples for the determination of nitrate plus nitrite (NO3+NO2), ammonium (NH4), dissolved organic nitrogen (DON) and carbon (DOC) were filtered on precombusted (450°C, 6 h) Whatman GF/F filters. Dissolved inorganic nitrogen forms (DIN = NO3+NO2+NH4) were determined in the course of the field activity by an Alpkem autoanalyzer (Flow Solution III), using standard colorimetric methods (Grasshoff Reference Grasshoff1983). DOC and DON samples were frozen (-20°C) immediately after filtration and stored for later analysis at the I.S.MAR. laboratory (Italy).
DON was determined using the photo-oxidation method of Walsh (Reference Walsh1989). The analysis was preceded by an ultrasonic homogenization of the samples, meant to dissolve the organic particulate that might have formed in the sample vials during storage. The efficiency of the step of ultraviolet oxidation was checked daily with standard solutions and reference seawater (Cozzi & Giani Reference Cozzi and Giani2007).
DOC was determined by High Temperature Catalytic Oxidation method, using a Shimadzu TOC-V analyser equipped with an ASI-V autosampler (Pettine et al. Reference Pettine, Patrolecco, Manganelli, Capri and Farrace1999). DOC concentrations were measured in triplicate (CV < 2%) against standard solutions of potassium hydrogen phthalate. The efficiency of the combustion system was checked daily with artificial standard solutions. The total system blank of DOC (1.7 ± 0.4 μM C) was estimated by the analysis of ultra-pure Milli-Q water.
In order to prevent the occasional inclusion of large detritus that would have invalidated the consistency of the time series, samples for the determination of POC and PON were pre-screened on 200 μm Nitex net immediately after melting of the ice slices. Afterwards, they were filtered on precombusted (450°C, 24 h) Whatman GF/F filters, using a light vacuum (-10 mm Hg) filtration system. Filters were stored in filter holders at -20°C until the analysis at the I.S.MAR. laboratory started. Because of highly variable quantities of POM collected in these samples, volumes in the range of 100–1000 ml were filtered.
The concentrations of POC and PON, POC/PON molar ratios and their carbon and nitrogen isotopic abundance (δ13CPOC and δ15NPON; reported in ‰ units relative to V-PDB and atmospheric N2, respectively) were determined by continuous-flow isotope ratio mass spectrometry (Europa 20-20). Filters were treated with HCl 25% at 60°C, to remove the carbonate (Nieuwenhuize et al. Reference Nieuwenhuize, Maas and Middelburg1994), and carefully sliced in 2–4 subsamples before the analysis in case of the presence of high quantities of particulate on the filters. Total particulate in the samples was expressed as the sum of subsamples, whereas δ13CPOC and δ15NPON values were expressed as averages of these replicates (average standard deviations of 0.23‰ for δ13CPOC and 0.50‰ for δ15NPON).
Isotope analysis was calibrated using a mixture of pure ammonium sulphate and sucrose with C/N molar ratio equal to 8.0, whose isotopic abundance of carbon and nitrogen was determined against IAEA-CH-6 and IAEA-N-1 reference standards, respectively. Long-term performance of the analytical system and the accuracy of the determination of C/N molar ratios were checked daily through the analysis of pure acetanilide (Werner & Brand Reference Werner and Brand2001). The standard deviation of these reference samples (n = 24) was 0.19‰ for δ13CPOC and 0.55‰ for δ15NPON, with an experimental value of C/N molar ratio equal to 8.02 ± 0.19 (theoretical value = 8).
All concentrations reported in this study are expressed per unit liquid (μM). Zero-depth in the vertical profiles of ice cores refers to the interface between bottom ice and unconsolidated platelet layer.
Results
Characteristics of fast ice
Two different types of fast ice were clearly distinguished in the Gerlache Inlet in November 2004 (Table I). In the inner zone of the bay, which included station A, sea ice was intact and 1.87 ± 0.02 m thick. In the outer zone of the bay, which included stations B, C, D and E, it was thinner (1.07 ± 0.03 m) and constituted by large ice floes (≈ 100 m in diameter) connected by frozen joints and characterized by the presence of several cracks. UPI was abundant beneath station A until 18 November, whereas it was scarce beneath the other stations over the whole sampling period. After 22 November, platelet ice below ice cores A6, B4 and A7 was replaced by unconsolidated ice in form of grains that originated by the erosion of the bottom layer. A well-developed brown colouration was already present at the beginning of the field activity in station A in IW and, to a smaller extent, in BI. In the other stations, brown colour was always scarce or absent in BI, IW and UPI.
Snow cover above sea ice was almost completely absent in the bay, with the exception of a snowfall on 17 November that covered the area of sampling sporadically for a few days. At station A, air temperature ranged from -9.5 to -5.5°C during the first two weeks of November, whereas it increased from -3.5 to +1.5°C in the following period until ice breakout.
Ice extent in the bay progressively decreased during the field activity, until its almost complete disappearance (Fig. 1). The position of ice margin, first observed on 29 October 2004 before the beginning of the sampling, slightly changed by 15 November. This event, however, did not have a major impact on the sampling stations. On 20 November, the first significant retreat of sea ice destroyed the sampling sites C and D. After 27 November, ice breakout in the sampling sites A, B and E gave way to open water, which then occupied most of the bay.
Nutrients and DOM in fast ice
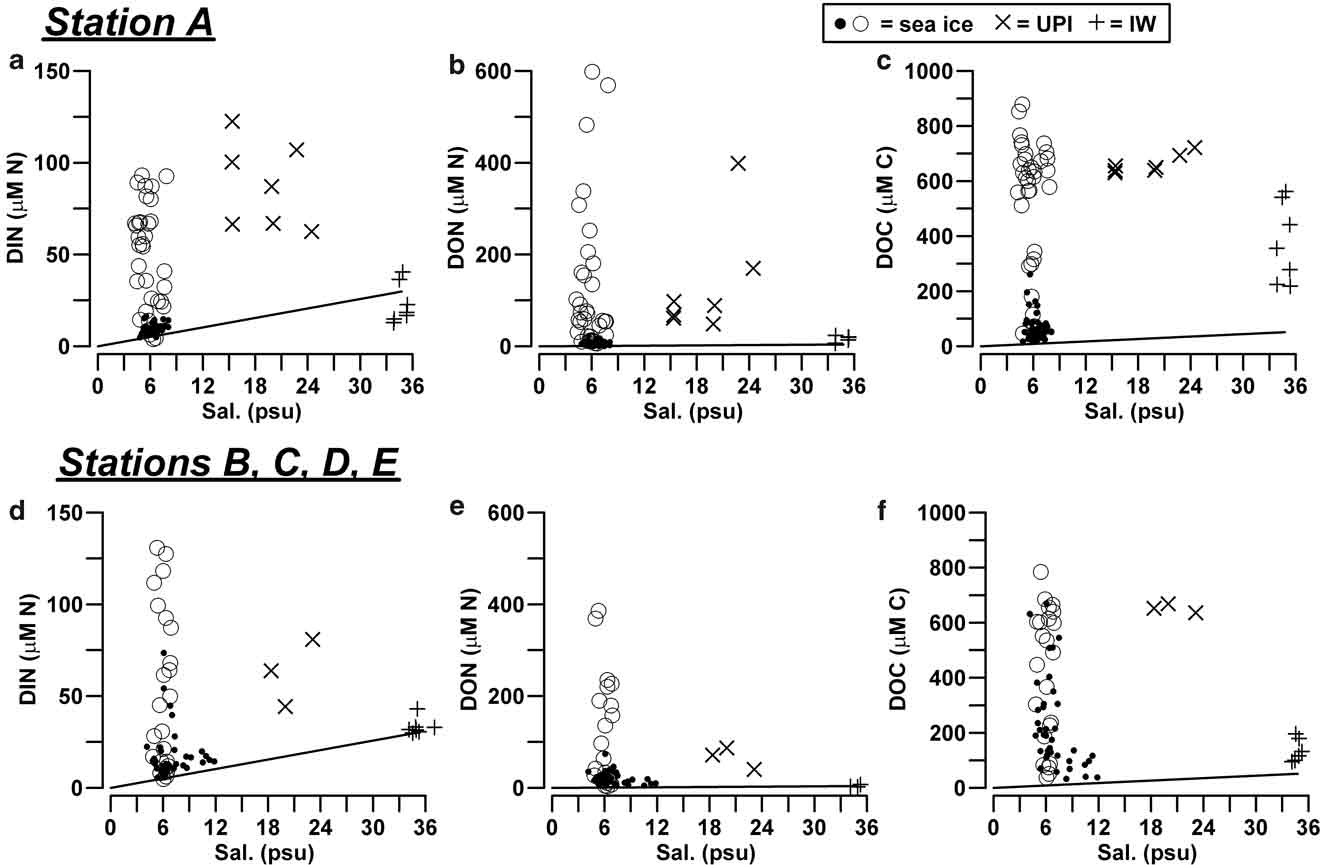
In station A, the highest concentrations of DIN (median = 54.3 μM N), DON (= 58.4 μM N) and DOC (= 616 μM C) in consolidated ice were found in the layer below the 50 cm horizon, which included the bottom ice (Table II). Similar high concentrations were also found in UPI (DIN = 87.0 μM N, DON = 88.9 μM N, DOC = 650 μM C). All these values strongly exceeded those estimated on the basis of the conservative mixing models of seawater, which show the linear decrease of nutrient concentration versus salinity expected during a process of freezing (Fig. 2a–c). By contrast, top ice and the interior ice layer, above the 50 cm horizon, had significantly lower concentrations of DIN, DON and DOC (9.3 μM N, 6.6 μM N and 53 μM C, respectively), often close to the linear dilution values. In the IW of station A, only DOC accumulated at significantly higher levels than those of seawater (356 μM C), whereas the presence of several determinations of DIN below the dilution values indicated a frequent net removal of N-nutrients in this ice habitats until mid-November 2004 (≤ 12.8 μM N; Fig. 2a).
Table II Concentration (μM) of NO3+NO2, NH4, DIN, DON and DOC in the consolidated sea ice, UPI, IW and seawater (median, range of values). Zero-depth in ice cores refers to the interface between bottom ice and unconsolidated platelet layer.

Fig. 2 Concentration of DIN, DON and DOC (μM) as a function of salinity (psu) in sea ice, UPI and IW, a.b.c. in station A, and d.e.f. in the outer stations. Open circles refer to the layers in the consolidated ice characterized by the highest accumulation of nutrients (0–50 cm for station A, 30–70 cm for the outer stations). For comparison, solid lines represent the linear dilution models of nutrients with respect to the concentration of nutrients in seawater (median values; n = 20).
The profiles of nutrients and DOM in stations B, C, D and E were clearly different from those of station A (Table II; Fig. 2d–f). In the consolidated ice of these stations, DIN and DON showed their highest concentrations in an interior ice layer (30–70 cm horizon; medians of 38.0 μM N and 42.2 μM N, respectively) and low values in top ice and BI, whereas DOC showed highly variable concentrations and a broad accumulation over all the ice profiles.
Unconsolidated platelets were not always present beneath the outer stations, but when there, they were characterized by high concentrations of DIN, DON and DOC (63.8 μM N, 71.6 μM N, 653 μM C, respectively). In these cases, the concentrations in IW showed very close values to those of seawater for DIN (31.8 μM N) and DON (3.3 μM N), and slightly higher for DOC (124 μM C).
The most important feature regarding the accumulation of inorganic nitrogen forms in the consolidated ice was the extremely high concentrations of NH4. It varied from 3.4 to 92.7 μM N in the lower ice layer of station A, representing on average 95% of DIN. Similarly, NH4 reached the highest concentrations observed in this study in the interior layer of the outer stations (< 128 μM N), which represented 92% of DIN. In IW and UPI, nitrate was always the most abundant inorganic N-nutrient (median values from 15.0 to 54.8 μM N), ammonium being in the range of 10–31% of DIN (median values from 1.5 to 21.6 μM N).
If the data on nutrients and DOM are considered as a whole, a prevalence of concentration levels which equal or exceed the values estimated by linear dilution of seawater is clear. This finding indicates the predominance in the ice system of the processes of accumulation and release of dissolved nitrogen and carbon over their removal due to internal uptake.
Stable isotope composition of POC and PON in fast ice
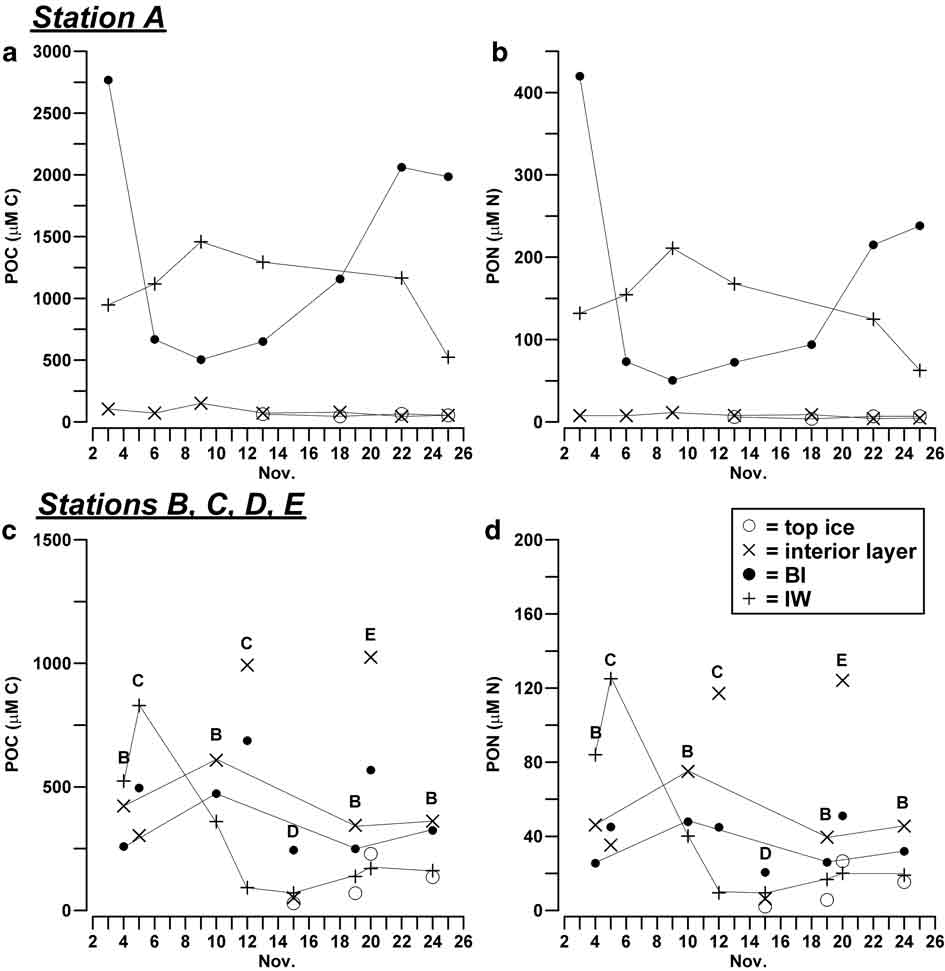
POC and PON distribution in sea ice reflected that of nutrients and DOM, as far as their vertical profiles and the differences between the inner and outer areas of the bay were concerned (Table III). In station A, the highest concentrations of POC and PON were found in BI (1157 μM C, 94 μM N) and in IW (1142 μM C, 143 μM N), whereas their concentrations remained significantly lower in the interior layer and top ice (< 151 μM C, <1 1 μM N). POC/PON molar ratios showed an opposite trend, with higher values in the upper ice layers (= 12.1) than in BI and IW (6.3 and 6.2, respectively).
Table III Concentration (median, range of values; μM) of POC and PON and POC/PON molar ratios (calculated as slope of linear regressions: r 2 = coefficient of determination; n = number of data) in sea ice and IW.

In the consolidated ice of the outer stations, a broad increase of POC was observed both in BI and in the interior layer up to 70 cm (< 1025 μM C). PON showed similar behaviour, reaching concentrations as high as 124 μM N in the interior layer. In IW, particulates had highly variable concentrations (medians of 166 μM C and 20 μM C) that, however, did not reach the levels found in station A. In the outer stations, POC/PON ratios were particularly high in the BI (= 12.6) and in the range 7.9–8.3 in the other horizons of consolidated ice. On the whole, POC and PON resulted in a high correlation in all ice horizons (r 2 = 0.77–0.99) and they had the same ratios in IW in all sampling stations (= 6.2).
A marked temporal evolution of POC and PON was observed in BI and IW in station A, with trends that appeared to be inversely related. By contrast, particulate concentrations remained highly constant in interior and upper ice layers (Fig. 3a & b). In the outer zone, POC and PON concentrations in consolidated ice were found to be rather constant in station B and in the top ice of all stations, whereas they varied widely in the stations C, D and E (Fig. 3c & d). On the whole, the combined effects of temporal changes and spatial heterogeneity in this outer portion of ice determined an overall variability of POC and PON concentrations, expressed as coefficient of variation, equal to 69% and 76%, respectively.

Fig. 3 Temporal evolution of the concentration (μM) of POC and PON in the consolidated sea ice (BI, interior layer, top ice) and IW a.b. in station A, and c.d. in stations B, C, D and E.
As regards IW, particulate concentration showed a significant decrease in station A from 22 November (Fig. 3a & b). In stations B, C, D and E, this decrease was anticipated from 4–12 November and followed by constantly low concentrations until the end of the month (Fig. 3c & d). These trends were consistent with the gradual reduction of the abundance of platelets observed beneath the fast ice during the field activity and with the subsequent flushing of the unconsolidated layer in the sampling area.
Overall, POC constituted 34–64% of total organic carbon, while PON constituted 18–60% of total nitrogen in the consolidated ice. In IW, the relative abundance of particulate matter was higher in station A (78–84% of the total pools) and lower in the outer stations (59–55%).
Isotope composition in the sea ice system at Terra Nova Bay was highly variable, corresponding to an overall range of values from -30.7 to -15.0‰ for δ13CPOC and from 1.8–9.9‰ for δ15NPON. In station A, major changes of isotope composition of POC were found in BI, being the most negative values of δ13CPOC reached at the beginning (-29.7‰) and at the end (-28.6‰) of the sampling period and the highest value (-22.0‰) measured on 8 November (Fig. 4a). These variations of δ13CPOC were inversely related to those of POC previously shown in Fig. 3a, resulting in a significant inverse correlation between the concentration of particulate and its isotopic enrichment (δ13CPOC/POC = -0.003, r 2 = 0.94, n = 6; Fig. 4b). By contrast, δ13CPOC values in the interior layer and top ice were highly negative and constant (-26.4 to -27.8‰) and not related to the low concentration of POC characteristic of these horizons. The values of δ13CPOC in IW of station A (-22.2 to -17.8‰) were different from those of the consolidated ice, as they remained at significantly less negative levels for most of the sampling, and decreased only in the last ice core A7.
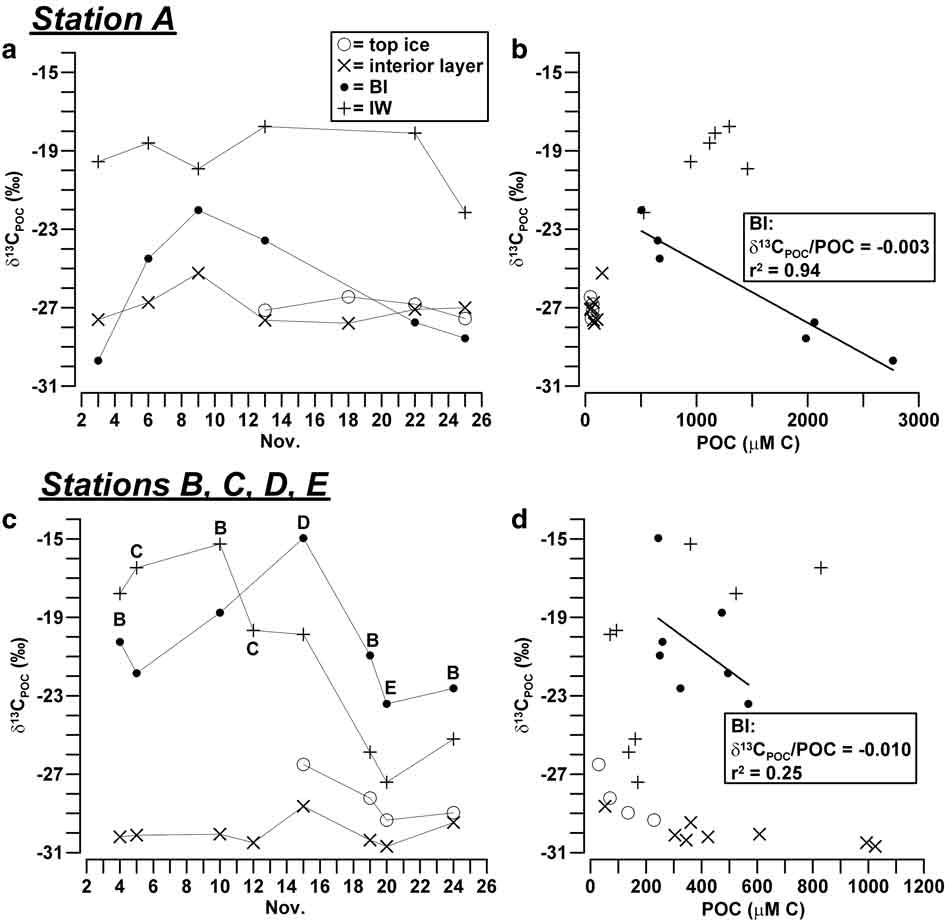
Fig. 4 a. Temporal evolution of δ13CPOC (‰) in sea ice and IW, and b. relationship between δ13CPOC and POC (μM C) in station A. Plots c. & d. show the same for stations B, C, D and E.
In stations B, C, D and E, δ13CPOC showed in BI a similar trend to that observed in station A, although it was shifted towards a less negative range of values (Fig. 4c). It reached a maximum value on 16 November (-15.0‰), one week later than in station A. In this instance, the inverse correlation between δ13CPOC and POC was still detectable, but less significant than in the previous case (δ13CPOC/POC = -0.010, r 2 = 0.25, n = 7; Fig. 4d). In the interior layer and top ice of the outer stations, δ13CPOC reached the most negative values measured in this study (-26.5 to -30.7‰; Fig. 4c). In IW, δ13CPOC ranged from -15.3 to -19.9‰ during the first half of November 2004, after which it strongly decreased, reaching values close to those of the other ice horizons.
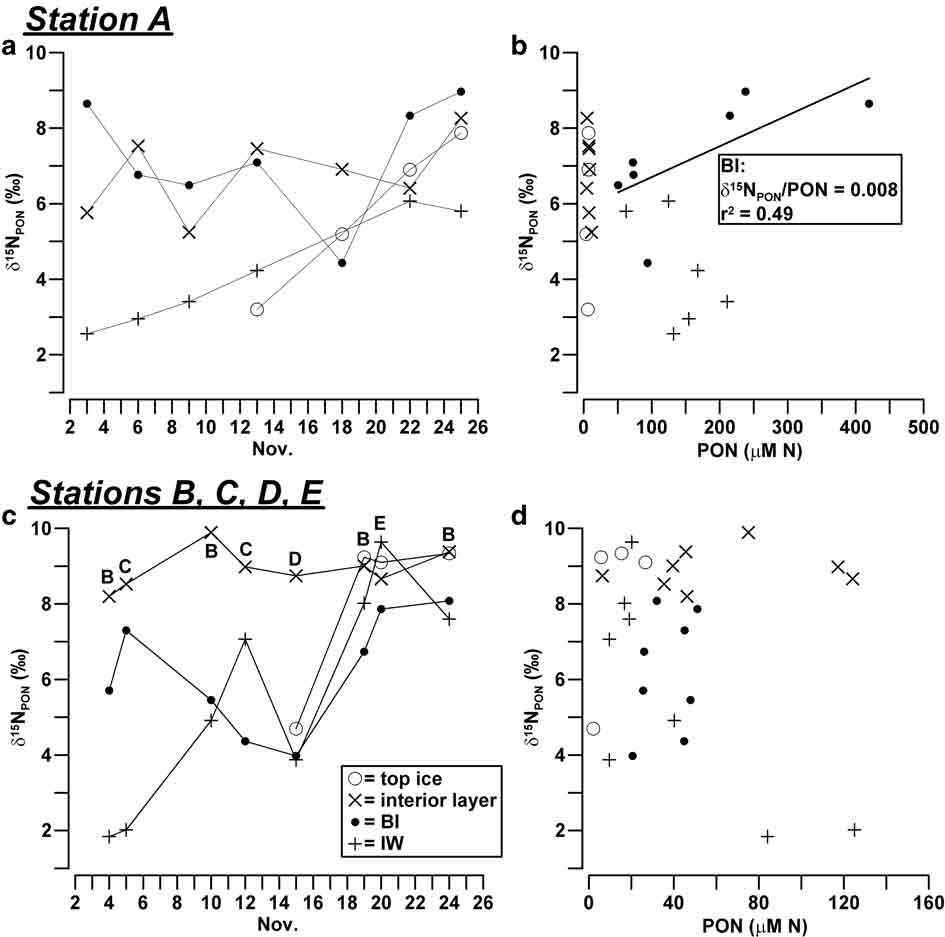
The trends of δ15NPON in sea ice were less distinct than those of carbon. In the consolidated ice of station A, δ15NPON varied from 3.2–9.0‰, showing the lowest values in BI on 18 November (4.4‰; Fig. 5a). This behaviour was the opposite of that shown by δ13CPOC and resulted in a positive correlation of δ15NPON with the concentration of PON (δ15NPON/PON = 0.008, r 2 = 0.49, n = 7; Fig. 5b). In the other ice horizons of consolidated ice, δ15NPON values were variable but scarcely significant, due to the low PON concentrations measured in these samples. By contrast, a clear increase of δ15NPON was observed during the sampling in IW of station A, with values that reached those of the consolidated ice at the end of the month (2.6–6.1‰).

Fig. 5 a. Temporal evolution of δ15NPON (‰) in sea ice and IW, and b. relationship between δ15NPON and PON (μM N) in station A. Plots c. & d. show the same for stations B, C, D and E.
In line with the changes observed in station A, values of δ15NPON in BI showed a significant decrease around the middle of November in the outer stations (> 4.0‰), even if in this latter case the isotopic composition of nitrogen was not related to the concentrations of PON (Fig. 5c & d). δ15NPON in the interior layer and top ice recorded rather constant and highly positive values (8.2–9.4‰), with the exception of the datum of ice core D1 (4.7‰, 15 November 2004). In this instance, however, an extremely low concentration of PON was measured (2.12 μM N). Similarly to what happened in station A, the decrease of the concentration of PON in IW was coupled with a progressive isotopic enrichment that increased δ15NPON values from 1.8–9.7‰.
δ13CPOC and δ15NPON changes in the outer stations were consistent with a prevailing temporal evolution of isotopic composition of particulates due to biogeochemical processes, although these data could also have been affected by a significant spatial variability due to the heterogeneity of the sampling sites.
Characteristics of seawater column and suspended particulate
Salinity and temperature profiles in the water column beneath station A were homogeneous down to a depth of 160 m at the beginning of the sampling, with average values of 34.747 ± 0.002 psu and -1.900 ± 0.007°C, respectively (Fig. 6a & b). From 8–18 November, the seawater column showed only a limited decrease in salinity (-0.012 psu) and increase in temperature (+0.058°C), despite this period included the first breakout of ice in the bay. After ice breakout on 20 November 2004, the processes of freshening and heating became more pronounced in the surface waters close to sea ice, where a salinity of 34.686 psu and a temperature of -1.651°C were reached. On 26 November 2004, a day before the largest ice breakout in the bay, the values of surface salinity and temperature (34.615 psu, -1.520°C) indicated the continuation of the process of ice melting. During the same day, a colder water body (-1.885°C) occupied the previous isothermal layer below 120 m depth, suggesting an active circulation in the bay.
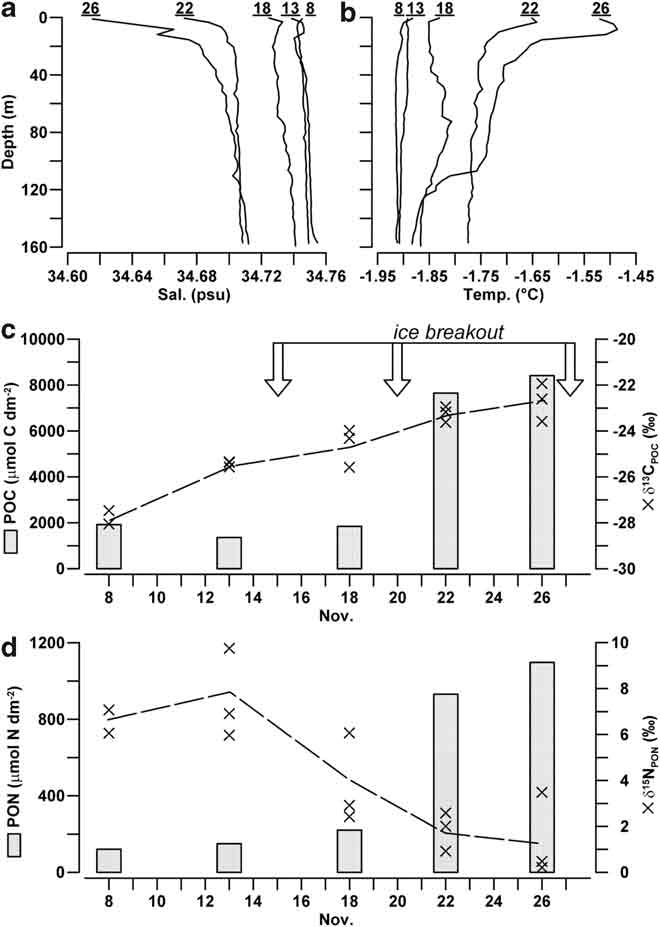
Fig. 6 Profiles of a. salinity (psu), and b. temperature (°C) in the water column beneath station A (numbers indicate the day of sampling). Depth-integrated quantities of c. POC, and d. PON (μmol dm-2) in the layer 10–50 m of depth (trapezoidal rule; n = 3) and values of δ13CPOC and δ15NPON (‰) at the depths of 10, 20 and 50 m (X).
In seawater, nitrate was always the most abundant inorganic nitrogen form (29.3 μM N for NO3+NO2, 0.5 μM N for NH4; Table II). During the sampling period, the concentration of DIN slightly decreased from 31.5 to 27.9 μM N, due to a decreased concentration of nitrate (-4 μM N) that was not balanced by an increase of ammonium (+0.4 μM N). The concentrations of DOC (43.1–95.6 μM C) and DON (1.0–16.7 μM N) showed a higher variability because of the possible contributions from sea ice, but no clear temporal trends.
The integrated quantities of POC and PON in the 10–50 m deep layer remained low until 18 November (> 1915 μmol C dm-2, > 220 μmol N dm-2; Fig. 6c & d), whereas a strong increase of suspended particulate matter was observed after the ice breakout on 20 November (8410 μmol C dm-2, 1097 μmol N dm-2). POC/PON ratio of suspended particulate was high during the first sampling on 8 November (15.9), but its value progressively decreased from 9.1 to 7.7 during the following days.
The average value of δ13CPOC in the water column constantly increased over the whole sampling period (-27.8 ± 0.3‰ to -22.8 ± 0.8‰), showing a scarce dependence on water depth (Fig. 6c). δ15NPON presented more scattered values, although overall characterized by an opposite trend to that of carbon (7.9 ± 1.9‰ down to 1.8 ± 1.6‰), with the lowest isotopic enrichment registered alongside the highest abundance of PON in the water column (Fig. 6d).
Discussion
Evolution of ice system in the Gerlache Inlet
Ice characteristics and ambient conditions found in the Gerlache Inlet in November 2004 were unusual when compared with those reported during previous research activities. In November 1997 and 1999, consolidated ice in the bay was mostly intact with a thickness of 1.4 and 2.5 m, respectively. It was constituted by congelation ice, with the exception of a thin layer of consolidated platelet ice (< 8 cm) in the bottom layer. A more pronounced seasonal warming was observed in the bay after mid-November 1997 (air temperatures from -6 to +1°C) compared with the same period in November 1999 (from -10 to -6°C). These differences determined a progressive retreat of the ice cover until mid-January 1998, in the first case, and a faster ice breakout in January 2000, in the second case (Guglielmo et al. Reference Guglielmo, Carrada, Catalano, Dell’Anno, Fabiano, Lazzara, Mangoni, Pusceddu and Saggiomo2000, Lazzara et al. Reference Lazzara, Nardello, Ermanni, Mangoni and Saggiomo2007, Cozzi Reference Cozzi2008). By contrast, fast ice was clearly subdivided into two zones in November 2004, the inner one being about 80 cm thicker than the outer one. The presence of ice floes connected by frozen joints indicated that a previous ice breakout event, followed by refreezing, had occurred in the external portion of the bay. The combination of these ice characteristics with the pronounced seasonal warming (air temperature from -9.5 to +1.5°C) contributed to an early retreat of ice and its almost complete breakout before the end of this month.
In 1997 and 1999, the major increases of nitrate (< 87 μM N), DON (< 110 μM N) and DOC (< 1300 μM C) were found in the bottom ice and in UPI, as a consequence of the processes of remineralization and release internal to these ice habitats. Ammonium, although present in all the ice profiles (< 13.5 μM N), was the most abundant N-nutrient only in upper horizons, where NO3 was scarce or depleted by the uptake of interior communities (Cozzi Reference Cozzi2008). In the course of the present study, extremely high concentrations of NH4 (< 128 μM N) and DON (< 599 μM N) were found in the bottom ice of the station A and in the interior ice layer of the outer stations. DOC (< 784 μM C) accumulated in the same ice layers, although it did not reach concentration levels as high as those observed in 1999 (Table II).
At the beginning of the sampling, brown algal colouration was already present in BI, UPI and IW, in particular in station A (Table I), but colour intensity decreased in these layers during the following weeks. UPI disappeared by the end of the sampling (ice cores A6, B4, A7), and was replaced by coloured grains of ice deriving from the erosion of bottom layer. During the last days, heating (temperature = -1.520°C) and freshening (salinity = 34.615 psu) of surface waters close to sea ice indicated the beginning of a phase of ice melting interrupted by its breakout. For all these reasons, the general conditions of the ice system observed in November 2004 may be considered as a late decaying phase of evolution of fast ice habitats.
Isotopic signature of fast ice POM
Three layers of consolidated ice were scarcely affected by short-term variability: top ice and interior layer in station A, and top ice in stations B, C, D and E. In these cases, the concentration of DIN (median < 17.2 μM N), DON (< 14.1 μM N) and DOC (< 97.3 μM C) was low, with the main exception represented by a number of high values of DOC found in top ice of outer stations (Fig. 2f). Moreover, nutrient and DOM concentration scarcely varied with time and showed a rather conservative behaviour with respect to salinity, which suggested the absence of strong processes of internal accumulation or uptake. In these conditions, the concentrations of POC and PON were significantly lower compared with those in BI and IW and characterized by the absence of short-term trends (Fig. 3). The values of δ13CPOC were rather constant over the whole sampling period and highly negative, both in station A (-27.7 to -25.2‰) and in the outer stations (-29.3 to -26.5‰). δ15NPON was highly positive, although its trend was more variable compared with that of carbon (Fig. 5a & c). A particularly high isotopic enrichment of nitrogen was reached in these ice layers in stations B, C, D and E (8.2–9.4‰) compared with what was found in station A (3.2–9.0‰).
The combination of these features suggest that aged detritus entrapped in upper ice horizons was the major constituent of this POC assemblage. Highly negative values of δ13CPOC (-25 to -30‰) are known to be characteristics of winter minima in fast ice, including bottom layers, before the pronounced isotopic enrichments concomitant with the spring ice algae bloom (Dunbar & Leventer Reference Dunbar and Leventer1992, Gibson et al. Reference Gibson, Trull, Nichols, Summons and McMinn1999). Those negative values reflect the isotope composition of pelagic particulates in Antarctic surface waters at the time of ice formation (-21 to -30‰), which is typical for ambient conditions characterized by low temperatures and high concentrations of CO2aq (Rau et al. Reference Rau, Sullivan and Gordon1991, Dehairs et al. Reference Dehairs, Kopczynska, Nielsen, Lancelot, Bakker, Koeve and Goeyens1997, Kennedy et al. Reference Kennedy, Thomas, Kattner, Haas and Dieckmann2002). As regards nitrogen, high δ15NPON values may be generated by plankton growth based on nitrate, when this nutrient becomes enriched in 15N because of its depletion in the surface waters, as well as by an isotopic enrichment due to biological reworking of PON (Altabet & Francois Reference Altabet and Francois2001). However, δ15NPON values as high as 9.4‰ do not exclude further 15N enrichment due to biological processes in fast ice, subsequent to the entrapment of pelagic PON, as these values are not usually met in ice free waters of the Antarctic seas (Rau et al. Reference Rau, Sullivan and Gordon1991).
The finding that top ice in the external zone of the bay had lower δ13CPOC and higher δ15NPON values relative to station A cannot be completely explained. However, we noticed that: a) the concentration of DOC and DON increased from station A (53.0 μM C, 6.6 μM N) to the outer stations (174.8 μM C, 18.1 μM N) while POC/PON ratios showed an opposite trend (12.1 to 7.9), suggesting the presence of different biogeochemical conditions in surface waters at the time of early ice formation in the two areas and/or a more pronounced degradation of ice POM with a subsequent DOM release in top ice of the external area, and b) assuming that ice had formed in the outer area of the bay later than in the inner area, a coastal gradient of increasing δ15NPON values may partially reflect a progressive depletion of nitrate in ice free waters caused by blooming phytoplankton during late summer (Saggiomo et al. Reference Saggiomo, Catalano, Mangoni, Budillon and Carrada2002).
The most important increases of POC and PON occurred in BI of all stations and in the interior layer of stations B, C, D and E (≤ 2767 μM C, ≤ 420 μM N), in connection with a large accumulation of nutrients and DOC. In BI of station A, the concentration of POC and PON strongly oscillated on a weekly basis, showing lower values around mid-November and higher values at the beginning and at the end of the sampling (Fig. 3a & b). Previous studies in the Gerlache Inlet have already pointed out that spring accumulation of particulates in BI is not due to the internal growth only. In fact, it largely exceeded those estimated on the bases of the uptakes of NaH14CO3 and 15N-nutrients (Lazzara et al. Reference Lazzara, Nardello, Ermanni, Mangoni and Saggiomo2007, Cozzi Reference Cozzi2008). In November 2004, the opposite oscillations of particulates in BI and in IW further confirmed that the mixing between these layers accounted for a large part of these fast changes of concentration.
POC/PON ratios increased from bottom layer of station A (= 6.3) to the interior (= 8.3) and bottom (= 12.6) layers of outer stations. During the phase of spring accumulation, C/N composition of POM may change in dependence of the availability of inorganic N-nutrients in ice habitats, although POC/PON ratios in sea ice are often variable and their highest values do not always reflect the growth of biomass under N-limited conditions (McMinn et al. Reference McMinn, Skerratt, Trull, Ashworth and Lizotte1999, Thomas et al. Reference Thomas, Kennedy, Kattner, Gerdes, Gough and Dieckmann2001, Kennedy et al. Reference Kennedy, Thomas, Kattner, Haas and Dieckmann2002). In our case, the different structure of ice and early flushing of the unconsolidated layer had certainly affected the evolution of POC/PON ratios in the outer zone of the bay with respect to station A. However, the marked impoverishment of nitrogen in ice POM in outer stations was also consistent with a decreased availability of DIN, even if a condition of inorganic nitrogen depletion was never reached in these ice layers (54.3 μM N in BI of station A, 38.0 μM N in interior layer and 11.9 μM N in BI of outer stations).
Despite the complexity of the processes observed in BI, a significant inverse correlation of δ13CPOC (δ13CPOC/POC = -0.003) and a direct correlation of δ15NPON (δ15NPON/PON = 0.008) were found with respect to particulate concentrations in station A, whereas a similar behaviour was detectable only in relation to carbon in the outer stations (δ13CPOC/POC = -0.010; Figs 4 & 5). It is important to notice that these trends are opposite to those reported in nearly every study in ice habitats, according to which the internal growth of algae usually causes combined increases of δ13CPOC and POC (Kopczynska et al. Reference Kopczynska, Goeyens, Semeneh and Dehairs1995, McMinn et al. Reference McMinn, Skerratt, Trull, Ashworth and Lizotte1999, Kennedy et al. Reference Kennedy, Thomas, Kattner, Haas and Dieckmann2002). In our case, the mixing among three particulate assemblages should have accounted for the largest part of these opposite linear changes of isotopic composition (δ13CPOC/δ15NPON = -3.1, r 2 = 0.85, n = 14): particulate typically grown in BI (δ13CPOC ≈ -15‰, δ15NPON ≈ 4‰, POC/PON = 12) and IW (δ13CPOC ≈ -19‰, δ15NPON ≈ 2‰, POC/PON = 6.2) and the possible contribution of pelagic inputs previously entrapped in consolidated ice (δ13CPOC ≈ -30‰, δ15NPON ≈ 9‰, POC/PON = 6.6; ice core A1). According to this scheme, the major presence of ice-borne POM in BI would have occurred in all the sampling stations around mid-November 2004, at the same time as the lowest concentrations of particulates. At the end of November, the disappearance of the unconsolidated platelet layer and the erosion of BI may have favoured the vertical transport of POM causing another shift of δ13CPOC toward more negative values.
The conclusion that short-term changes of isotope composition were not mainly driven here by internal growth is also supported by the accumulation of DIN, DON and DOC that, in these ice layers, strongly exceeded the linear dilution models of salinity (Fig. 2), as well as by the presence of extremely high concentration of ammonium, the highest ever measured in the fast ice of the Gerlache Inlet (≤ 128 μM N).
The unconsolidated platelet ice was richer in DIN (< 122 μM N), DON (< 399 μM N) and DOC (< 722 μM C) when compared with seawater (Fig. 2). In interstitial water, DOC accumulated both in station A (< 562 μM C) and in the outer stations (< 196 μM C), whereas the concentration of N-nutrients remained low and characterized by the prevalence of nitrate as in seawater (> 43.0 μM N for DIN, > 23.7 μM N for DON). Until mid-November 2004, the concentration of DIN in IW of station A was even lower than what has been estimated from the linear dilution models, indicating a net uptake of inorganic nitrogen in this layer (Fig. 2a). POC and PON remained abundant during most of the sampling period in station A, although they significantly decreased at the end of November. A similar decrease occurred from 4–12 November in the outer stations, as a result of an earlier removal of the unconsolidated layer that led to the complete disappearance of ice platelets (Fig. 3).
Isotope trends in IW were consistent with a succession of phases dominated by internal growth and flushing. Until mid-November, δ13CPOC showed less negative values in IW (-15.3 to -19.9‰) than in consolidated ice and seawater (Fig. 5), a feature that typically indicates a recent isotopic enrichment of POC resulting from the growth of newly produced biomass in a semi closed habitat. Similarly to carbon, the gradual increase of δ15NPON values (2.6–4.2‰) combined to the reduction of nitrate concentration (20.9–8.3 μM N), observed during the same days, were consistent with a nitrate-based growth of PON in a closed system. In fact, these data fit with the first order Rayleigh fractionation equation applied in the case of accumulated product approximation, with an initial δ15NNO3 = 6‰ and a fractionation factor ε = 5‰ (Mariotti et al. Reference Mariotti, Germon, Hubert, Kaiser, Letolle, Tardieux and Tardieux1981). Finally, a recent production is also in line with the presence of a low POC/PON ratio (= 6.2) found in the biomass in IW. After mid-November, the decline of δ13CPOC (down to -27.4‰), as well as the further increase of δ15NPON (< 9.6‰) to values within the range of variability of consolidated ice, might be explained by the mixing that followed the flushing of the unconsolidated layer.
Downward flux of ice POM in the water column
The settling of ice POM was clearly observed in the water column as a consequence of ice breakout on 20 November 2004 (Fig. 6), as the integrated quantities of suspended POC and PON sharply increased in upper layer up to 8410 μmol C dm-2 and 1097 μmol N dm-2, respectively. High concentrations of suspended POC and PON have been reported in the Gerlache Inlet during the summer in ice-free waters (< 942 μg C l-1, < 174 μg N l-1; Fabiano et al. Reference Fabiano, Chiantore, Povero, Cattaneo-Vietti, Pusceddu, Misic and Albertelli1997) and in the water column below sea ice (< 1204 μg C l-1, < 205 μg N l-1; Pusceddu et al. Reference Pusceddu, Cattaneo-Vietti, Albertelli and Fabiano1999). Such concentrations have their origin in the contributions of sympagic biomass, macroalgal detritus, zooplankton debris and faecal pellets, as well as in the possible advection under sea ice of blooming phytoplankton from adjacent ice-free coastal areas (Fabiano & Pusceddu Reference Fabiano and Pusceddu1998). The concentration of POM reported in summertime is up to four times higher than that measured in the present study. That, however, refers only to the size fraction < 200 μm. This finding indicates that ice breakout may anticipate significant inputs of POM in the pelagic environment at the beginning of the Antarctic productive season.
Our data confirm that ice POM contributes to a shift towards less negative values of δ13CPOC in the water column (-27.8 to -22.8‰), as already pointed out (Rau et al. Reference Rau, Sullivan and Gordon1991, Dunbar & Leventer Reference Dunbar and Leventer1992, Gibson et al. Reference Gibson, Trull, Nichols, Summons and McMinn1999, Thomas et al. Reference Thomas, Kennedy, Kattner, Gerdes, Gough and Dieckmann2001). They also indicate a concomitant decrease of δ15NPON values (7.9–1.8‰), which has not been reported for coastal zones of the Ross Sea covered by fast ice before. If we assume that depth-integrated quantity of suspended particulate matter measured in the water column at the end of November 2004 (POC = 8410 μmol C dm-2, average δ13CPOC = -22.7‰) originated from the mixing between an initial pelagic POC assemblage (1915 μmol C dm-2, average δ13CPOC = -27.8‰) and a sympagic POC sinking from IW (average δ13CPOC = -18.8‰), we can estimate that 73% of the increase observed in the water column during November 2004 was due to inputs from IW. According to this hypothesis, the largest reduction in δ15NPON values measured in surface waters from 13–18 November should also be ascribed to the contribution of PON generated in IW (δ15NPON ≈ 2‰). In fact, the limited changes in nutrient concentration in the water column (-4 μM for NO3+NO2, +0.4 μM N for NH4) do not support a comparable isotope fractionation due to the cycling of nitrogen in the pelagic environment. These inputs of nitrogen-rich particulate from IW (POC/PON = 6.2) may also be viewed as the main reason for the decrease of POC/PON ratios measured in the water column (15.9–7.2).
The effects of settling events of ice POM easily propagate throughout the whole Antarctic coastal environment, as their signature was detected in isotope analysis of benthic invertebrate species (Norkko et al. Reference Norkko, Thrush, Cummings, Gibbs, Andrew, Norkko and Schwarz2007). However, their significance for open sea regions needs to be better assessed. It is interesting to note that in our case the bulk value of δ13CPOC in upper horizons of consolidated ice (median = -27.8‰) was different from that in BI and IW (= -20.9‰), but similar to winter minima usually found in the open Antarctic sea. As the particulates entrapped in upper ice layers are not released at the time of early ice breakout, but only during the following ice melting, we can speculate that the contribution of sea ice to pelagic POM assemblages might significantly change during the transport and melting of ice floes, either in terms of quantity of released particulates or of isotopic composition, as a function of the temporal succession of ice layers that are eroded. This variability might be an important factor in the uncertainty concerning the present and past contributions of ice POM in the modelling of carbon and nitrogen isotopes in large regions of the Southern Ocean (Altabet & Francois Reference Altabet and Francois2001, Robinson & Sigman Reference Robinson and Sigman2008).
Schematic model of isotope fractionation of fast ice POM
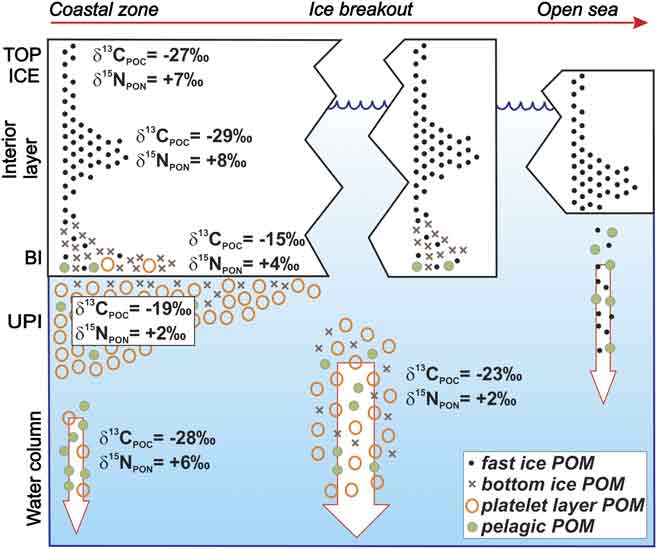
A summary of the evolution of stable isotope composition of POM in fast ice system at Terra Nova Bay is given in Fig. 7. The upper layer of consolidated ice contains the assemblage of POM that is suspended in the surface coastal waters during autumn, at the time of early ice formation, but, depending on the events of freezing that occur during winter, higher quantities of particulates may also be entrapped in interior ice layers. The isotopic signature of these assemblages is the result both of their initial characteristics and of possible decaying processes in sea ice. However, just as the physical conditions of fast ice show a pronounced interannual variability in this coastal zone, it should be expected that the stable isotope composition of POM in upper ice horizons may significantly vary annually as well.

Fig. 7 Schematic model of the evolution of stable isotope composition of POM assemblages (< 200 μm) in fast ice, in unconsolidated platelet layer and in the water column. End member values of δ13CPOC and δ15NPON measured in November 2004 are also shown.
The major spring accumulation of biomass in fast ice occurs, on a shorter time scale, in the bottom ice and in the unconsolidated platelet layer, because of the combined effects of internal growth, colonization from the water column and drainage through the brine channels. Growth conditions of biomass in these two ice habitats are often different during spring and thus leading to distinct isotopic compositions that, however, may be altered afterwards by the mixing between these POM assemblages.
At the end of the productive period in fast ice, a progressive erosion of platelet layer and bottom ice takes place as a consequence of the circulation and of the meteorological conditions at a local scale. Flushing of these ice layers causes increasingly downward fluxes of POM in the water column, whose isotope composition of suspended POM shifts to values that are closer to those typical of ice habitats. The events of ice breakout strongly enhance the sedimentation of ice POM in the coastal zone, whereas POM entrapped in upper ice horizons can be released in the water column only following the melting of ice floes. This mechanism may enlarge the marine areas subjected to inputs of POM generated in coastal zones covered by fast ice.
Conclusions
Integrated quantities as high as 25 g C m-2 and 4 g N m-2 were reached in ice system at Terra Nova Bay for POC and PON during November 2004, respectively. This particulate assemblage had weighted averages of δ13CPOC = -24.1‰ and δ15NPON = 4.6‰, which reflect the major contributions of ice POM accumulated in the bottom layer and in the unconsolidated platelet layer. However, the present study confirms that isotope composition of POC and PON in fast ice exhibits a high variability (-30.7 to -15.0‰ for δ13CPOC, 1.8–9.9‰ for δ15NPON), as a result of spatial heterogeneity of ice habitats and of their pronounced temporal evolution. This variability exceeds that typically found in the pelagic environment of the Southern Ocean, making it difficult to identify ice POM as a well-defined isotopic end member for large scale geochemical modelling.
Isotope fractionation in ice POM is affected by the combined effects of physical conditions of ice microenvironments and of biological processes internal to sympagic community. For this reason, the role of ice biota on isotope fractionation cannot be restricted only to the growth of algae in closed or semi-closed habitats, as different isotopic patterns easily result because of mixing, microbial degradation of POM and of its reworking due to cycling through higher trophic levels.
The events of ice breakout clearly induce a high release of ice POM in Antarctic coastal waters. They precede and extend the major increases of pelagic biomass due to the production processes occurring in ice-free waters during summer. However, other studies would be needed to understand better the propagation of the isotopic signals of ice POM on larger scales in both present and past perspectives.
Acknowledgements
This study was funded by Programma Nazionale di Ricerca in Antartide and carried out in the framework of SEAROWS research project (Sea-ice Ecology in the Antarctic: ROss and Weddell Seas). We thank the logistic support of the Italian Station “Mario Zucchelli” at Terra Nova Bay, the colleagues involved in the field activity and the reviewers for their useful criticism and comments.