


Introduction
Environmental protection of Antarctica is provided for by the Antarctic Treaty and its annexes (Watts Reference Watts1992) which dictate national responsibilities for protection of the environment. Treaty obligations are enacted through national legislation that regulates the conduct of each country's nationals while in Antarctica. The Protocol on Environmental Protection, which came into force in 1998, clarifies the Antarctic Treaty's environmental protection practices and requires that disturbances be quantified through long-term, sustained observations/monitoring (Stokke & Vidas Reference Stokke and Vidas1997).
In 1996, a joint Scientific Committee on Antarctic Research (SCAR) and Council of Managers of National Antarctic Programs (COMNAP) workshop report entitled ‘Monitoring of Environmental Impacts from Science and Operations in Antarctica’ outlined approaches and methodologies useful for monitoring of human impacts within Antarctica (Kennicutt et al. Reference Kennicutt II, Sayers, Walton and Wratt1996) and provided the guidelines used in developing a long-term monitoring programme at McMurdo Station. A pilot programme was conducted from 1999–2002 establishing the basic elements of a monitoring programme. Based on this pilot programme's outcomes, an ongoing environmental monitoring programme has been in place at McMurdo Station since 2003 (Kennicutt et al. Reference Kennicutt II, Klein, Montagna, Sweet, Wade, Palmer, Sericano and Denoux2010). This effort has been recognized as one of the first comprehensive, systematic environmental monitoring studies in Antarctica (Hughes Reference Hughes2010).
This paper describes a portion of the terrestrial component of the monitoring programme. It examines the spatial patterns of total petroleum hydrocarbons (TPH) measured in the terrestrial environment surrounding McMurdo Station from 1999–2007 documenting the spatial “footprint” of petroleum hydrocarbons at the station. As such, the study assists in mapping the extent of historical petroleum spills, assessing the impact of ongoing logistic operations and can aid in the management decision making process.
Fuel spills are a leading source of environmental contamination near Antarctic bases (Bargagli Reference Bargagli2005, Bargagli Reference Bargagli2008, Tin et al. Reference Tin, Fleming, Hughes, Ainley, Convey, Moreno, Pfeiffer, Scott and Snape2009) and petroleum hydrocarbon contamination has been identified as a persistent source of contamination in the soils surrounding McMurdo Station (Chiang et al. Reference Chiang, Chang and Brown1997). Soil contamination is not surprising as the United States Antarctic Program (USAP) operations depend on fossil fuels. Currently the USAP annually consumes c. 25 million litres of fuel of which c. 48% is for aircraft and 52% for facility operations (National Science Foundation 2004). Fuel usage at McMurdo Station since 1990 is illustrated in Fig. 1. For the 14 years when fuel usage can be verified (1997–2010) total annual usage averaged 23.8 million litres.

Fig. 1 Fuel issue at McMurdo Station from 1990–2011 in millions of litres for AN-8, JP-5 and MOGAS (unleaded gasoline). Fuel issue prior to 1997 cannot be verified and the totals for 2011 are projected.
As the logistical hub of the USAP operations, McMurdo Station is the site of the majority of land-based fuel consumption and fuel handling within the USAP with c. 8.5 million litres consumed annually at the station (National Science Foundation 2004). At McMurdo Station, fuel is off-loaded from tanker ships and transferred to bulk fuel storage tanks. From these tanks, fuel is transferred to aircraft and helicopters at multiple airfields and is moved by traverse to other locations. In addition, fuel is locally consumed for power generation, building heating and operation of the station's vehicle fleet. During the 2008–09 to 2010–11 field seasons, when extensive traverses occurred, c. 72% of fuel usage went towards aircraft operations, 23% for local consumption and ship refuelling at McMurdo Station and 5% for traverses (Raytheon Polar Services Company, unpublished data).
As an example of recent local fuel consumption at McMurdo Station, in 2003 fuel use was as follows: 4.5 million litres consumed for power generation, 2.1 million litres for heating and water production, and 1.9 million litres for equipment operations (National Science Foundation 2004). The majority of fuel consumed was diesel fuel (8.2 million litres). All of these activities have the potential for accidental releases of petroleum to the environment.
While different fuels have been used within the USAP over its history, two aviation fuels are currently used both for aircraft and diesel machinery. The aviation turbine fuel AN-8, which is JP-8 with an icing inhibitor added to depress the freezing point to -58°C, has been in long-term usage in the program for South Pole and deep field activities (Chiang et al. Reference Chiang, Chang and Brown1997, Edwards Reference Edwards2007). This fuel is kerosene based containing alkanes, alkenes, cycloalkanes, and aromatic hydrocarbons ranging from c. C9–C20. Potentially toxic aromatic compounds include alkyl-benzenes, toluene, naphthalenes and other polycyclic aromatic hydrocarbons. JP-5, which has a much higher flash point and a higher freezing point of -46°C (Edwards Reference Edwards2007), is also used for operations in the McMurdo Station area. Specifications for JP-5 and JP-8 are found at www.desc.dla.mil/DCM/Files/5624t.pdf (accessed April 2011) and www.desc.dla.mil/DCM/Files/t83133e.pdf (accessed April 2011), respectively.
Diesel Fuel Arctic (DFA) was used in the past (Aislabie et al. Reference Aislabie, Balks, Foght and Waterhouse2004). Approximately 300 000 litres of medium grade unleaded gasoline is annually consumed (National Science Foundation 2004) as are smaller quantities of various lubricating and engine oils. For the most recent 14 years, where verifiable information is available, fuel usage breaks down as follows: AN-8 (58%), JP-5 (40%) and MOGAS - unleaded gasoline (2%) (Fig. 1). Accidental discharges of various amounts of petroleum hydrocarbons have occurred during McMurdo Station's 50 years of continuous operations causing contamination of the station's soils.
The fate of fuel spilled on Antarctic soil includes the loss of low molecular weight (LMW) hydrocarbons, including jet fuel and gasoline, as it is volatized to the atmosphere prior to migration through the unfrozen active layer. Downward movement may be impeded by an ice-saturated layer overlying the permafrost. Higher molecular weight (HMW) hydrocarbons are the least volatile and least mobile components (Aislabie et al. Reference Aislabie, Balks, Foght and Waterhouse2004). However, once in Antarctic soils, hydrocarbons are generally long-lived. Gore et al. (Reference Gore, Revill and Guille1999) documented that ten years after a relatively minor fuel spill on a helicopter pad at Bunger Hills while fuel was absent from the surface layer, degradation of aviation kerosene was insignificant in the subsurface. Heavier lubricating oil showed no mobility or degradation even in the surface layer. Snape et al. (Reference Snape, Ferguson, Harvey and Riddle2006) found that for a fuel spill at Casey Station, fuel migrating across frozen ground evaporated in a few months after the spill. Evaporative losses become negligible if the fuel infiltrates the ground and the half-life of the fuel in the subsurface was estimated to be of the order of decades. Once in the subsurface fuel remains mobile. Fuel from one spill at Casey Station was documented to migrate over 200 m in the shallow subsurface down a small catchment into the ocean (Revill et al. Reference Revill, Snape, Lucieer and Guille2007).
The impact of fuel spills on the physical properties of the soil and its microbial populations has been studied and has been recently reviewed in Aislabie et al. (Reference Aislabie, Balks, Foght and Waterhouse2004). Of particular relevance to conditions at McMurdo Station are studies undertaken at nearby Scott Base which is underlain by similar soils. Bej et al. (Reference Bej, Saul and Aislabie2000) identified cold tolerant, alkane-degrading microbes isolated from oil contaminated soil at Scott Base. Balks et al. (Reference Balks, Paetzold, Kimble, Aislabie and Campbell2002) documented that hydrocarbon contaminated soils had lower albedo and thus higher soil temperatures than adjacent non-contaminated soils. In addition, these contaminated soils were found to be weakly hydrophobic, whereas pristine sites were not hydrophobic. However, this difference did not translate into differences in moisture retention between the sites. Studies have also indicated that fuel contamination can increase the abundance of hydrocarbon-degrading microbes in Antarctic soils (Delille & Pelletier Reference Delille and Pelletier2002, Coulon & Delille Reference Coulon and Delille2006). However, one site at Scott Base showed reduced numbers of heterotrophic bacteria which was attributed to the presence of residual, toxic leaded fuel (Aislabie et al. Reference Aislabie, Balks, Foght and Waterhouse2004).
The practical consequence of the slow degradation of fuel in soils at McMurdo Station is that spatial variations in soil petroleum hydrocarbons are complex. The patterns represent the cumulative effects of multiple fuel spills over the station's 50 year history as well as the redistribution of fuel at the surface and in the unfrozen active subsurface layer. The impacts of fuel spills on the physical properties of the soil and its biota are also complex since there are a variety of types of hydrocarbons at McMurdo Station. In addition, it is difficult to separate the impact of hydrocarbons from other anthropogenic impacts at the station including other chemical contaminants, most commonly metals and the extensive physical disturbance and modification of the surface.
While current environmental protocols have tracked the locations and quantities of fuel spilled since the mid 1990s, the location of historical fuel contamination has not been as well documented. A key element to understanding the nature of fuel contamination at McMurdo Station is to accurately map the spatial patterns of hydrocarbon contamination over time.
An initial survey of petroleum hydrocarbons over a portion of McMurdo Station was undertaken in 1994 (Chiang et al. Reference Chiang, Chang and Brown1997). Soil samples were collected on a 100 m grid across the station and on a 25 m grid in areas of suspected contamination. Quantities of TPH (> 10 ppm) above the detection limits were found in c. 85% of the samples and nearly one half (45%) of the soils contained more than 100 ppm (Chiang et al. Reference Chiang, Chang and Brown1997). While the study documented contamination across the station, the 206 samples collected during this study were inadequate to fully characterize the spatial pattern of hydrocarbon contamination across the station. This current study provides a spatially complete view of hydrocarbon contamination at McMurdo Station. The results answer fundamental questions about the spatial extent and pattern of hydrocarbon contamination in the soils at one of the most heavily utilized sites in Antarctica. The study also establishes a baseline from which to measure future changes in the spatial footprint of petroleum hydrocarbons at McMurdo Station, Antarctica.
Study area
McMurdo Station is located in a c. 4 km2 ice-free area at the southern tip of Hut Point Peninsula on Ross Island c. 2.5 km from New Zealand's Scott Base (Fig. 2). McMurdo Station's summer population of over 1000 people makes it by far the largest population centre on the continent. Human occupation at the site dates to 1902 when Capt. Robert Falcon Scott's National Antarctic Expedition used Winter Quarters Bay as its overwintering locale. The expedition's Discovery Hut on Hut Point, is an Antarctic Historic Site (No. 18) and an Antarctic Specially Protected Area (ASPA No. 158).

Fig. 2 Location of McMurdo Station and Scott Base on Ross Island, Antarctica. The background image is a true colour composite from the Landsat Image Mosaic of Antarctica (LIMA). The star indicates the location of McMurdo Station and the solid circles represent the control sites used in this study. The inset map shows the location of Ross Island on the Antarctic continent.
Permanent occupation of the site by the United States began in December 1955 with the establishment of Naval Air Facility McMurdo. The base was renamed McMurdo Station in 1961 and has continued as the logistical hub of USAP activities ever since. Figure 3 presents an overview map of the station. Geographically, the station occupies a sheltered topographic location with the main station occupying an area of less than 1 km2. The buildings comprising most of McMurdo Station are located a few tens of metres above sea level adjacent to McMurdo Sound and Winter Quarters Bay. Cargo storage yards and other facilities extend further upslope. McMurdo Station is sheltered by surrounding topographic features including Observation Hill, ′Crater Heights′ (unofficial name), Twin Crater and Arrival Heights. On the station's east side located between Observation Hill and ′Crater Heights′ is a topographic low called ′the Gap′ or ′the Pass′ which contains the main road running to Scott Base and Williams Air Field. It is also the current site of most fuel storage at McMurdo Station, though historically bulk fuel was stored at several locations across McMurdo Station (white areas in Fig. 3). The history of McMurdo Station is summarized in Klein et al. (Reference Klein, Kennicutt II, Wolff, Sweet, Bloxom, Gielstra and Cleckley2008).

Fig. 3 Map of McMurdo Station with landmarks labelled. The highlighted areas indicate portions of the station with historical and/or current fuel storage. The background image is a Quickbird satellite image acquired on 1 January 2003, copyright DigitalGlobe Inc.
Methods
Terrestrial sampling
McMurdo Station soils were sampled from 1999–2007 with over 2490 samples collected. Additional soil samples, “controls”, were collected at Arrival Heights, Bratina Island, Cape Bird, Cape Evans and Marble Point to characterize background concentrations of contaminants in the region (Fig. 2). However, based on geochemical similarity to soils at McMurdo Station, only samples from Bratina Island, Cape Bird and Arrival Heights are included in this study. The sampling locations at all control sites were situated away from areas of known current or historical impacts. While there is some vehicular activity within the Arrival Heights Antarctic Specially Protected Area (ASPA no. 122), sampling sites were situated in locations where there has been minimal, if any, human impact. At the three control sites included in this study, all measured TPH concentrations were low (< 30 ppm).
Two soils exist at McMurdo Station and are locally referred to as “red” and “grey” soils. The red soil is a crushed red oxidized scoria that is very porous and coarse, whilst the grey soil is composed of sand and gravel and is found across most of the station area (Crockett Reference Crockett1998) and underlays most areas with elevated levels of petroleum hydrocarbons in the soil. On occasion soils are mechanically excavated and redistributed around the station.
It is important to note the sampling strategy for the samples collected for this study was not solely to examine the spatial variability of hydrocarbons at McMurdo Station. Areas of known or suspected impact were sampled repeatedly to monitor temporal changes in contamination. Each year a number of samples are collected randomly across the station to provide an overall assessment of contamination. Therefore, spatial sampling is characterized by a high sampling density in areas of suspected contamination, but a lower sampling density in areas suspected to be less impacted by human activity.
Samples collected from 1990–2001 were part of the pilot study that designed and tested the sampling programme employed in the long-term environmental monitoring programme. Samples were collected using two basic spatial sampling schemes. Both schemes employed a two-tiered sampling structure. A subset of the samples was collected across the entire station to document spatial patterns and to monitor changes in overall contamination concentrations (hereafter referred to as regional samples). The remaining samples were collected in areas of known historic and/or ongoing environmental impacts (intensive samples).
In 1999 and 2000, 310 regional samples were collected at random locations within a 100 x 100 m grid encompassing a large area of the station. A subset of these grid cells located in known or suspected areas of impact were then subdivided into 16 intensive 25 x 25 m grid cells in which a sampling point was randomly placed resulting in collection of 737 samples. In 2001 within areas of known hydrocarbon contamination, four 25 x 25 m grid cells were further subdivided into 5 x 5 m squares to assess variability of TPH concentrations over finer spatial scales (125 samples).
In 2001, a probabilistic sampling design was implemented. The sampled area around the station was enlarged to include Black Knob and ‘Crater Heights’ that, while impacted by station activities, were not covered by the 1999 and 2000 sampling grid. With the exception of areas of ice cover or steep slopes, a grid of 4460 hexagons with an edge-to-edge diameter of 25 m was placed over the entire area of McMurdo Station. In 2001 and from 2003 to present, a small subset (c. 70) of these hexagons were randomly selected and sampled to characterize the concentrations of contamination at the station.
Since 2001, 460 of these random samples have been collected. Each year, typically six to eight hexagons were selected in areas with the potential for significant environmental impacts (e.g. refuelling station, helicopter landing pad, equipment maintenance and parking areas, and fuel tanks) to monitor changes in TPH concentrations over time. These hexagons were subdivided into 16 smaller hexagons in which a sample location was randomly placed. From 2003–07, 606 intensive samples were collected in this manner. A comparison of the rectangular and hexagon sampling plans is illustrated in Fig. 4.

Fig. 4 Illustration of the two spatial sampling schemes employed in the study. The rectangular grid based scheme (left) was used in 1999 and 2000 while the hexagonal grid scheme (right) was tested in 2001 and employed from 2002–07. The larger circles indicate samples collected randomly across the station while the smaller circles are those collected intensively in areas of historic or ongoing environmental impact. Quickbird image, copyright DigitalGlobe Inc.
An additional 252 samples were included in the analysis. These samples represent locations with high TPH concentrations that were re-sampled, samples collected around a small vehicle maintenance building that was removed and samples collected to improve the spatial sampling coverage. Table I summarizes the soil sampling conducted at McMurdo Station used in this analysis, while Fig. 5 illustrates their locations.
Table I Summary of soil samples collected around McMurdo Station in 1999–2001 and 2003–07 used in this analysis.

Fig. 5 Map illustrating the locations of the terrestrial soil samples collected at McMurdo Station from 1999–2001 and 2003–07 used in this study. Quickbird image, copyright DigitalGlobe Inc.
In the field, a real-time differentially-corrected Global Positioning System (GPS) unit (typically a Trimble Real Time Kinematic system) was used to navigate to the pre-determined random sampling locations. At each site, a one metre square area was characterized, photographed and the depth to the top of ice-cemented ground was determined. A surface soil sample was collected and stored in a pre-cleaned 250 ml glass jar.
For logistical reasons most of the soil samples analysed in this study were collected in the first half of December. This period precedes the date of maximum active layer depth measured at Scott Base which typically occurs in mid–late January (Adlam et al. Reference Adlam, Balks, Seybold and Campbell2010). However, even later in the season it is difficult, if not impossible, to collect samples to any significant depth within many areas of McMurdo Station proper without significant mechanical disaggregation of the ice-cemented soil. More than 50 years of station operations have altered surface materials within the station making them much harder to disaggregate compared to nearby unaltered sites. Built-up areas have been levelled by adding fill and large areas adjacent to the station have had much of the soil layer removed for building fill (Klein et al. Reference Klein, Kennicutt II, Wolff, Sweet, Bloxom, Gielstra and Cleckley2008). Other areas, like roadways, parking lots and cargo storage have been compacted by vehicular traffic. Due to these difficulties, a surface sampling strategy was adopted.
Total petroleum hydrocarbons samples in this study were typically limited to the upper 2–5 cm of soil. Sampling was conducted to avoid collection of larger grained material in favour of fines whenever possible. Following field collection, soil samples were stored and shipped frozen (-20°C) via ocean vessel to the US-based laboratory, for contaminant analysis.
Contaminant analysis
Total petroleum hydrocarbons in this study are defined as the sum of all hydrocarbons, degraded and non-degraded, extracted from a sediment or soil sample. This method uses a high-resolution capillary gas chromatograph with flame ionization detection (GC/FID). The GC/FID data is used to quantitatively determine resolved aliphatic hydrocarbons concentrations (the normal alkanes from n-C10 to n-C35, pristane, and phytane) as well as unresolved complex hydrocarbon mixture concentrations.
Soil samples were extracted by pressurized fluid extraction with an Accelerated Solvent Extractor (Dionex ASE 200) system at 10.3 MPa and 100°C. Prior to extraction, the samples were spiked with surrogate compounds consisting of deuterated alkanes with 12, 20, 24, and 30 carbons (Cambridge Isotope Laboratories Inc) at concentrations approximately ten times the method detection limit. Approximately 20 g of soil (excluding gravel or larger sized particles whenever possible) were chemically dried using anhydrous sodium sulfate or hydromatrix (high purity, inert diatomaceous earth) prior to loading into the extraction cells and extracted using dichloromethane. The extracts were then transferred to Kuderna-Danish tubes, which were heated in a water bath (60°C) and concentrated to a final volume of 1 ml. During concentration of the extract, dichloromethane was exchanged for hexane and deuterated hexadecane (n-C16) was added as a gas chromatograph (GC) internal standard to calculate surrogate recoveries.
Total petroleum hydrocarbons were analysed by gas chromatography in the splitless mode using a flame ionization detector (FID). A 30 m x 0.32 mm I.D. fused silica column with a DB-5 bonded phase (J&W Scientific) was used to create chromatographic conditions that provided baseline resolution of n-C17/pristine and n-C18/phytane peak pairs. The calibration solutions were in the range of 0.2–50 μg ml-1. Quantification was performed using an average relative response factor derived from the response factors of n-C10 to n-C35 including pristine and phytane and adjusted for surrogate recoveries. The resulting chromatogram was integrated using a straight line between the retention time for the n-alkane n-C10 and the retention time for the n-alkane n-C35. This integration includes most extractable petroleum hydrocarbons. All analyses were accompanied by a comprehensive quality assurance programme including daily calibration checks, surrogates, internal standards, blanks, replicates, matrix spikes, and analysis of reference materials comparable to NOAA's National Status and Trends protocols (Wade et al. Reference Wade, Atlas, Brooks, Kennicutt II, Fox, Sericano, Garcia-Romero and DeFreitas1988).
The TPH are defined as the sum of the total unresolved complex mixture (UCM) and the total resolved complex mixture (RCM) concentrations. The RCM concentration represents the sum of all the resolved hydrocarbon peaks including the n-alkanes and isoprenoids, minus all surrogate and internal standard peak areas. The UCM concentration is determined based on the entire integrated area from n-C10 to n-C35. The UCM value represents the total integrated area of the chromatogram adjusted to remove areas of the RCM and the GC column bleed. Column bleed is defined as the reproducible baseline shift caused by the temperature of the GC oven. As oil degrades, the UCM “hump” becomes larger and the RCM decreases.
It is possible to identify potential petroleum sources using distinct hydrocarbon patterns from the chromatogram. At McMurdo Station there are multiple TPH patterns present including LMW gasoline/JP5/AN8, residual weathered petroleum and a UCM of HMW material. This unknown HMW pattern, which elutes between n-C26 and n-C29, with a prominent unresolved component and a distinct group of peaks is present in many samples and can be the dominant feature in some chromatograms (Fig. 6). Chromatograms containing this HMW pattern were integrated over this region to determine the concentration of this HMW component.

Fig. 6 Typical chromatograph illustrating the portion of the chromatograph that is integrated to determine the total petroleum hydrocarbons (light box) and unknown high molecular weight component (dark box).
Geographic Information Systems, geostatistics and spatial statistics
Geographical Information Systems (GIS) and geostatistics were used to document and analyse spatial patterns of soil TPH concentrations at McMurdo Station. Geographical Information Systems were used for analysis and visualization and standard statistical approaches used to determine cumulative probability distributions and other descriptive statistics. Geostatistics and spatial statistics were used to fully examine the spatial distribution of petroleum hydrocarbons in and around the station.
Experimentally-determined semivariograms were examined to determine the distances over which TPH concentrations appear correlated. Kriging was then employed to interpolate continuous surfaces of soil TPH concentrations across the station to visualize contamination patterns. Possible clustering of high TPH samples was also examined through two local spatial autocorrelation measures, Local Moran's I and the Getis-Ord Gi* statistic, which identify the level of spatial autocorrelation at a local scale. Analysis was accomplished using ArcGIS 9.2 and 9.3 and SPSS (originally, Statistical Package for the Social Sciences) versions 14 and 16.
Kriging
Experimental semivariograms, which measure the average dissimilarity between points separated by a distance x were constructed for total TPH and HMW compounds as follows:
where z represents the TPH concentrations sampled at n locations ui and N(h) is the number of data pairs separated by lag distance h (Goovaerts Reference Goovaerts1999). While anisotropy in the semivariograms was investigated, isotropic models were deemed appropriate for this application. To perform spatial interpolation, spherical theoretical models were fitted to the empirical semivariograms (Cressie Reference Cressie1993).
An understanding of infrastructure and operations at McMurdo Station combined with the visual analysis of the empirical semivariograms was used to determine the maximum lag distance considered in the semivariogram analysis. Because of the localized nature of fuel spillage at McMurdo Station only lag distances (h) of < 60 m were considered in developing the semivariogram model for total TPH concentrations, while only distances of < 120 m were considered in the construction of the semivariogram for the HMW TPH concentrations.
Kriging is a minimum-mean-squared error (often referred to as least-squares) method of spatial prediction (Cressie Reference Cressie1993, Goovaerts Reference Goovaerts1999). This geostatistical method is predicated on the notion of autocorrelation which posits that observations closer to the prediction point should be given more weight in the spatial prediction. Based on the theoretical semivariograms, ordinary kriging was used to produce predictive maps of TPH concentrations across the station. Maps indicating the probability of total TPH concentrations exceeding 30 ppm, which is taken as a very conservative indication of elevated TPH, were also produced.
The ordinary kriging model which assumes an unknown, but constant, mean was selected because the local bedrock is volcanic in nature and naturally occurring petroleum hydrocarbons are thought to be scarce at McMurdo Station. There is also no reason to assume that natural TPH concentrations would vary greatly across the station.
As the TPH concentrations were positively skewed, as is common with environmental geochemical distributions, log-normalization of TPH values (Zhang & Selinus Reference Zhang and Selinus1998) prior to kriging was necessary. As the unknown high molecular weight TPH compounds were undetected in many of the samples, the undetected HMW TPH concentrations were set to 0.0001 ppm prior to log-normalization to ensure they would be retained in the interpolation. While kriging was the selected interpolation method, several other interpolation methods (Inverse Distance Weighting, Radial Basis Functions) were attempted and produced similar TPH concentration surfaces. This is attributable to the high density of sampling points over much of McMurdo Station.
Global indicators of spatial association
In addition to visual analysis of maps and interpolated surfaces, Moran's I was used to determine if any statistically significant spatial clustering of high or low petroleum hydrocarbon concentrations occurred at McMurdo Station. Following confirmation of clustering, two additional spatial statistics, Local Moran's I and the Getis-Ord Gi* statistic were employed to examine the spatial clustering of high and low TPH and to identify local spatial clusters (hotspots) where TPH concentrations were locally elevated.
Moran's I is a global measure of spatial autocorrelation and uses both the location and value of a sample, in this study TPH concentrations, to determine if a spatial pattern is clustered, dispersed or is random. Moran's I is calculated as:
where xi and xj are the TPH concentrations of samples and W is the sum of all elements in the spatial weights matrix (w) which in this application is computed as 1/distance between the i and j observations and n is number of samples. The expected range of Moran's I is from -1 (extremely negative spatial autocorrelation) to 1 (extremely positive autocorrelation). It is possible to compute Z-scores for Moran's I and apply traditional criteria for statistical significance (Wong & Lee Reference Wong and Lee2005).
Local indicators of spatial association
Two indicators of local spatial association were also used. Aselin's Moran's Local I was computed. As opposed to Moran's I, a spatial autocorrelation value is computed for each individual observation as:
where δ is the standard deviation of x. A high value of Moran's I indicates clustering of similar values (either high or low), while low values indicates a clustering of dissimilar values. Similar to Moran's I, Z-scores and criteria for statistical significance can also be computed. High Z-scores indicate the TPH concentration is similar to surrounding values, while low Z-scores indicate a clustering of dissimilar values. Complete formulations of Moran's local I, including computation of Z-scores can be found in Anselin (Reference Anselin1995) and Wong & Lee (Reference Wong and Lee2005).
While identifying areas of similar TPH concentrations is important, it is also necessary to identify which areas have higher or lower TPH concentrations than would be expected by chance. Therefore, the Getis-Ord Gi* statistic which indicates the clustering of both high and low values was used (Getis & Ord Reference Getis and Ord1992, Wong & Lee Reference Wong and Lee2005). The Getis-Ord Gi* statistic is computed as follows:
As with the Moran's local I, Z-scores and P values of statistical significance are computed. High Z-scores indicate clustering of high values, while low Z-scores indicate a clustering of low values. The complete formulation of the Gi* statistic, including computation of Z-scores is described in Getis & Ord (Reference Getis and Ord1992).
Results
Station-wide hydrocarbons
While McMurdo Station has experienced over 50 years of continuous human occupation, overall concentrations of petroleum hydrocarbons in the soil are low. Figure 7 compares the cumulative histograms of both TPH and the HMW fraction of the McMurdo Station samples to samples collected at control sites in the Ross Sea region. In the following analysis a threshold of 30 ppm is taken to represent a significant concentration of TPH in soil (and is indicated by the vertical dashed line in Fig. 7). The threshold of 30 ppm was chosen since it represents three times the method detection limit (Chiang et al. Reference Chiang, Chang and Brown1997, and this study). It is important to note that this is a conservative action level. Current operational practices at McMurdo Station for remediation of fuel contaminated soils at McMurdo Station proscribe treatment of soil until measured TPH concentrations are decreased to 100 ppm at which point the soil is considered clean enough for reuse at the station (Raytheon Polar Services Company, Environmental Health and Safety, personal communication 2009).

Fig. 7 Cumulative histograms for total petroleum hydrocarbons (TPH) (dark) and high molecular weight (HMW) compounds (light) for all samples (solid) and for samples collected randomly across entire station (dashed). The thin dashed line represents TPH concentrations of samples collected at control sites.
There are multiple TPH patterns present at the station including LMW gasoline/JP5/AN8, residual weathered petroleum and HMW hydrocarbons. The samples with the LMW pattern are indicative of relatively freshly released petroleum since evaporative losses are rapid (Snape et al. Reference Snape, Ferguson, Harvey and Riddle2006). The HMW material contains a petroleum product with similar characteristics to sediment collected at a site in the vicinity of the Norfolk Naval Shipyard (Stout et al. Reference Stout, Leather and Corl2003). Stout et al. (Reference Stout, Leather and Corl2003) hypothesized this product was some sort of specialty grease, hydraulic oil or transformer oil. Soil TPH concentrations at McMurdo Station were found to range from 0.032–26 782 ppm. The HMW concentrations range from 0–12 384 ppm. However, 66% of the collected samples did not have a detectable HMW fraction (e.g. TPH > 10 ppm) whereas 70% of the samples had detectable LMW hydrocarbons.
As illustrated by the cumulative probability histograms in Fig. 7, the TPH concentrations in the samples are strongly positively skewed. Of samples that have been collected at McMurdo Station from 1999–2007, 38.5% have total TPH < 30 ppm, while 57.9% of all samples have TPH concentrations below 100 ppm. Because much of the sampling within McMurdo Station proper targets areas of known or suspected impact, these percentages overstate the overall concentrations of petroleum hydrocarbon contamination at the station. If only the 770 regional and random samples that were collected to represent overall conditions at the station are considered, only 27.7% (213 samples) have TPH concentrations at or above 30 ppm and only 11.3% (87 samples) have concentrations at or above 100 ppm.
The overall levels of soil contamination at McMurdo Station are compared to published ranges of soil TPH measured at other contaminated sites in the Antarctic and sub-Antarctic in Table II. While soil hydrocarbon contamination at McMurdo Station may be more spatially extensive compared to other sites, the soil TPH concentrations at McMurdo Station fall well within the range measured at other contaminated sites on the continent and sub-Antarctic islands.
Table II Summary of soil total petroleum hydrocarbons (TBH) concentrations from selected sites in Antarctica.

Not surprisingly, there is a strong correlation between the concentrations of HMW compounds and the total TPH in individual samples. The Pearson Correlation Coefficient shows log-normalized TPH and HMW to be highly correlated (r = 0.837) and the correlation statistically significant at the 0.01 level. However, as described below, the spatial patterns of HMW and TPH differ somewhat.
The continuous fields of TPH and the HMW component created through kriging make it possible to estimate the area of McMurdo Station contaminated with varying concentrations of soil TPH (Fig. 8). Of the 3.13 km2 of McMurdo Station that was within 100 m of a sampling location, in 0.842 km2 (26.9% of the area) TPH concentrations are expected to be 30 ppm or greater, while in 0.383 km2 (12.24% of the area) TPH concentrations are expected to be 100 ppm or greater. In a few locations (< 1% of the total area) the HMW component is expected to be 30 ppm or greater (0.023 km2) or 100 ppm or greater (0.007 km2).

Fig. 8 Cumulative histograms illustrating the area of McMurdo Station contaminated with varying hydrocarbon concentrations for both total petroleum hydrocarbons (TPH) and the high molecular weight (HMW) component.
In general no relationship was evident between soil TPH concentration and the depth to ice-cemented ground at time of sampling. At a limited number of sites where surface sampling revealed highly-elevated TPH, soil samples were collected at a number of depths to examine variations in TPH concentrations with depth. However, no consistent patterns of TPH concentration as a function of depth were discovered. At one site, TPH increased with depth, at another the TPH maximum concentration was at the surface. Based on these limited results, it appears unlikely that the spatial patterns described below would alter significantly if based on samples collected at depth in the soil rather than at the surface.
Spatial patterns
The processes that release petroleum hydrocarbons to the environment at McMurdo Station (predominately fuel leaks and spills) would be expected to create spatially patchy distributions characterized by relatively small patches of elevated TPH concentrations while much of the area would have low TPH concentrations. Semivariogram analysis was undertaken to examine the spatial scales over which TPH concentrations are correlated at McMurdo Station. The range distance determined through semivariogram analysis indicates the lag distance beyond which TPH concentrations are uncorrelated (Cressie Reference Cressie1993). To determine range distances for both total TPH and the HMW fractions, theoretical spherical semivariogram models were fitted to the empirical semivariograms (Fig. 9) from which the range was determined. Total TPH concentrations appear to become uncorrelated at lag distances greater than 38 m, while the lag distance at which the HMW fraction becomes uncorrelated is larger than 68 m.

Fig. 9 Empirical (circles) and theoretical (line) semivariograms for total petroleum hydrocarbons (upper) and high molecular weight hydrocarbons (lower).
Geostatistical surfaces of TPH (Fig. 10) and HMW hydrocarbons (Fig. 11) were created using kriging. The overall spatial pattern of TPH concentrations is as anticipated at an Antarctic station with over 50 years of continuous operations. Areas outside of the station proper are typically characterized by low (under 30 ppm) TPH concentrations while areas more heavily impacted by operations have much higher concentrations.

Fig. 10 Concentration (in parts per million) of total petroleum hydrocarbons in McMurdo Station soils. Quickbird image, copyright DigitalGlobe Inc.
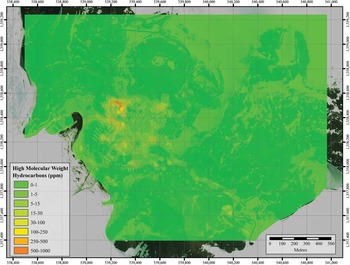
Fig. 11 Concentration (in parts per million) of the high molecular weight component of total petroluem hydrocarbons at McMurdo Station. Quickbird image, copyright DigitalGlobe Inc.
Total petroleum hydrocarbons
The highest soil TPH concentrations, represented in Fig. 10 by TPH concentrations in excess of 500 ppm, are found at expected locations. Total petroleum hydrocarbons hotspots can be identified across the station where historic and/or current operations can lead to fuel spillage. As illustrated in Fig. 10, elevated TPH concentrations are at the helicopter landing pad (a), the former heavy vehicle maintenance shop (b), the current vehicle refuelling station and bulk storage tanks (c), the current heavy vehicle maintenance facility (d), and the hazardous waste yard (e). High TPH concentrations are also evident in surface soil samples from the former Fortress Rocks landfill (f). Some of the Fortress Rocks samples may be of contaminated soil gathered from other impacted areas of the station which were stored awaiting remediation prior to reuse. Three locations above Winter Quarters Bay (near ‘g’ in Fig. 10), former sites of bulk fuel tanks, also have elevated TPH concentrations. Other areas of elevated TPH concentrations within McMurdo Station occur in areas of high vehicular traffic and where vehicles are parked and/or stored.
Some areas outside of the station proper also have soil TPH concentrations that exceed 30 ppm. The Scott Base road exhibits elevated TPH concentrations. The area to the east of Observation Hill that in the past served as a location for dumping snow cleared from the station also had TPH concentrations in excess of 100 ppm. Areas on the western slope of Observation Hill adjacent and downhill of existing structures and the former nuclear reactor site are also elevated in TPH. Areas surrounding the road to and at the T-site to the east of McMurdo Station also have TPH concentrations above 30 ppm. However, here the spatial sampling is less dense and the resulting kriged surface is less controlled.
High molecular weight compounds
The kriged surface of the HMW hydrocarbons is shown in Fig. 11. The most striking aspect of the HMW pattern is, unlike TPH, HMW concentrations near former or existing fuel tanks are low. This suggests these compounds are not associated with the main fuels used in the USAP over its history. Likewise, except for a small area of the helicopter pad where HMW concentrations are between 100 and 250 ppm, the ratio of HMW/total TPH is lower than anticipated. Therefore these HMW compounds do not appear related to helicopter operations.
The second most prominent feature in the HMW geostatistical surface is elevated HMW concentrations around the northern portion of the current heavy vehicle maintenance facility. This is similar to TPH. Other areas of McMurdo Station where elevated HMW is most likely to occur are where vehicles travel or are parked, as well as the hazardous waste yard. Therefore it seems probable that the HMW component is associated with the cumulative effects of fluid leakage from vehicles.
Hotspot analysis
While the geostatistical surfaces illustrate the spatial footprint of petroleum hydrocarbon contamination at the station, it is useful to examine whether the local indicators of spatial association indicate statistically significant clustering of high and low TPH concentrations at McMurdo Station. These techniques also indicate the presence and location of TPH hot spots. Not surprisingly, Moran's I indicates that for both TPH and the HMW fraction across McMurdo Station, spatial clustering of similar concentrations is statistically significant at the 0.01 level.
Over most of the study area, Z-scores from the local version of Moran's I exceed 1.96 and thus indicate a statistically significant clustering of similar log-normalized TPH concentrations at the 0.05 level. Of the 2490 collected samples, 943 indicate a statistically significant clustering of high TPH concentrations. With few exceptions, all these samples fall within the confines of McMurdo Station where operations are actively ongoing. In three main areas, the helicopter landing pad, around the vehicle maintenance facility and in the hazardous waste yard, Moran's local I indicates a clustering of similar high values. Likewise, with very few exceptions, the 457 samples with statistically significant clustering of similarly low TPH concentrations are found at the periphery of the study area, where station operations are less intensive.
The local version of Moran's I also allows investigation of where dissimilar samples cluster. A fair number (278) of the collected samples were lower than the surrounding samples. These lower than expected samples are again found within the areas of McMurdo Station with ongoing activity. Only 34 samples were identified as being statistically significantly higher than the surrounding samples. These samples are primarily located at the site of the former Fortress Rocks landfill, in the eastern portion of ‘the Gap’, snow dump and at the T-site. These are thought to indicate isolated sampling of small patches of elevated TPH.
One of the objectives of environmental monitoring at McMurdo Station is to identify areas with high levels of environmental contaminants. Examination of Z-scores patterns of the Getis-Ord Gi* statistic provides such information. In this statistic, positive Z-scores (and high P values) indicate a spatial clustering of high TPH concentrations while low negative Z-scores indicated a clustering of low TPH concentrations. The higher or lower the Z-score, the more intense is the spatial clustering. If a wide 500 m radius is considered in computing the Getis-Ord Gi*, then the entire central McMurdo Station exhibit statistically significant positive Z-scores.
To detect smaller ‘hot spots’, it is necessary to restrict calculation of the Gi* statistic to only samples within a 100 m radius of each other. Figure 12 illustrates this statistic for log-normalized TPH concentrations using an inverse-distance weighting in the calculation of the Gi* statistic. Three TPH hotspots are identified: 1) the helicopter landing pad, 2) an area including the current refuelling station and the heavy vehicle maintenance facility, and 3) a portion of the hazardous waste yard. Outside of these three areas, only a few isolated samples are identified as hot spots. Decreasing by half the radius in which the clustering analysis is performed does not identify additional hotspots.

Fig. 12 Z-scores for the Getis-Ord G*i statistic. Quickbird image, copyright DigitalGlobe Inc.
Discussion
The surface soil sampling programme conducted at McMurdo Station from 1999–2001 and 2003–07 is the most comprehensive assessment of petroleum hydrocarbon contamination at an Antarctic base to date. The study confirms that fuel spills represent a major environmental contaminant near Antarctic bases (Bargagli Reference Bargagli2005, Bargagli Reference Bargagli2008, Tin et al. Reference Tin, Fleming, Hughes, Ainley, Convey, Moreno, Pfeiffer, Scott and Snape2009) and supports the spatial patterns of petroleum hydrocarbons mapped previously at McMurdo Station by Chiang et al. (Reference Chiang, Chang and Brown1997).
However, the extensive sampling done in this study provides a much more detailed characterization of patterns of petroleum hydrocarbon contamination in and near an Antarctic scientific station. Geostatistical analyses were used to map and analyse two different types of petroleum hydrocarbons at the largest scientific station in Antarctica. More importantly, the extensive sampling confirms that elevated TPH concentrations at McMurdo Station are found where historic or ongoing operations were expected to have produced accidental fuel releases.
Examination of nearly 2500 chromatograms reveals that petroleum hydrocarbon contamination in local McMurdo Station soils are characterized by a complex mixture of compounds. The observed TPH patterns include a LMW signature, residual weathered petroleum and a HMW signature. Figure 6 shows a typical TPH chromatogram.
The spatial patterns of the total TPH and the HMW fraction are similar, but not identical, as revealed using kriging to map the spatial patterns of TPH and HMW (Figs 10 & 11). The HMW compounds appear to be spatially restricted to areas that historically have had vehicle traffic or fleet operations. This suggests they may be related to the station's vehicle fleet or these compounds could have been intentionally spread on roads as a dust control measure. However, the only known potential dust control measure used within the past 30 years was dispersal of residual brine resulting from desalinization which was spread on the roads and also served as a de-icing agent (Rob Robbins, personal communication 2010).
Spatial analysis, including geostatistics and the local indicators of spatial association were useful in delineating spatial patterns of elevated TPH and in identifying areas with locally elevated soil TPH. If the entire ice-free area at the tip of Hut Point Peninsula is considered, areas at the centre of historic, and ongoing, USAP activities are elevated in TPH concentrations relative to peripheral areas (Figs 10 & 11). While most peripheral areas have experienced some physical disturbance of the surface in the past (Klein et al. Reference Klein, Kennicutt II, Wolff, Sweet, Bloxom, Gielstra and Cleckley2008), over much of McMurdo Station's periphery total TPH concentrations are low, with concentrations typically < 15 ppm. One outlying area with slightly higher than expected TPH concentrations is the east-facing slope leading down from the T-site toward Scott Base where some areas have TPH concentrations over 30 ppm. Other areas outside of McMurdo Station with elevated TPH concentrations occur along roads and in other areas of known impact such as the snow dump. Elevated metal fuel pipelines currently run alongside the McMurdo Station–Scott Base road and its extension to Hut Point. These pipelines replaced flexible tubing used along the same routes in the past and both have experienced occasional leakages.
Spatial analysis also reveals that at finer spatial scales within McMurdo Station itself, soil TPH concentrations are higher, but patchy. Several areas with TPH concentrations in excess of 2500 ppm exist but are located in close proximity to historical station operations associated with fuel usage. Areas of elevated TPH concentrations include the helicopter landing pad, areas of former fuel storage tanks, the refuelling station and areas where vehicles traffic and park (Fig. 10). The Getis-Ord Gi* statistic indicated three areas with a statistically significant clustering of high TPH concentrations: the helicopter landing pad, an area running east–west from previous fuel tank locations above Winter Quarters Bay to the existing vehicle maintenance facility and a small area at the hazardous waste facility (Fig. 12). It is important to reiterate that these analyses indicate that elevated soil TPH concentrations at McMurdo Station are of limited spatial extent and are located where expected, namely those areas where current or historic operations involved fuel handling or opportunities for spillage or leakage from storage or vehicles.
Geostatistics, including analysis of semivariograms of total TPH concentrations (Fig. 9) indicate the variable and patchy nature of TPH concentrations at McMurdo Station. At distances > 35–40 m there is little correlation in measured soil TPH concentrations. This is consistent with the observations of operations and contamination observed over the nine field seasons. Seldom does a specific activity at McMurdo Station encompass an area larger than 25–50 m. Thus, areas of elevated TPH concentrations would be expected to be confined to small areas. At McMurdo Station one operational activity often blends into another over spatial scales of 10–20 m. For example, the cargo storage yards, which are the largest area of activity at McMurdo Station and cover an area several hundred metres on a side, are currently segmented into smaller regions by roads, above ground piping and drainage ditches. If samples located 35 m apart can reasonably be assumed to be independent, then the 25 m hexagon grid used in the current environmental monitoring programme is appropriate.
As stated by Tin et al. (Reference Tin, Fleming, Hughes, Ainley, Convey, Moreno, Pfeiffer, Scott and Snape2009), “Environmental monitoring and targeted research are urgently needed to inform management decisions”. Knowledge of the spatial distribution of TPH contamination at McMurdo Station suggests that future activities should be concentrated in previously impacted areas if the goal is to maintain or reduce the station's “footprint”. In the context of environmental remediation in Antarctica, Aislabie et al. (Reference Aislabie, Balks, Foght and Waterhouse2004) noted that “Managers need relatively simple decision tools, underpinned by good science that will allow them to make quick decisions and to implement appropriate responses”. The TPH maps produced as part of this study assist in fulfilling this need.
The success of geostatistics in mapping the spatial patterns of TPH concentrations at McMurdo Station demonstrates that it is a valuable tool for presenting environmental information in a form that station managers can use for planning future operations. Figure 13 uses indicator kriging to map the probability that TPH concentrations at a location will exceed 30 ppm. This level was selected as a conservative measure of areas where TPH concentrations could potentially be of concern. The map clearly delinates where operations that might create additional petroleum hydrocarbons contamination should be located to prevent expansion of TPH contamination beyond its current boundaries.

Fig. 13 Map illustrating the probability that TPH concentrations exceed 30 ppm. Overlaid on the probability map are proportional circles indicating the location and volume (liters) of fuel releases at McMurdo from 1992–2004 (information courtesy of Ratheon Polar Services Company). Quickbird image, copyright DigitalGlobe Inc.
Proportional circles illustrating the volume of accidental fuel releases from 1992–2004 are also shown in Fig. 13. From the spills recorded during this 12 year period, it appears that impact of current operations is mainly in areas of previous elevated soil TPH concentrations.
As stated in Kennicutt et al. (Reference Kennicutt II, Klein, Montagna, Sweet, Wade, Palmer, Sericano and Denoux2010), it is difficult to determine the TPH concentrations that would be expected to elicit a biological response and few studies have focused on the biological responses to contaminants in Antarctica. However, most samples collected at McMurdo Station have soil TPH concentrations below 1000 ppm and minimal biological effects are expected. In addition, much of the measured petroleum hydrocarbon contamination at McMurdo Station is historic. Recent operational practices emphasize much safer fuel handling than in the past and limiting current operations where fuel spills can occur to those areas already impacted will help mitigate increases in McMurdo Station's “footprint” in terms of soil petroleum hydrocarbons.
Over the past decade, a number of studies have improved the scientific knowledge base about the spatial extent of hydrocarbons in Antarctic soils as well as their physical and biological impacts. As understanding of hydrocarbons and their impacts in Antarctic soil improves so too should our ability to reduce the impacts of hydrocarbons and successfully remediate impacted soils. This study answers fundamental questions about the spatial extent and patterns of hydrocarbons at one of the most heavily utilized sites in Antarctica. Sampling is continuing as part of a long-term environmental monitoring programme which will enable documentation of future changes in the spatial “footprint” of petroleum hydrocarbons at McMurdo Station, Antarctica. For over a decade, standardization of Antarctic environmental monitoring programmes has been encouraged and in recent years broader international implementation has occurred. The methods applied here to study hydrocarbon at McMurdo Station could be extended to other Antarctic stations.
Acknowledgements
Financial support for this study was provided by the National Science Foundation's Office of Polar Programs Grant Numbers: OPP-0354573, and OPP-9909445. Contract support was provided by DOD – Army Corp of Engineers Cold Regions Research & Engineering Laboratory Contract Numbers: W913E5-05-C-00002 (Phase 1), W913E5-06-C-0009 (Phase 2), W913E5-07-C-0005 (Phase 3), and W913E5-08-C-0008 (Phase 4). The authors are indebted to the large number of individuals who have helped collect soil samples over the years including: Dianna Gielstra, John Hinton, Guy Denoux, Sally Morehead, Kristi Jones, Terrence Palmer, April Gossman, Marietta Cleckley, Larry Hyde, Ann Linsley and Jennifer Pollack. The authors also wish to thank Raytheon Polar Services Environmental Health and Safety personnel, including Cindy Dean. The constructive comments of the reviewers are also gratefully acknowledged.


