Introduction
Antarctica hosts some of the most pristine environments on Earth, as well as experiencing some of the planet's most extreme conditions (Convey et al. Reference Convey, Chown, Clarke, Barnes, Bokhorst and Cummings2014). Such extreme conditions act as environmental filters (Gonçalves et al. Reference Gonçalves, Vaz, Rosa and Rosa2012). Antarctic lakes are an example of one such extreme environment, often being shallow (< 10 m deep) and typically cold, highly transparent (allowing penetration of high levels of solar radiation) and, in many cases, oligotrophic (Butler et al. Reference Butler, Edworthy and Ellis-Evans2000, Ogaki et al. Reference Ogaki, Vieira, Lírio, Rosa, Rosa and Rosa2019).
Lakes in the climatically less extreme Maritime Antarctic region usually host more complex communities than those of the continental Antarctic and often contain more abundant microcrustacean populations (Butler et al. Reference Butler, Edworthy and Ellis-Evans2000). Typically, continental Antarctic lakes are dominated by photosynthetic and heterotrophic protozoa and a limited number of algae, fungi, bacteria and viruses. Antarctic lakes have a trophic structure that is simple when compared with those of lower latitudes, and energy and nutrient flows are generally dominated by the microbial loop (Laybourn-Parry & Pearce Reference Laybourn-Parry and Pearce2007). Lakes of the Maritime Antarctic islands, as exemplified by studies on Signy Island (South Orkney Islands; Butler et al. Reference Butler, Edworthy and Ellis-Evans2000), have more diverse communities, but even in these metazoan diversity is low (Laybourn-Parry & Pearce Reference Laybourn-Parry and Pearce2007).
Coastal shallow lakes in the Maritime Antarctic may be subject to eutrophication through the activities of marine vertebrates (e.g. seals and penguins), leading to increased biomass (Izaguirre et al. Reference Izaguirre, Allende and Schiaffino2020). Algal diversity is lower than in other parts of the world, although, as is often the case in studies of other microbial groups, the recent application of molecular approaches is starting to reveal higher levels of biodiversity than previously recognized based on traditional morphological techniques (Izaguirre et al. Reference Izaguirre, Allende and Schiaffino2020). Protozooplankton or metazooplankton are the top predators in Antarctic lakes (Laybourn-Parry & Pearce Reference Laybourn-Parry and Pearce2007). Lacustrine protozooplankton comprise heterotrophic flagellates and ciliates (Izaguirre et al. Reference Izaguirre, Allende and Schiaffino2020). Representatives of these groups belonging to the genera Brachionus, Halteria, Notholca, Keratella, Lepadella, Hartmannella, Vannella and Vexillifera have been reported in the freshwater zooplankton of the Antarctic Peninsula, South Shetland Islands and South Orkney Islands (Butler et al. Reference Butler, Edworthy and Ellis-Evans2000, Hansson et al. Reference Hansson, Hylander, Dartnall, Lidstrom and Svensson2012). Periphyton, which can be defined as a mixture of autotrophic and heterotrophic organisms embedded in an organic matrix (Peter & Lodge Reference Peters, Lodge and Likens2009), is usually poorly studied overall (Hansson Reference Hansson1992), and very few studies to date have focused on periphyton communities (Wood et al. Reference Wood, Kuhajek, De Winton and Phillips2012), especially in Antarctic lakes (Hansson Reference Hansson1992, Pizarro et al. 2002). The absence of substrata such as macrophytes, where periphyton can attach, combined with the typically low nutrient availability make such studies more challenging (Hansson Reference Hansson1992). Jungblut et al. (Reference Jungblut, Hawes, Mountfort, Hitzfeld, Dietrich, Burns and Neilan2005) studied periphytic cyanobacteria in ponds in the Victoria Land Dry Valleys, and Pizzaro et al. (2002) used artificial baits to investigate periphytic algal communities in the lakes in Hope Bay.
Assessment of microbial diversity in Antarctic lakes has, until recently, relied largely on traditional microbiological culture approaches or direct observation (Izaguirre et al. Reference Izaguirre, Allende and Tell2006, Gonçalves et al. Reference Gonçalves, Vaz, Rosa and Rosa2012, Ogaki et al. Reference Ogaki, Vieira, Muniz, Zani, Alves and Junior2020). However, under extreme environmental conditions, many microbes can display considerable morphological variation (Huss et al. Reference Huss, Frank, Hartmann and Hirmer1999), hampering identification. These traditional approaches also cannot reliably detect quiescent forms (Ruppert et al. Reference Ruppert, Kline and Rahman2019).
Recent advances in molecular biology have provided important new tools for assessing microbial biodiversity. The use of DNA metabarcoding approaches provides an effective method for the detection of rare species (Ruppert et al. Reference Ruppert, Kline and Rahman2019, Câmara et al. Reference Câmara, Carvalho-Silva, Pinto, Amorim, Henriques and Silva2020). However, as yet, few studies have applied metabarcoding approaches in studies of Antarctic ecosystems (but see Fraser et al. Reference Fraser, Connell, Lee and Cary2018, Câmara et al. Reference Câmara, Carvalho-Silva, Pinto, Amorim, Henriques and Silva2020, Garrido-Benavent et al. Reference Garrido-Benavent, Pérez-Ortega, Durán, Ascaso, Pointing and Rodríguez-Cielos2020, Rosa et al. Reference Rosa, Da Silva, Ogaki, Pinto, Stech and Convey2020, Ogaki et al. Reference Ogaki, Pinto, Vieira, Neto, Convey and Carvalho-Silva2021). Rippin et al. (Reference Rippin, Borchhardt, Williams, Colesie, Jung and Büdel2018) reported that this approach revealed ~11 times greater richness than a traditional morphological approach in a study on Livingston Island, South Shetland Islands. Fraser et al. (Reference Fraser, Connell, Lee and Cary2018) used metabarcoding to investigate the molecular diversity of soils in Victoria Land. Garrido-Benavent et al. (Reference Garrido-Benavent, Pérez-Ortega, Durán, Ascaso, Pointing and Rodríguez-Cielos2020), in another study on Livingston Island, investigated the successional patterns of microorganisms, while Câmara et al. (Reference Câmara, Carvalho-Silva, Pinto, Amorim, Henriques and Silva2020) used metabarcoding to investigate Chlorophyta diversity in soil samples from two sites on Deception Island. In the current study, we used DNA metabarcoding and scanning electron microscopy (SEM) to assess the diversity of periphyton communities present in two lakes in the South Shetland Islands.
Materials and methods
Study sites and sampling
Sample collection followed the procedures described by de Souza et al. (Reference de Souza, Ogaki, Câmara, Pinto, Convey and Carvalho-Silva2021). The two lakes sampled in this study during the summer (December 2016) were Soto Lake located on Deception Island (62°58′52.0″S, 60°39′52.9″W) and Hennequin Lake located on King George Island (62°07′22.9″S, 58°23′46.1″W) (Fig. 1). Both islands are located in the South Shetland Islands, Maritime Antarctic.

Fig. 1. a.–d. Satellite images (obtained in Google Earth Pro, 2019) and the sites where the cotton baits were sampled. a. Antarctic continent with the Antarctic Peninsula inside the red rectangle. b. Antarctic Peninsula with the South Shetland Islands archipelago; red rectangles represent King George Island (b1) and Deception Island (b2). c. King George Island and d. Deception Island, with Hennequin Point and Soto Lake indicated, respectively, within each red rectangle. e. Hennequin Lake (62°07′22.9″S, 58°23′46.1″W) and f. Soto Lake (62°58′52.0″S, 60°39′52.9″W). Pictures taken by the authors (L.H. Rosa and P.E.A.S. Câmara).
Three nylon bags (6 × 6 cm), each containing 20 cm of sterilized cellulose baits (thick cotton strings), were placed at two sites at least 20 m apart in both Hennequin Lake and Soto Lake on 1 and 10 December 2016, respectively (a total of six bags per lake). The bags were fixed by a rope attached to the lake margin; this allowed the bag to freely float on the water column up to 2 m deep (de Souza et al. Reference de Souza, Ogaki, Câmara, Pinto, Convey and Carvalho-Silva2021). The baits remained suspended in the water column for two years, providing matrices for colonization by freshwater organisms. In the summer of 2018/2019, all baits were collected and placed into individual sterilized Whirl-Pak bags (Sigma-Aldrich, USA), which were sealed and kept at -20°C in a sterilized box until transportation to the laboratory at the Federal University of Minas Gerais, Brazil. There, the three samples from each lake were processed to extract the total DNA. The physical and chemical parameters (temperature, conductivity and pH) of each lake were measured at each site when the baits were deployed using a Hanna HI 9828 multi-parameter probe (Hanna Instruments, USA).
DNA extraction, amplification and sequencing
The three cotton baits from each point within a lake (segments of 1 cm in length from each deployment site point) were processed together in the same DNA extraction in order to increase DNA yield, resulting in a total of two DNA samples for each lake (four in total; see also de Souza et al. Reference de Souza, Ogaki, Câmara, Pinto, Convey and Carvalho-Silva2021). Total DNA was extracted from environmental samples using the QIAGEN DNeasy PowerLyzer PowerSoil Kit, following the manufacturer's instructions. Extracted DNA was used as a template for generating polymerase chain reaction (PCR) amplicons. The internal transcribed spacer 2 (ITS2) of the nuclear ribosomal DNA was used as a DNA barcode for molecular species identification (Chen et al. Reference Chen, Yao, Han, Liu, Song and Shi2010, Richardson et al. Reference Richardson, Lin, Sponsler, Quijia, Goodell and Johnson2015). ITS2 has been widely used in barcoding studies of many organisms (Ruppert et al. Reference Ruppert, Kline and Rahman2009) and has proved effective in recent studies of Antarctic diversity (Câmara et al. Reference Câmara, Carvalho-Silva, Pinto, Amorim, Henriques and Silva2020, Rosa et al. Reference Rosa, Da Silva, Ogaki, Pinto, Stech and Convey2020, Ogaki et al. Reference Ogaki, Pinto, Vieira, Neto, Convey and Carvalho-Silva2021). PCR amplicons were generated using the universal primers ITS3 and ITS4 (White et al. Reference White, Bruns, Lee, Taylor, Innis, Gelfand, Sninsky and White1990) and were sequenced by high-throughput sequencing (HTS) at Macrogen, Inc. (South Korea) on an Illumina MiSeq sequencer (3 × 300 bp) using the MiSeq Reagent Kit v3 (600-cycle) following the manufacturer's protocol.
Data analyses and taxa identification
Two databases were used in the identification of the amplicon sequences obtained: the PLANiTS2 database for Viridiplantae (Banchi et al. Reference Banchi, Ametrano, Greco, Stanković, Muggia and Pallavicini2020) and the UNITE eukaryote ITS database version 8.2 (Abarenkov et al. Reference Abarenkov, Zirk, Piirmann, Pöhönen, Ivanov, Nilsson and Kõljalg2020) for all eukaryote groups. Raw fastq files were filtered using BBDuk version 38.34 (BBMap; https://sourceforge.net/projects/bbmap/) to remove Illumina adapters, known Illumina artefacts and the PhiX Control v3 Library. Quality read filtering was carried out using Sickle version 1.33-q 30-l 50 (https://github.com/najoshi/sickle) to trim 3' or 5' ends with low Phred quality score, and sequences < 50 bp were also discarded. The remaining sequences were imported into QIIME2 version 2019.10 (https://qiime2.org/) for bioinformatics analyses (Bolyen et al. Reference Bolyen, Rideout, Dillon, Bokulich, Abnet, Al-ghalith and Alexander2019).
The qiime2-dada2 plugin is a complete pipeline that was used for filtering, de-replication, turn paired-end fastq files into merged and to remove chimeras (Callahan et al. Reference Callahan, McMurdie, Rosen, Han, Johnson and Holmes2016). It is important to note that the ranking and correct identification of taxa rely heavily on the quality and reliability of the consulted databases, so the taxonomic assignments were determined for amplicon sequence variants (ASVs) using the qiime2-feature-classifier (Bokulich et al. Reference Bokulich, Kaehler, Rideout, Dillon, Boylern and Knight2018) classify-sklearn against the UNITE ITS database version 8.2 (Abarenkov et al. Reference Abarenkov, Zirk, Piirmann, Pöhönen, Ivanov, Nilsson and Kõljalg2020) and trained with a naïve Bayes classifier with a confidence threshold of 98.5%. For assessing the obtained sequence data against the PLANiTS2 database, the pipeline was executed for merged pair-ended sequences with the following plug-ins: vsearch join-pairs (Rognes et al. Reference Rognes, Flouri, Nichols, Quince and Mahé2016), vsearch dereplicate-sequences, quality-filter q-score-joined (Bokulich et al. Reference Bokulich, Subramanian, Faith, Gevers, Gordon and Knight2013), vsearch cluster-features-de-novo 97% identity limit and vsearch uchime-denovo. Taxonomic assignments were determined for operational taxonomic units (OTUs) using the feature classifier (Bokulich et al. Reference Bokulich, Kaehler, Rideout, Dillon, Boylern and Knight2018) classify-sklearn against the PLANiTS2 database (Banchi et al. Reference Banchi, Ametrano, Greco, Stanković, Muggia and Pallavicini2020) trained with a naïve Bayes classifier. As the two analyses differ in generating ASV and OTU outputs, for simplicity both are referred to as ‘taxa’ in the following text.
Many factors, including extraction, PCR and primer bias, can affect the number of reads obtained (Medinger et al. Reference Medinger, Nolte, Pandey, Jost, Ottenwalder, Schlotterer and Boenigk2010) and thus lead to misinterpretation of absolute abundance (Weber & Pawlowski Reference Weber and Pawlowski2013). However, Giner et al. (Reference Giner, Forn, Romac, Logares and Massana2016) concluded that such biases did not affect the proportionality between reads and cell abundance, implying that more reads are linked with higher abundance (Deiner et al. Reference Deiner, Bik, Mächler, Seymour, Lacoursière-Roussel and Altermatt2017, Hering et al. Reference Hering, Borja, Jones, Pont, Boets and Bouchez2018). Therefore, for comparative purposes we used the number of reads as a proxy for relative abundance.
Ecological diversity analysis
The following diversity statistics were calculated to assess α diversity: Fisher's α, Shannon, Margalef, Simpson and evenness. We also performed a diversity t-test for comparison of the Shannon and Simpson diversities in both lakes. All indices were calculated using PAST 3.26 (Hammer et al. Reference Hammer, Harper and Ryan2001). Venn diagrams were prepared as described by Bardou et al. (Reference Bardou, Mariette, Escudié, Djemiel and Klopp2014). Rarefaction calculations were carried out using the rarefaction analysis command in the software MOTHUR, where we clustered sequences into OTUs by setting a 0.03 distance limit. Algal distribution is based on AlgaeBase (http://www.algaebase.org). Classification follows Leliaert et al. (Reference Leliaert, Smith, Moreau, Herron, Verbruggen, Delwiche and De Clerck2012) for Viridiplantae and Cavalier-Smith (Reference Cavalier-Smith2007) for Chromista, Protista and Metazoa.
Scanning electron microscopy
For SEM, subsamples of the cotton baits were fixed in 2% glutaraldehyde in 0.1 M NaPO4 buffer and washed in buffered 1% OsO4 for 2 h. The material was dehydrated using a graded ethanol series (10%, 25%, 40%, 60%, 75%, 85%, 95% and 100%) for 15 min per concentration. The material was dried in a critical point drying apparatus, sputter-coated with gold and viewed with a Quanta 200 SEM (FEI, USA).
Results
Taxonomy and diversity
The calculated rarefaction curves indicate that the sampling effort was sufficient to represent the species analysed in the two sampled lakes (Fig. 2). In total, 991,102 paired-end sequencing reads were recovered, of which 370,406 reads remained after filtering. The Eukaryota UNITE analyses identified a total of 11 taxa and the Viridiplantae PLANiTS2 analyses identified a total of 35 taxa (Table I).
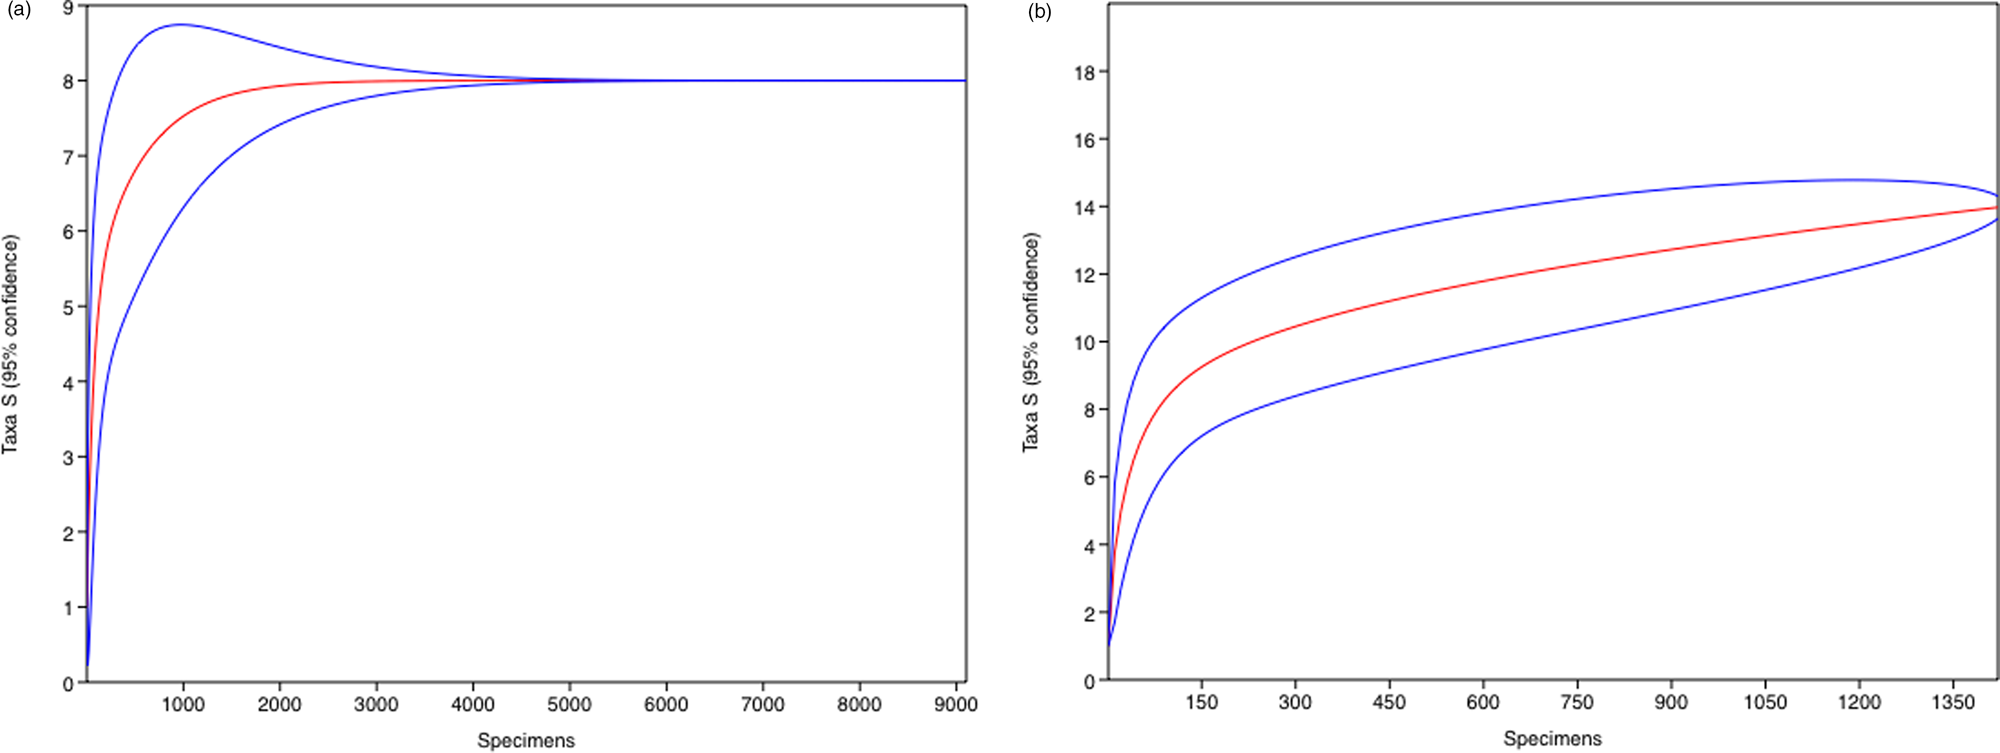
Fig. 2. Rarefaction curves based on taxa profile (0.03 similarity) from Hennequin Lake (left) and Soto Lake (right). Blue lines represent 95% confidence limits.
Table I. Taxa present in Hennequin Lake and Soto Lake as indicated by sequence data obtained. Geographical distribution: A = Antarctica, Ae = Antarctic endemic, Ar = Arctic, As = Asia, Au = Australia, B = bipolar, C = China, E = Europe, I = India, NZ = New Zealand, SA = South America, W = cosmopolitan. Habitat: A = aerial, C = chasmoendolithic, F = freshwater, M = marine, NA = North America, S = snow, T = terrestrial, U = ubiquitous. Taxa at the genus level may be missing habitat or geographical distribution data. Metazoa are based on the UNITE database and Viridiplantae on the PLANiTS2 database.
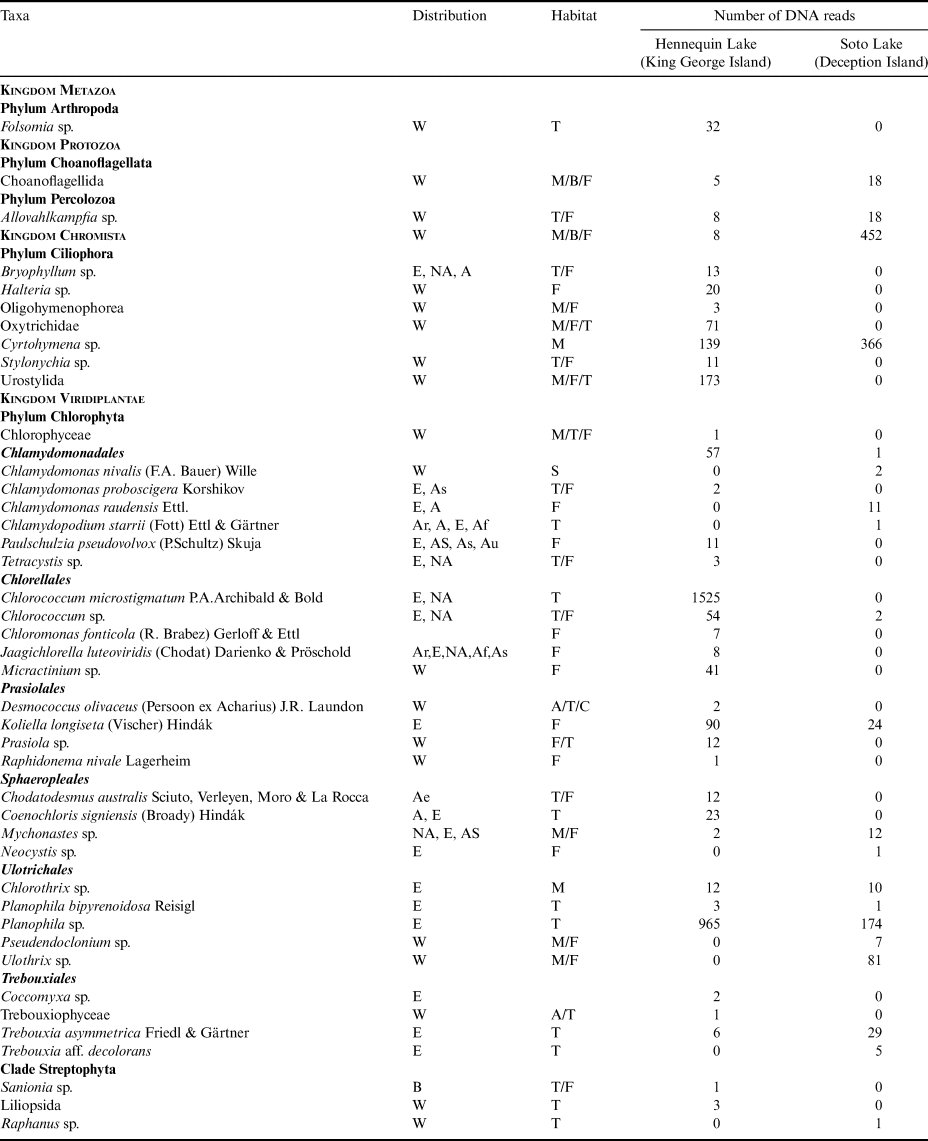
DNA sequences representing 44 distinct taxa were detected in the samples from four kingdoms (Metazoa, Protozoa, Chromista and Viridiplantae) and six phyla (Arthropoda, Choanoflagellata, Ciliophora, Percolozoa, Chlorophyta and Streptophyta). A total of 36 taxa were detected in Hennequin Lake and 20 taxa were detected in Soto Lake, with 12 taxa being present in both lakes (Fig. 3). The highest diversity was represented by Chlorophyta (green algae) with 30 taxa, followed by Ciliophora, with seven taxa. Using reads as a proxy for abundance, the most abundant were Chlorococcum microstigmatum and Planophila sp. (Chlorophyta). Among the ciliates, Cyrtohymena sp. was the most abundant. The SEM images (Fig. 4) obtained from Soto Lake baits clearly show the characteristic silica shells of diatoms (Bacillariophyta). The SEM images are consistent with genera such as Gomphonema sp. and Synedra sp., which are both common and cosmopolitan taxa.

Fig. 3. Venn diagram of taxa that are unique or shared between Hennequin Lake (green) and Soto Lake (blue).
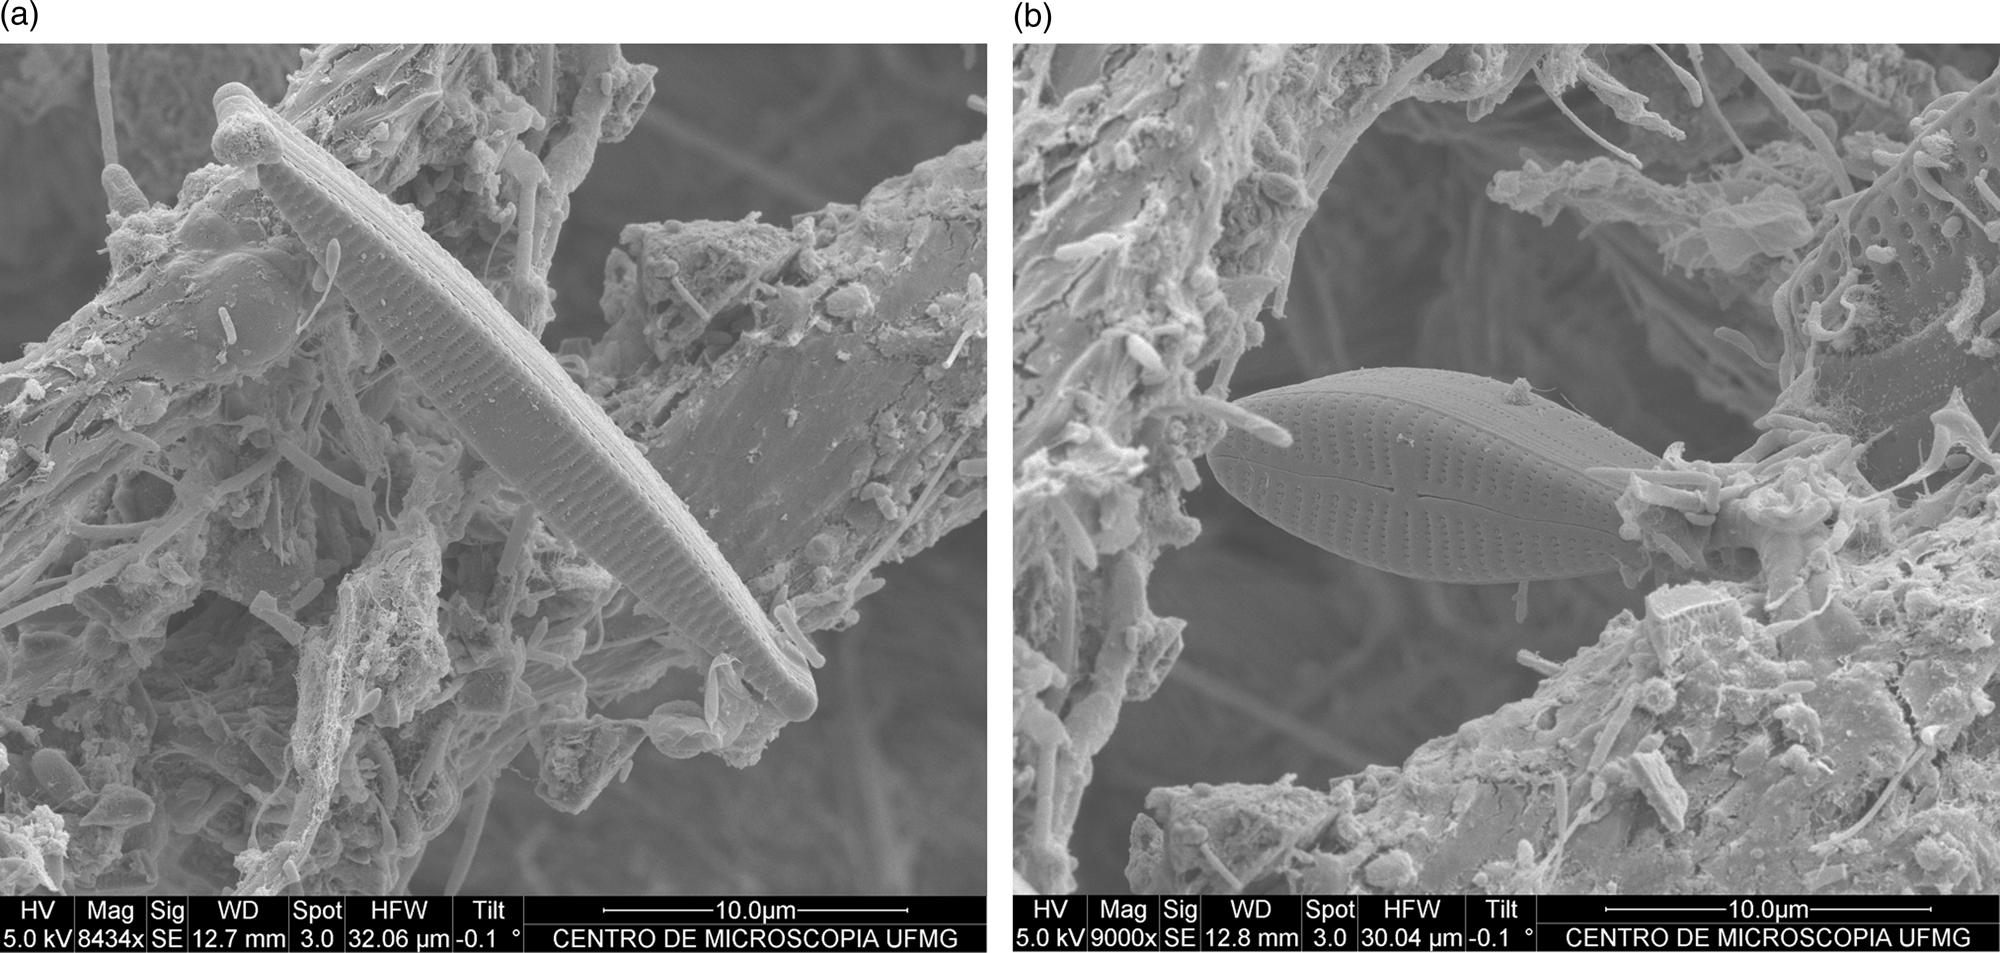
Fig. 4. Scanning electron micrographs showing the diatoms Synedra sp. (left) and Gomphonema sp. (right) attached to cotton baits obtained from Soto Lake, Deception Island.
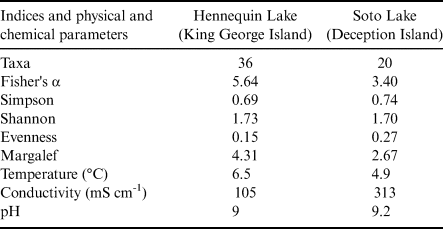
The α diversity indices are presented in Table II. The diversity t-test for the Shannon and Simpson indices were not significant, indicating no statistical differences in species compositions between the two assemblages.
Table II. Diversity indices of assemblages from Hennequin Lake and Soto Lake and physical and chemical lake parameters.

Discussion
Reported algal diversity in Antarctic lakes includes chlorophytes, chrysophytes, cryptophytes, diatoms, dinoflagellates and prokaryotic cyanobacteria (Mataloni & Pose Reference Mataloni and Pose2001, Lizotte 2008, Izaguirre et al. Reference Izaguirre, Allende and Schiaffino2020). Algal diversity in these lakes illustrates the influence of the surrounding environment, such as in the presence of Raphidonema spp. blooms that derive from melting snowfields. Aerophilic taxa such as Prasiola crispa (Lightfoot) Kützing, 1943, which can show macroscopic growth in the margins of eutrophic water bodies, could also be present in lake samples in this region.
The sampled lakes differ in many features, including depth, water temperature and proximity of surrounding vegetation. Hennequin Lake is a shallower lake and is slightly warmer, as well as being surrounded by vegetation. Based on the sequence data obtained, it hosts greater diversity than Soto Lake, which is a much deeper and colder lake with much more limited vegetation in its catchment.
The only sequence of Arthropoda found was a Collembola, referred to the genus Folsomia, in Hennequin Lake, which is much closer to moss carpets (Fig. 1). According to Greenslade (Reference Greenslade1995), 11 species of springtails are native to the Maritime Antarctic. However, members of Folsomia are not native to this region. The parthenogenetic non-native species Folsomia candida Willem 1902 has been recorded from Deception Island, but its continued presence or status there is uncertain (Greenslade et al. Reference Greenslade, Potapov, Russel and Convey2012). Choanoflagellida have been reported in the Antarctic marine ecosystem of the Weddell Sea (Buck & Garrison Reference Buck and Garrison1988), while members of this class are also known to occur in freshwater habitats elsewhere (Leadbeater & Kelly Reference Leadbeater and Kelly2001); however, to our knowledge, this is the first such report from Antarctic lakes.
The sequence data representing Chromista could only be resolved to higher taxonomic rank; however, they were dominant in Soto Lake, and the SEM data were useful in confirming this. The SEM data also confirmed the presence of two diatoms, which were not detected in the metabarcoding analysis. Among the ciliates, Hennequin Lake again hosted a more diverse community than Soto Lake. Few studies have addressed this diverse group in Antarctica, and it is likely to have been overlooked previously. Percolozoa have a cosmopolitan distribution, including reports from extreme environments (Park & Simpson Reference Park and Simpson2011), and they are another group that is likely to have been overlooked.
The Viridiplantae sequence diversity identified here resembles that described by Câmara et al. (Reference Câmara, Carvalho-Silva, Pinto, Amorim, Henriques and Silva2020) from Deception Island. However, marine taxa were not detected, even though both lakes sampled are located relatively close to the shore. Some taxa (such as Trebouxiales) are commonly present in the airspora, from which they can be deposited into freshwaters. DNA of the moss genus Sanionia was also detected in Hennequin Lake. This is one of the most common and widespread moss genera in moist and waterlogged habitats in the Maritime Antarctic, with large carpets surrounding Hennequin Lake. Concerning the flowering plant sequences identified, the record of Liliopsida may refer to the Antarctic hairgrass (Deschampsia antarctica E. Desv.), which is also common in the vicinity of Hennequin Lake. The presence of DNA attributed to a radish (Raphanus sp.) in Soto Lake has no clear explanation, although it provides a further example that, if confirmed, indicates that DNA (at least) of non-native species can be transferred into Antarctica (e.g. Fraser et al. Reference Fraser, Connell, Lee and Cary2018) by means of either air transport or zoochory or by humans in the form of plant fragments, propagules, pollen or even single cells (see also similar reports of non-native assigned sequences in Câmara et al. Reference Câmara, Carvalho-Silva, Pinto, Amorim, Henriques and Silva2020, Rosa et al. Reference Rosa, Da Silva, Ogaki, Pinto, Stech and Convey2020). Both lakes studied here are close to areas of human activity, with Hennequin Lake being located close to an Ecuadorian refuge and Soto Lake being near the Spanish station Gabriel de Castilla, while Deception Island is one of the most visited tourist sites in Antarctica (Câmara et al. Reference Câmara, Carvalho-Silva, Pinto, Amorim, Henriques and Silva2020).
It is interesting that, apart from the mentioned lake differences, no statistical differences in species compositions between the two assemblages were found. This needs further investigation, but the fact that both lakes are subject to the same harsh environmental conditions and low nutrient availability and that both lakes are located in the same geographical region of the Maritime Antarctic could play a role.
Few studies are available against which to compare our data. Pizzaro et al. (2002), working on periphyton communities in three lakes in Hope Bay, reported 18 Chlorophyta taxa, 12 of which were only assigned to the genus level, whereas we identified 28 chlorophytes, with 16 at the species level. As further metabarcoding studies are completed and database coverage progressively improves, considerable increases in recorded diversity are likely to result in all groups.
Conclusions
This study is the first application of metabarcoding in the assessment of periphyton diversity in Antarctic lakes. We recognize that, as in all metabarcoding studies, detecting the presence of DNA sequences referred to a given taxon does not confirm the presence of viable material, while sequence identification remains strongly limited by the available databases. We suggest that application of an integrated approach including both traditional and metabarcoding methodologies is required to generate the most authoritative and reliable data. Accepting these caveats, the DNA sequence data obtained in the current study are consistent with the presence of a rich periphyton community in these environmentally harsh Antarctic lakes. The application of metabarcoding yielded a greater diversity than has been previously recognized through traditional morphological approaches, supporting the use of metabarcoding as a powerful tool for studying periphyton communities in Antarctic lakes.
Acknowledgements
We thank the Brazilian Navy, Brazilian Air Force and the staff at Ferraz Station. We also thank Congresswoman Jô Moraes and the Biological Sciences Institute of the University of Brasilia (UnB). We thank Dra. Maria das Graças Machado de Souza (UnB, Brazil) and Dra. Roksana Majewska (North-West University, South Africa) for help with diatom identification. We are grateful for the comments of two anonymous reviewers, which helped to improve the manuscript.
Financial support
This study received financial support from CNPq, PROANTAR and INCT Criosfera 2. P. Convey is supported by NERC core funding to the British Antarctic Survey ‘Biodiversity, Evolution and Adaptation’ team.
Author contributions
PEASC, PC, MC-S and LHR designed the study. OHBP performed the bioinformatics. LMDS, ETA, LHR, MC-S and LHR conducted the fieldwork. LMDS performed the scanning electron microscopy analysis and lab work. ETA conducted the ecological analyses. PEASC and LHR secured funds. All authors wrote and revised all of the versions of this manuscript.