


Introduction
Studies of land fast ice in the Antarctic coastal zones have significantly intensified over the past half-century. The earliest investigations focused on the physico-chemical and biological characteristics, mostly observed in spring and summer, while following research widened the scope of the analysis to include the structure of these marine ecosystems and their past and future interactions with the open sea environment and the atmosphere (Dieckmann & Hellmer Reference Dieckmann and Hellmer2010, Massom & Stammerjohn Reference Massom and Stammerjohn2010). Although fast ice accounts for only around 5% (0.8·106 km2) of sea ice extension around Antarctica during winter, it plays an important role in several environmental and climate processes. The presence of fast ice affects near-surface boundary conditions along the Antarctic coastline, influencing the thermohaline characteristics and the circulation of continental shelf waters (Budillon et al. Reference Budillon, Pacciaroni, Cozzi, Rivaro, Catalano, Ianni and Cantoni2003, Fusco et al. Reference Fusco, Budillon and Spezie2009). The generation of ice platelets in super-cooled water columns, and their accumulation in bottom ice (BI) or in a floating layer beneath it, is the most peculiar feature of high latitude Antarctic marine environments. Their presence provides an essential habitat for a uniquely adapted microbial community, whose high production sustains zooplankton species such as copepods and amphipods (Ackley & Sullivan Reference Ackley and Sullivan1994, Arrigo et al. Reference Arrigo, Dieckmann, Gosselin, Robinson, Fritsen and Sullivan1995). As a result of these biological processes, both pronounced increases and depletion of nutrients and dissolved organic matter (DOM) takes place in fast ice systems (Thomas et al. Reference Thomas, Papadimitriou and Michel2010), with a concomitant generation and diffusion of biogenic gases that, similar to the areas covered by pack ice, may have a role in climate change scenarios (Loose et al. Reference Loose, Miller, Elliott and Papakyriakou2011). Melting and breakout of fast ice during spring causes the release of dissolved and particulate materials into seawater, triggering sedimentary fluxes that represent an important source of food for the coastal benthos (Fabiano et al. Reference Fabiano, Chiantore, Povero, CattaneoVietti, Pusceddu, Misic and Albertelli1997, Norkko et al. Reference Norkko, Thrush, Cummings, Gibbs, Andrew, Norkko and Schwarz2007, Cozzi & Cantoni Reference Cozzi and Cantoni2011).
Several studies have analysed the annual biogeochemical cycles and short-term processes in fast ice through the collection of field data and design of manipulative experiments. These studies have provided detailed insights into the physical characteristics and growth mechanisms of the ice, as well as their effects on its chemistry and biota (Ackley & Sullivan Reference Ackley and Sullivan1994, Günther & Dieckmann Reference Günther and Dieckmann1999, Arrigo et al. Reference Arrigo, Mock and Lizotte2010, Thomas et al. Reference Thomas, Papadimitriou and Michel2010). However, because of the problems of maintaining multi-year monitoring, the evolution of ice systems in Antarctic coastal zones and the linkage between their biogeochemistry and the ambient conditions have been rarely analysed on an interannual timescale. Satellite data have contributed to partially fill this knowledge gap, demonstrating the presence of changes in fast ice characteristics and extension due to decadal oscillations of atmospheric conditions and iceberg circulation (Heil Reference Heil2006, Fraser et al. Reference Fraser, Massom, Michael, Galton-Fenzi and Lieser2012). Field observations have shown that the interannual variability of fast ice extension, together with a possible local-scale heterogeneity, also affects the evolution of ice microalgal communities (Ryan et al. Reference Ryan, Hegseth, Martin, Davy, O'Toole, Ralph, McMinn and Thorn2006) and the spreading of penguin/seal populations (Massom & Stammerjohn Reference Massom and Stammerjohn2010).
With regards to Terra Nova Bay, specific biogeochemical and ecological processes related to the spring evolution of the ice system have already been largely analysed (Guglielmo et al. Reference Guglielmo, Carrada, Catalano, Dell'Anno, Fabiano, Lazzara, Mangoni, Pusceddu and Saggiomo2000, Reference Guglielmo, Carrada, Catalano, Cozzi, Dell'anno, Fabiano, Granata, Lazzara, Lorenzelli, Manganaro, Mangoni, Misic, Modigh, Pusceddu and Saggiomo2004, Reference Guglielmo, Zagami, Saggiomo, Catalano and Granata2007, Lazzara et al. Reference Lazzara, Nardello, Ermanni, Mangoni and Saggiomo2007, Cozzi Reference Cozzi2008, Mangoni et al. Reference Mangoni, Saggiomo, Modigh, Catalano, Zingone and Saggiomo2009, Pusceddu et al. Reference Pusceddu, Dell'Anno, Vezzulli, Fabiano, Saggiomo, Cozzi, Catalano and Guglielmo2009, Cozzi & Cantoni Reference Cozzi and Cantoni2011). The aim of the present study is to provide an overall view of the interannual and seasonal variability of physico-chemical conditions in this environment through the reanalysis of the whole dataset of ice cores collected in the bays of the Victoria Land coast during three PNRA (National Programme of Research in Antarctica of Italy) expeditions (Fig. 1) and the mining of ancillary data and information on ambient conditions. The evolution of fast ice is compared to meteorological forcings, oceanographic properties of under-ice coastal waters and published information on sympagic communities, in order to provide a synthesis of the biogeochemistry of this coastal ice system.
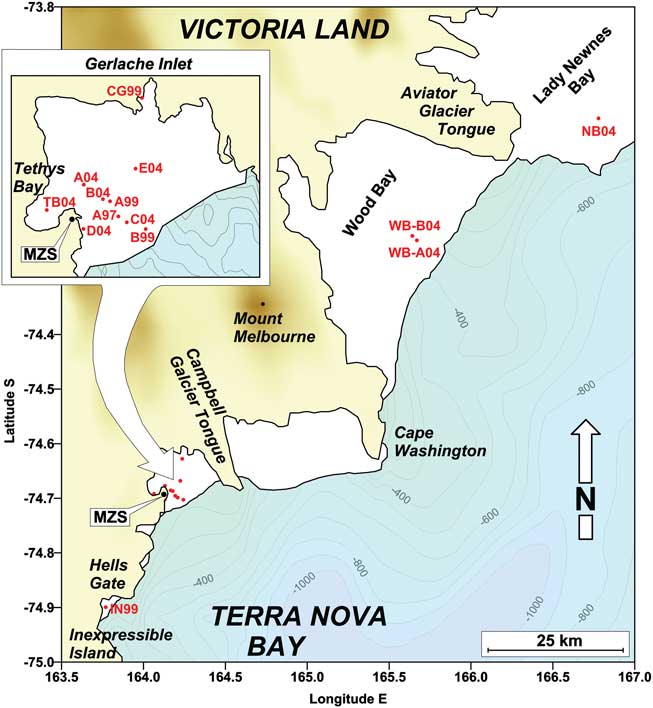
Fig. 1 Sampling stations (red dots) on the annual fast ice (white areas) along the Victoria Land coast and position of the Italian Mario Zucchelli Station (MZS).
Materials and methods
Field activity
Fifty-two ice cores were collected on annual fast ice in the bays of the Victoria Land coast (Ross Sea) in November–December 1997, 1999 and 2004, during three campaigns based at the Italian Mario Zucchelli Station (MZS). The field activity always started when the formation of fast ice and the platelet layer was complete and ice extension along the coast was at maximum. In the Gerlache Inlet, 43 ice cores were collected at ten sampling stations located in the middle of the bay, close to the Campbell Glacier Tongue, and in the inner Tethys Bay. Nine ice cores were collected close to Adélie Cove, in the area of Inexpressible Island in 1999, and in Lady Newnes and Wood bays in 2004 (Table I).
Table I Fast ice sampling stations and general characteristics of ice cores.
For each station, ice cores were collected in a small area (c. 100 m2) and handled with the same methodology. They were drilled using an aluminium corer (10 cm internal diameter), placed inside cleaned PVC holders and carried to an ice camp. There, the ice cores were sliced at ambient temperature and in dim light conditions, to avoid biogeochemical modification of the ice. Ice slices of 10 and 20 cm were chosen for the lowest and highest sections respectively, to obtain detailed vertical profiles while also ensuring that each slice offered enough sampled water for all laboratory analyses.
The unconsolidated platelet ice (UPI) that rose into the holes left by the cores was collected after each drilling, separated from the water using a sieve and stored in 1-litre acid-washed bottles. The water inflowing into the ice holes (interstitial water, IW) was collected using a customized 1-litre stainless steel bottle equipped with small inflow/outflow valves to prevent the inclusion of ice platelets. When the platelet layer has the thickness usually found in spring (0.5–1.0 m), the water collected using this method may be considered as bulk IW. When this layer thins at the end of the season, sampling of pure IW is impossible and the samples always present a fraction of seawater at the interface with BI.
The seawater at 5 m beneath the horizon of top ice was also sampled at all stations, using the same type of bottle used for IW sampling. In 1999 and 2004, the thickness of the snow layer covering all ice cores was measured and samples of snow (n = 8) were collected to determine the atmospheric deposition of nutrients.
Ice samples were melted into 1-litre acid-washed bottles using a thermostatic bath (2°C, 4–6 hours) and sub-sampled for the analytical determinations of bulk salinity, nutrients and DOM. From 8 November to 22 December 2004, 14 CTD profiles were acquired down to a depth of 150 m at stations A04 and TB04, using an SBE 19plus SEACAT profiler. During these casts, additional seawater samples were collected in the water column for the determination of nutrients and DOM using 5-litre Niskin bottles.
In November 2004, the ice temperature was measured daily at station A04, using five Pt100 thermistors submerged in fast ice (25, 45, 75, 115 and 175 cm above BI), after calibration against a certified thermometer (five-point regression,±20°C, r 2 > 0.98).
Analytical methods
Salinity was measured in all samples using an Autosal Guildline salinometer, the bottle data obtained in the water column being used to correct raw CTD profiles acquired in 2004 (Cozzi & Cantoni Reference Cozzi and Cantoni2011).
Samples for the determination of nutrients (nitrate = NO3, nitrite = NO2, ammonium = NH4, reactive phosphorus = PO4 and reactive silicate = SiO2) and dissolved organic carbon (DOC), nitrogen (DON) and phosphorus (DOP) were filtered on precombusted (450°C, 6 hours) Whatman GF/F filters. Nutrients were determined during the campaigns on an Alpkem (Flow Solution III) autoanalyser, using standard colorimetric methods (Grasshoff et al. Reference Grasshoff, Kremling and Ehrhardt1999). Dissolved inorganic nitrogen (DIN) was calculated as the sum of NO3, NO2 and NH4. During the expedition in 1999, dissolved urea was determined in fast ice and UPI samples (n = 40) on the same autoanalyser, using an automated diacetyl monoxime method (Cozzi Reference Cozzi2004).
DOM samples were frozen (-20°C) and stored for analysis at the ISMAR laboratory (Italy). DON and DOP were determined using the photo-oxidation method (Walsh Reference Walsh1989). The analysis was preceded by an ultrasonic homogenization of the samples, meant to dissolve the organic particulate that might have formed in the sample vials during storage. Long-term efficiency of UV + H2O2 oxidation was checked daily against standard solutions and reference seawater. Samples for the determination of DOC were collected in 1999 and 2004 and analysed by the HTCO method using a Shimadzu TOC-V analyser equipped with an ASI-V autosampler (Grasshoff et al. Reference Grasshoff, Kremling and Ehrhardt1999). DOC concentrations were measured in triplicate (CV < 2%) against four-point calibration lines obtained by the analysis of standard solutions of potassium hydrogen phthalate (r 2 > 0.99). The efficiency of the combustion system was corrected daily by the analysis of artificial standard solutions. The total blank of the DOC system for batch analyses in 1999 and 2004 (2.3 ± 0.8, 1.7 ± 0.4 μmol C l-1) was estimated using ultra-pure Milli-Q water.
Data processing
Vertical profiles of salinity in fast ice were classified on the basis of their shape in the four types (C, S, ? and I) defined by Eicken (Reference Eicken1992). At station A04, the brine content in fast ice (%) was calculated using the experimental data of ice temperature and salinity (Cox & Weeks Reference Cox and Weeks1983).
From 1996–2005, meteorological data were recorded hourly at MZS with a Milos 500 automatic acquisition system (ENEIDE station; www.climantartide.it/). Air temperature (TA; °C), air pressure (PA; hPa), wind speed (vW; m s-1) and wind direction (DW; °N) were used to analyse the meteorological conditions during the years of sampling activity with respect to monthly climatology of the decade. The occurrence of snowfalls during the campaigns was reconstructed by the analysis of meteorological SYNOP (WMO code: 89662) and METAR (ICAO code: NZTB) reports. Hourly averaged astronomical tide in Gerlache Inlet was calculated by harmonic coefficients reported for MZS by the ESR Antarctic Tide Gauge Database (www.esr.org/antarctic_tg_index.html).
The theoretical thickness of fast ice originated by the atmospheric cooling in Gerlache Inlet (hICE ; cm) was calculated using Zubov's Law extended to ice-atmosphere coupling (Leppäranta Reference Leppäranta1993):
 $${{h}_{ICE}}\, = \,\sqrt {h_{{\rm{0}}}^{{\rm{2}}} \, + \,{{a}^{\rm{2}}} \, \cdot \,S\, + \,{{{\left( {{{k}_i}/{{k}_a}} \right)}}^{\rm{2}}} } \,{\rm{ - }}\,({{k}_i}/{{k}_a}),\eqno\rm$$
where h 0 is the ice thickness at the beginning of the year (0 cm) and S is the sum of freezing degree days (i.e. an integral of daily averaged TA versus time; °C d) with a TA at ENEIDE station below the freezing seawater threshold of -1.85°C. The value of the freezing rate (a = 3.72 cm °C-0.5 d-0.5) and of the ratio between the heat conductivity of ice and the heat exchange coefficient with the atmosphere (ki /ka = 10 cm) were obtained from the study of Lei et al. (Reference Lei, Li, Cheng, Zhang and Heil2010) for land fast ice in Prydz Bay. Ice growth in Gerlache Inlet is often interrupted by breakouts caused by winter peaks of katabatic wind, which maintain the ice-free area of the Terra Nova Bay polynya (TNBp). For this reason, the real ice thicknesses measured in early spring are often thinner compared with the annual theoretical values estimated by Zubov's Law. However, assuming that after the breakout event the growth of any newly formed ice sheet follows Zubov's model, this law was applied inversely to estimate the periods of formation of the ice sheets using the data of ice thickness and TA available.
Profiles of potential temperature (θ; °C), salinity (Sal; psu) and potential density (σ θ; kg m-3) acquired by CTD casts in 2004 were used to analyse the structure of the water column beneath the sea ice. The integrated quantity of freshwater (FW; %) was calculated in the upper 150 m depth of the water column with respect to the winter average salinity (34.75 psu). The heat storage (H; J m-2) relative to the reference temperature θ 0 = -1.85°C was also calculated as:
 $$H\, = \,\mathop{\int}\limits_{z\, = \,0}^{z\, = \,{\rm{150}}} {{{c}_{P(z)}} \cdot {{\rho }_{(z)}} \cdot \left[ {{{\theta }_{(z)}}\,{\rm{ - }}\,{{\theta }_{\rm{0}}}} \right]} \cdot dz,\eqno\rm$$
where c P(z) (J kg-1 °C-1), ρ (z) (kg m-3) and θ (z) (°C) are specific heat, seawater density and potential temperature at depth z, respectively.
Finally, the accumulation/removal of nutrients and DOM in sea ice due to biological processes (dN) was calculated as the difference between the real nutrient content in sea ice (NICE ) and the theoretical content (NT ), a value derived from the conservative freezing of wintry surface seawater (i.e. based on a linear dilution model proportional to salinity changes):
 $$dN\, = \,{{N}_{ICE}}\,{\rm{ - }}\,{{N}_T}\, = \,{{N}_{ICE}}\,{\rm{ - }}\,\frac{{Sa{{l}_{ICE}}}}{{Sa{{l}_{SW}}}}\, \cdot \,{{N}_{SW}},\eqno\rm$$
where SalICE is the salt content in sea ice, while SalSW and NSW are salt and nutrient contents in seawater. This calculation was performed using vertically integrated quantities in the case of consolidate ice (mmol m-2), taking into account the thickness of the ice, as well as unit volume (mmol m-3) in the case of the platelet layer for which the thickness was often unknown.
Results
Interannual variability of meteorological conditions and ice growth
The analysis of the decadal series indicated that monthly averaged TA rises by c. 20°C in Gerlache Inlet from August–December, but oscillations as large as 45°C can be reached during the year for daily averaged TA (Fig. 2). In 1997, the period from January–March was characterized by a gradual decrease in TA close to the decadal climatology, whereas more pronounced decreases were observed in March 1999 and 2004. Alternating peaks of cooling and warming are frequent from April–September. During these months, TA oscillated from -30 to -10°C in 1997 and 1999, the highest variability being reached in 2004 due to a relatively warm June (-6°C) and an extremely cold July (-38°C). The phase of spring warming also included periods characterized by strong positive anomalies in TA, in particular during 2004 when an intense warming of the atmosphere persisted for most of September and October.
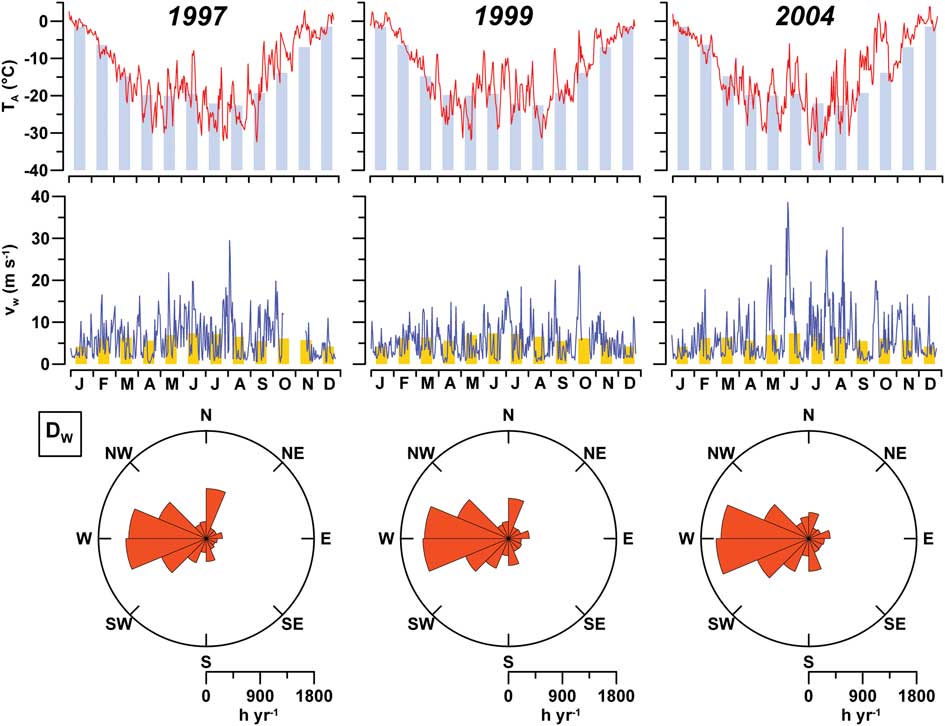
Fig. 2 Daily averaged air temperature (TA; °C), wind velocity (vW; m s-1) and wind direction (DW; hours year-1) at ENEIDE station in 1997, 1999 and 2004, compared with monthly averaged climatology in 1996–2005 (histograms).
Monthly climatology indicates that the lowest and highest values of vW occur in January and June (4.2 and 7.4 m s-1, respectively). However, wind peaks reached hourly averaged velocities far higher than the monthly data, as in August 1997 (29.5 m s-1) and October 1999 (23.5 m s-1). The most dynamic wind regime was again observed in 2004, when vw reached the highest value of the decade in June (38.6 m s-1) and two other peaks occurred in August (27.2 and 32.6 m s-1). In this region, the strongest airflows blowing from the SW–NW sectors are due to katabatic winds, which dominated the wind regime during the years of activity, with a maximum frequency of 4750 hours year-1 in 2004. Wind from the N–NE is usually weaker and less frequent, although it persisted for 754 hours year-1 in 1997.
Meteorological reports indicated the occurrence of several snowfalls in the area during November and December (nine in 1997, four in 1999 and four in 2004). However, snow cover above the ice was not thick (< 20 cm) due to the removal effect exerted by the wind. The snow layer was 15–18 cm at the beginning of November 1999, but it decreased to <1 cm at most of the sampled sites during the second half of the month. Snow was almost completely absent in Gerlache Inlet in November 2004, with the exception of two temporary depositions during the second half of the month. Snowdrifts (c. 20 cm deep) were only observed in Lady Newnes and Wood bays in 2004, suggesting a weaker removal effect by the wind in these bays.
According to Zubov's Law, the freezing season should have generated rather constant annual ice thicknesses in 1996–2005 (range = 237–246 cm, median = 241 cm) in Gerlache Inlet. By contrast, the real thickness of fast ice measured in early spring showed a high interannual variability and a significant spatial heterogeneity (Table I), varying from 141 ± 7 cm to 255 ± 7 cm in 1997 and 1999, respectively. In 2004, the inner area of the bay (A04, TB04) was covered by thick sheets of intact sea ice, whereas the outer area was covered by thinner, cracked ice (B04–E04; 106–110 cm) that clearly originated from a previous breakout followed by refreezing. High spatial variability in ice thickness was also observed in 1999 (CG99, IN99) and in 2004 (WB04, NB04). Complete ice breakout occurred in Gerlache Inlet 1.5 months after the end of the sampling in the first two campaigns, in January 1998 and 2000. In 2004, events of intense wave motions not matched to strong winds caused the retreat of ice to occur earlier, from 15–27 November (Cozzi & Cantoni Reference Cozzi and Cantoni2011, fig. 1), thus permitting the continuation of ice sampling only at the inner station TB04.
Physical evolution of the coastal ice system in spring
With the exclusion of the bottom layer, salinity in the fast ice ranged from 1.848–11.851 psu (median = 5.723 psu). Salinity in the upper ice section was 2.0–2.5 psu higher than in the lower section, the layers being separated either by a large transition zone (A97, A04 and WB04) or a steep gradient (A99, B99, CG99, B04 and C04). Salinity profiles in fast ice did not show a significant interannual variability, although distinctly lower salinity values were measured at station TB04 in late spring (Fig. 3). However, they showed pronounced short-term changes characterized by a frequent shift from C- to ?-type due to a decrease of 2–5 psu in the upper ice layer. In 2004, I-type profiles were present at stations D04, E04 and TB04, but they were similarly modified by decreases in top ice salinity. A strong reduction in salinity in the upper ice layer at station B04 (11.851 to 6.361 psu) from 10–19 November 2004 changed its profile from C- to S-type.
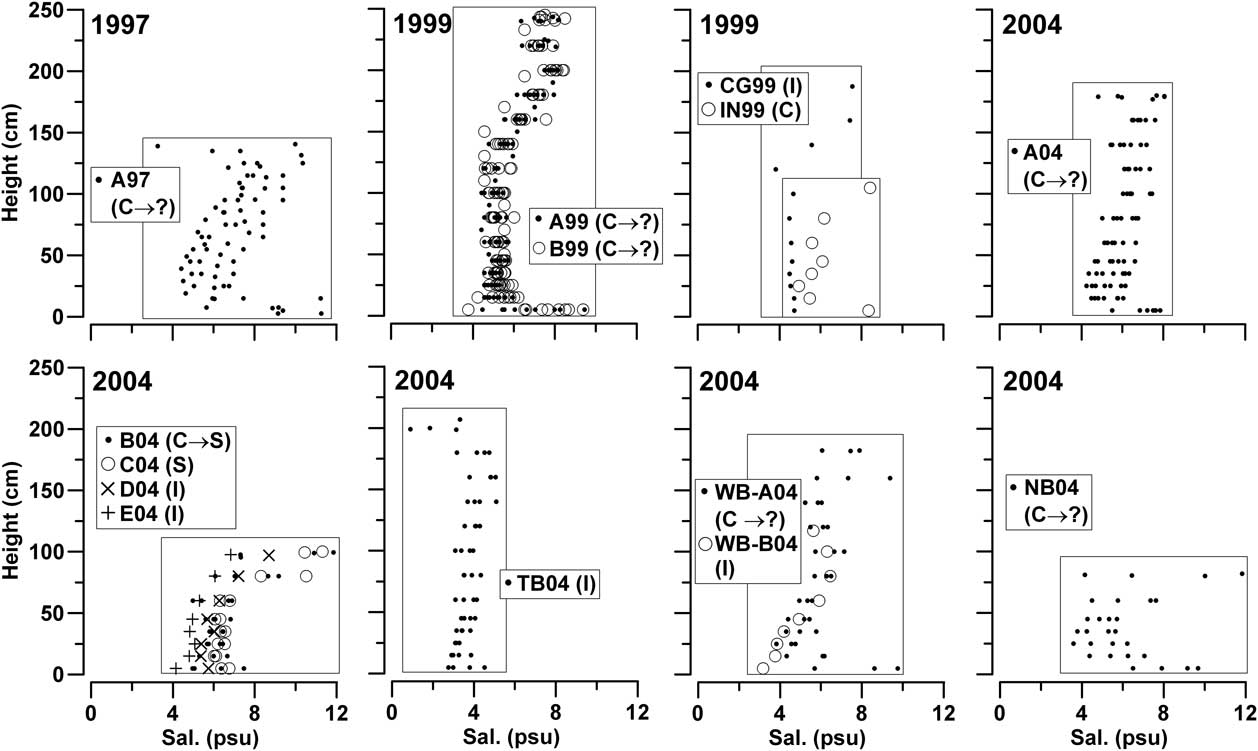
Fig. 3 Thickness and salinity profiles in fast ice (zero-depth = interface between bottom ice and platelet layer) and classification in the prevalent C, S, ? and I types.
The thermal gradient in fast ice was mainly regulated by the differences between TA and the constant temperature characteristic of the ice-seawater interface (-1.85°C; Fig. 4a & b). Top ice showed oscillations from -8.8 to -1.2°C connected to the periods of air warming, whereas the lowest 80-cm thick section had ice temperatures constantly maintained above -4°C by the heat transfer from the water column. Brine content in fast ice showed variable values in the upper layer (5–16%) and a permanent vertical gradient in the lower layer (7–20%; Fig. 4d). Two different factors were responsible for this pattern: in the upper ice layer increases in ice temperature determined a higher brine content (+1.0% per 1°C, r 2 = 0.71), whereas salinity oscillations regulated the brine content in the isothermal lower layer (+2.5% per 1 psu, r 2 = 0.98).
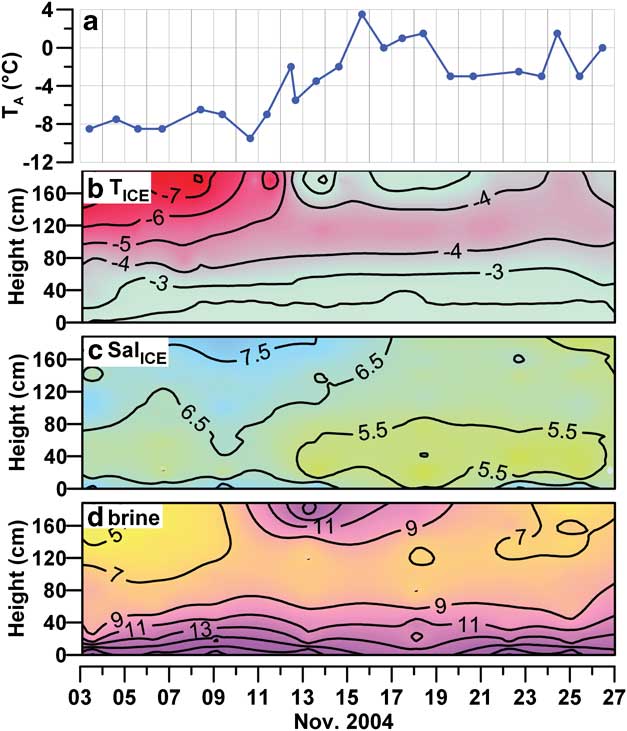
Fig. 4 a. Daily averaged air temperature (TA; °C) and b. temperature (°C), c. salinity (psu) and d. brine content (%) in fast ice at station A04.
The variability of salinity in BI and the platelet layer (7 and 15 psu) indicates the presence of significant oscillations of the hydrostatic equilibrium between melted ice and seawater (Fig. 5). At the same time, the calculation carried out showed that the astronomical tide represents an important component of sea level variability in Gerlache Inlet, characterized by cycles of 13.66 days and by oscillations as large as ±53 cm during the spring tidal phases. Tide oscillations generate coastal currents that can favour the exchange of water between the sea ice and the seawater column. Nevertheless, no clear correlation between tide and salinity in BI, IW and UPI could be found, even though tide oscillations from -45.9–+22.2 cm were measured in concomitance with the sampling of ice cores (Fig. 5a, c & e). By contrast, increases in TA and PA had a greater effect on the freshening of BI and IW (Fig. 5b & d). This process occurred in BI for TA > -4°C and for PA above the average of the period (975 hPa). In IW, the decrease in salinity took place above -1°C and 985 hPa, reaching the lowest value (25.57 psu) in the ice cores collected at station TB04 at the end of December 2004, whereas the influence of PA and TA on UPI salinity was not significant (Fig. 5f).
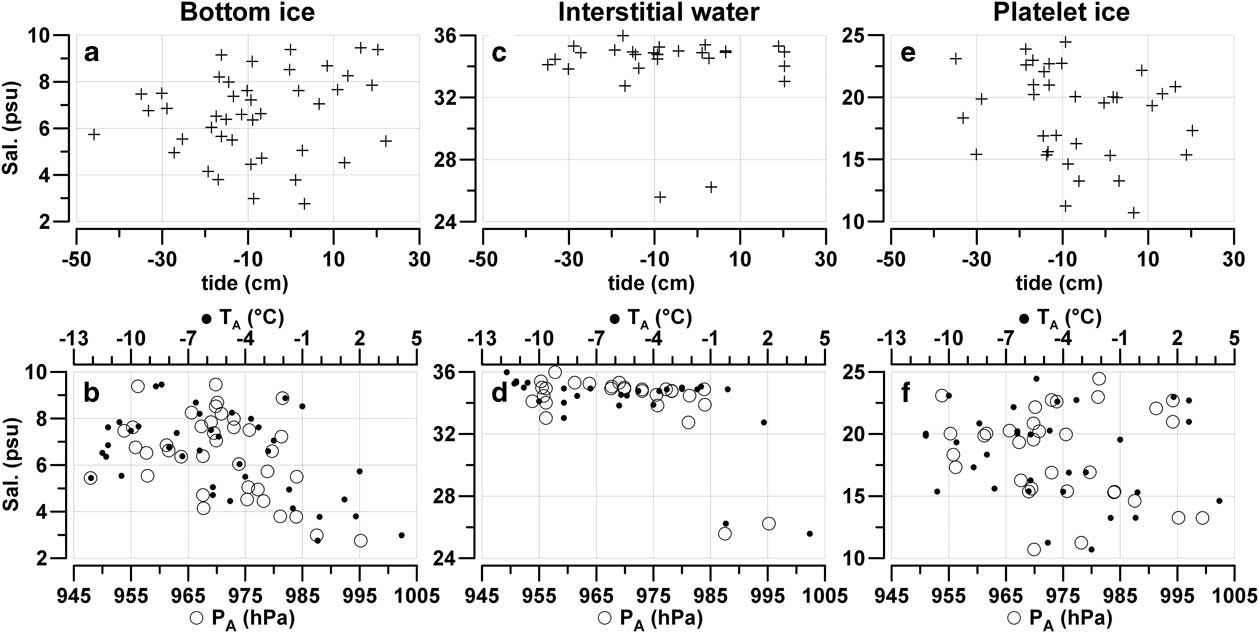
Fig. 5 a., c. & e. Salinity (psu) vs astronomical tide (cm) and b., d. & f. salinity vs hourly averaged air pressure (hPa) and air temperature (°C) in bottom ice, interstitial water and unconsolidated platelet ice in all the ice cores collected in the Gerlache Inlet.
The seawater column under the fast ice was characterized by homogeneous profiles of θ (-1.901 ± 0.007°C), salinity (34.746 ± 0.002 psu) and σ θ (27.983 ± 0.002 kg m-3) at the beginning of November 2004, which indicates the presence of wintry coastal waters down to a depth of at least 150 m in Gerlache Inlet (Fig. 6). During the following two months, the increase in seawater temperature in the upper layer up to +0.686°C caused the melting of sea ice, and a consequent decrease in salinity of c. 0.15 psu in the whole upper layer and c. 15 psu in the surface water in contact with the ice. This process generated a lens of fresher, buoyant water (σ θ = 15.91 kg m-3) in the first metre of depth, while in the rest of the water column the potential density was > 27.63 kg m-3.
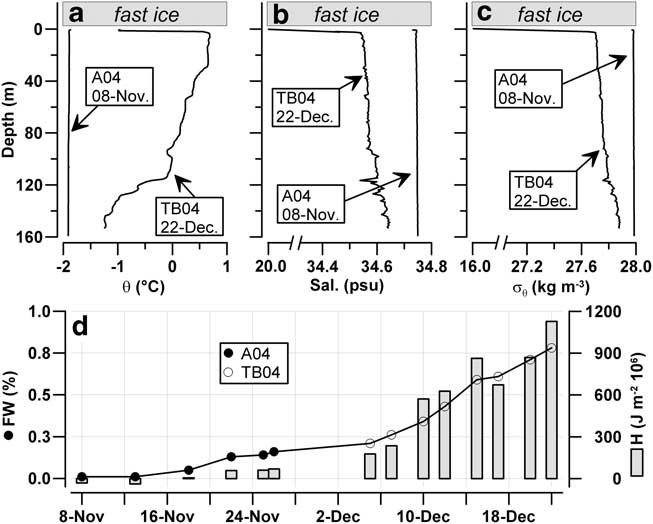
Fig. 6 Profiles in the seawater column beneath stations A04 and TB04. a. Potential temperature (°C), b. salinity (psu) and c. potential density (kg m-3). d. Integrated quantities of freshwater (FW; %) and heat content (H; J m-2·106) in upper 150 m depth of the water column.
The heat (H) content in the water column was slightly negative (-31·106 J m-2) at the beginning of November 2004, due to the temperatures in the deeper waters which were slightly lower than those at the surface (Fig. 6d). The first important increase in H occurred during the phase of ice breakout in the bay (15–27 November), it reached +1128·106 J m-2 in December because of the presence of positive temperatures down to a depth of 120 m. During this period, the content of FW in the mixed layer rose from 0.01% to 0.78% due to the melting of ice, showing an increase strictly related to the heating of seawater (dFW/dH = 1·10-9 m3 J-1; r2 = 0.95) and corresponding to a mean flux of meltwater of 0.03 m d-1 (i.e. 0.03 m3 of FW per 1 m2 of ice surface per day).
Interannual and seasonal trends of nutrients and dissolved organic material
Nutrient and DOM concentrations in the snow sampled on the fast ice indicates the presence of a detectable atmospheric deposition in this coastal zone in 1999 and 2004 (Table II). However, as freshly deposited snow had lower concentrations than aged snow, we assume that this nutrient content originated mainly from a contamination of marine origin rather than from atmospheric inputs.
Table II Concentration (median and range μmol l-1) of nutrients, dissolved organic matter and urea in the snow, fast ice, unconsolidated platelet ice, interstitial water and seawater. Last column indicates ice layers (cm) in which the highest accumulation of nutrients occurred (zero-depth = interface between bottom ice and platelet layer).
In fast ice, the highest concentrations of NO3 were reached in the bottom layer in 1997 and 1999 (89 and 70 μmol N l-1, respectively), whereas lower values were measured in 2004 (Table II). By contrast, a unique and extreme accumulation of NH4 (128 μmol N l-1) and PO4 (44 μmol P l-1) was observed in the lowest 70-cm thick section of fast ice in Gerlache Inlet in 2004, suggesting that nitrogen and phosphorus cycling was significantly different from the previous two campaigns. Two other aspects of nutrient behaviour were important. First, SiO2 was the only nutrient whose concentration in sea ice (0.8–46 μmol Si l-1) never exceeded that in the surrounding seawater (46–80 μmol Si l-1). Second, NH4 was always broadly distributed throughout the whole ice profile with concentrations (1.9–128 μmol N l-1) often exceeding those of NO3 in the interior layers where the growth of ice communities reduced the availability of nutrients in early spring.
In the platelet layer, strong increases in NH4 (69 μmol N l-1) and PO4 (46 μmol P l-1) were found in 2004 (Table II). The NO3 concentration was often higher than in fast ice, in particular at stations A97, A04 and NB04 (105 μmol N l-1), whereas NH4 and NO2 were mostly secondary nitrogen forms. The SiO2 concentration ranged from near depletion to levels approaching those found in seawater (2.2–75 μmol Si l-1), indicating the occurrence of temporary phases of isolation of this layer from the water column. Despite the presence of several peaks of NH4 (41 μmol N l-1) and PO4 (10 μmol P l-1) clearly related to inputs from ice, IW generally presented concentrations of nutrients similar to those of seawater.
With the exception of the unusual accumulation of NH4 and PO4 in the lower ice layer in 2004, the short-term evolution of nutrients in fast ice in spring was characterized by three distinct trends: i) constant concentrations and conservative behaviours persisted in the upper ice until the biological activity was scarce, ii) the interior ice layer showed a decrease in concentrations as a consequence of the growth of sympagic algae, and iii) strong accumulations occurred in BI. These trends were observed for all nutrients in 1999 (Cozzi Reference Cozzi2008) and for NO3, NO2 and SiO2 in 2004 (Fig. 7). At the same time, the concentration of nutrients in the platelet layer showed greater oscillations compared with BI, with frequent increases during the phase of accumulation of sympagic biomass (Lazzara et al. Reference Lazzara, Nardello, Ermanni, Mangoni and Saggiomo2007, Cozzi Reference Cozzi2008) followed by decreases in late spring (Table II).
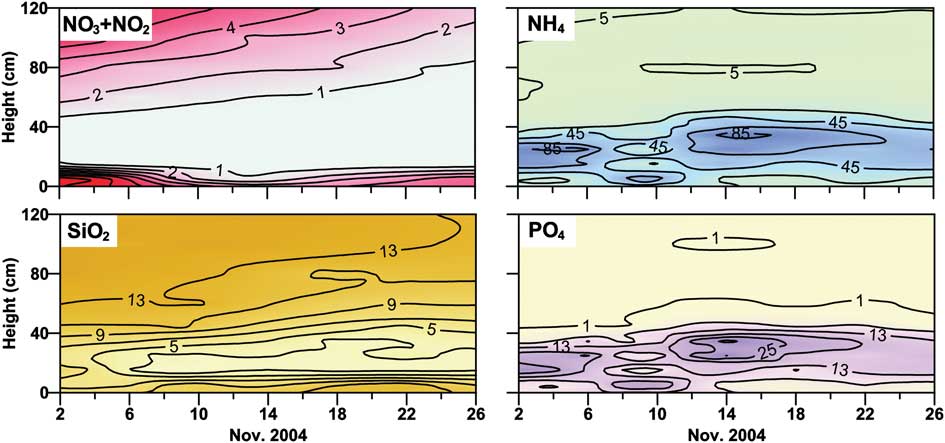
Fig. 7 Concentration of nutrients (μmol l-1) in the lowest 120 cm thick layer of fast ice at station A04.
The accumulation of DOM in fast ice strongly exceeded those of the nutrients, as peaks two orders of magnitude higher than the concentration in the under-ice waters were reached in all the campaigns (Table II). In BI, the highest concentrations reached were of DOC in 1999 (3480 μmol C l-1), and of DON and DOP in 2004 (599 and 69 μmol l-1, respectively). These increases were localized in a thin ice layer in 1997 and 1999 (Cozzi Reference Cozzi2008), whereas a diffuse accumulation in the lower 70-cm layer was observed in 2004. A large accumulation of DOM was also observed in UPI, but the values did not reach the levels of BI (805, 399 and 67 μmol l-1 in 1997, 1999 and 2004, respectively).
Information on the behaviour of urea in sea ice is limited and the few data analysed in 1999 did not permit a detailed assessment of its dynamics. However, urea was detected throughout the entire ice profile in concentrations that paralleled those of DON, the highest values being located in BI and UPI (Table II). On average, urea constituted 39% and 24% of DON in fast ice and UPI, respectively.
The water column was characterized by constant concentrations of NO3, SiO2 and PO4 in early spring (33, 80 and 2.4 μmol l-1, respectively), typical of the wintry homogeneous waters that persist in this bay until the middle of November. An increasing NO2 concentration (0.01 to 0.07 μmol N l-1) and a decreasing NH4 concentration in 1999 (3.69 to 0.28 μmol N l-1) were the only exceptions observed in this early period. Episodic high concentrations of DOC, DON and DOP in these waters, reaching levels not found in the open sea, were clearly the result of inputs from sea ice. The stabilization of the water column and the formation of a nutrient-poor upper layer were observed in December 2004. In this case, a reduction of c. 50% of the winter concentrations of NO3, SiO2 and PO4 occurred down to a depth of 100 m (14, 52 and 0.8 μmol l-1, respectively), whereas NH4 and NO2 showed less significant changes and DOC even increased (82 μmol C l-1).
Variability of the composition of nutrient and dissolved organic material assemblages
Nutrient ratios and C:N:P composition of DOM showed significant interannual differences in this coastal ice system (Table III). In fast ice, DIN and PO4 were always closely linked (r 2 = 0.65–0.91), with molar ratios in the range of 3.3–6.0. However, these values were the result of the accumulations of NO3 and PO4 in 1997 and 1999, and of NH4 and PO4 in 2004. The SiO2 concentration was weakly correlated with the dynamics of other nutrients, with the exception of its relationship with NO3 in 1997 and 2004. Ratios for DOC/DON ranged from 20.1 in 1999 to 10.7 in 2004, but an exceptional temporary increase in DON (599 μmol N l-1), not matched by an equivalent increase in DOC, occurred in fast ice in 2004. Ratios for DON/DOP in fast ice varied from 10.1–16.9, showing oscillations opposite to those of nitrogen/phosphorus ratios in the nutrient pool, thus generating more balanced values for TDN/TDP ratios (8.4 and 9.5, respectively).
Table III Nutrient ratios in sea ice calculated as slope of linear regressions (r 2 = coefficient of determination) at significance levels P < 0.001.
aDON < 100 μmol N l-1, bPO4 < 30 μmol P l-1.
DIN = dissolved inorganic nitrogen, DOC = dissolved organic carbon, DON = dissolved organic nitrogen, DOP = dissolved organic phosphorus, TDN = total dissolved nitrogen, TDP = total dissolved phosphorus.
In UPI, the increases of NO3 and PO4 were always correlated, whereas the relationships between NH4 and PO4, as well as that between SiO2 and other nutrients, were almost never significant. The DOM pool in UPI had a high content of DOP compared to DON (DON/DOP = 8.6–10.7). Similar to fast ice, a compensation between the interannual oscillations of nutrient and DOM ratios resulted in more balanced values of TDN/TDP. In IW, only NH4/PO4 (2.0, r 2 = 0.36), Si/NO3+NO2 (1.9, r 2 = 0.71) and Si/DIN (2.0, r 2 = 0.60) ratios were significant at levels of P < 0.0001 during the three campaigns (not shown).
In early spring, coastal waters presented a nutrient composition that was particularly rich in reactive silicon (SiO2/DIN = 2.6, DIN/PO4 = 14.6) and a high content of carbon in the DOM assemblage (DOC/DON = 13.7, DON/DOP = 16.7). In December 2004, the drawdown of nutrients occurred during the phase of formation of a stable mixed layer with ratios of NO3+NO2/PO4 at 12.8 (r 2 = 0.86, P < 0.0001) and Si/NO3+NO2 at 1.4 (r 2 =0.88, P < 0.0001).
Nutrient and dissolved organic material balances in the fast ice system
The comparison between real and theoretical nutrient contents indicates that fast ice was almost always characterized by a deficit of NO3 (c. 3 mmol N m-2), despite a small positive contribution of NO2 (Fig. 8a). Only a few ice cores collected in 1997 and 1999 presented positive balances due to the particularly high regeneration of NO3 in BI. However, the balance of DIN in ice was constantly shifted to positive values due to the large accumulation of NH4. The PO4 balance was close to equilibrium in 1997 and 1999 (Fig. 8d), suggesting a substantial equivalence between internal uptake and regeneration. In 2004, it was highly positive (Fig. 8d), indicating a strong predominance of phosphorus remineralization. The balance of SiO2 in fast ice was always negative, with an almost constant deficit (c. 5 mmol Si m-2), similar to that of NO3 (Fig. 8e).
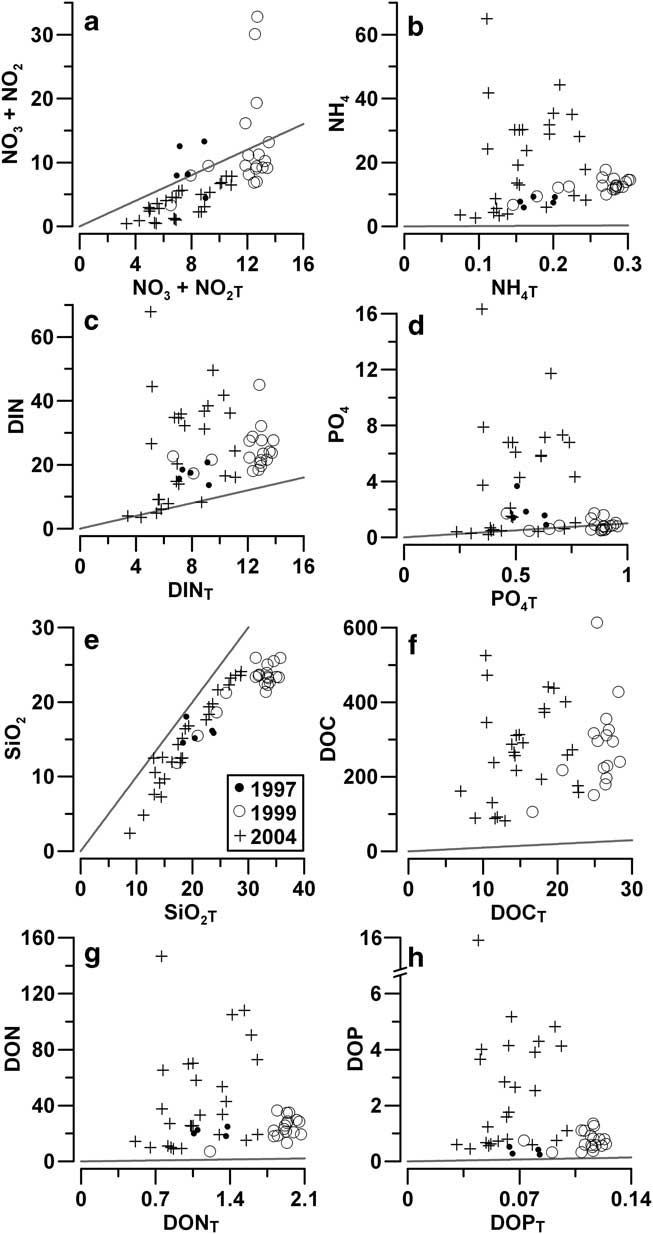
Fig. 8 Comparison between real (N) and theoretical (NT) integrated contents of nutrients (mmol m-2) and dissolved organic matter in fast ice. Solid line: N = NT. DIN = dissolved inorganic nitrogen, DOC = dissolved organic carbon, DON = dissolved organic nitrogen, DOP = dissolved organic phosphorus.
The large accumulation of DON and DOP in 1997–99 (+34.6 mmol N m-2 and +1.24 mmol P m-2, respectively), and their extreme accumulation in 2004 (+145.9 mmol N m-2 and +15.5 mmol P m-2, respectively) always lead to highly positive balances for TDN and TDP pools in sea ice (Fig. 8g & h). The behaviour of DOC was similar, showing a positive balance in all the ice cores (68.9–588.5 mmol C m-2; Fig. 8f).
Nutrient balances in the platelet layer showed some differences compared to fast ice. The NO3 content was either close to equilibrium or highly positive in 1997 and 1999, indicating a frequent enrichment of this nutrient beyond the levels ascribable to the influx of seawater. Strongly negative NO3 balances were observed in 2004 (-20.3 mmol N m-3), with the greatest deficit occurring in IW of the ice cores collected at stations A04, TB04, WB-A04 and WB-B04 (Fig. 9a). These negative values persisted for DIN, despite the positive contributions of NH4 (Fig. 9b & c). The strong accumulation of DON (+396 mmol N m-3) shifted the balance of TDN to positive values. A large accumulation of DOM was frequently observed in the platelet layer, with values for DOC (+770 mmol C m-3) that were even higher than in fast ice.
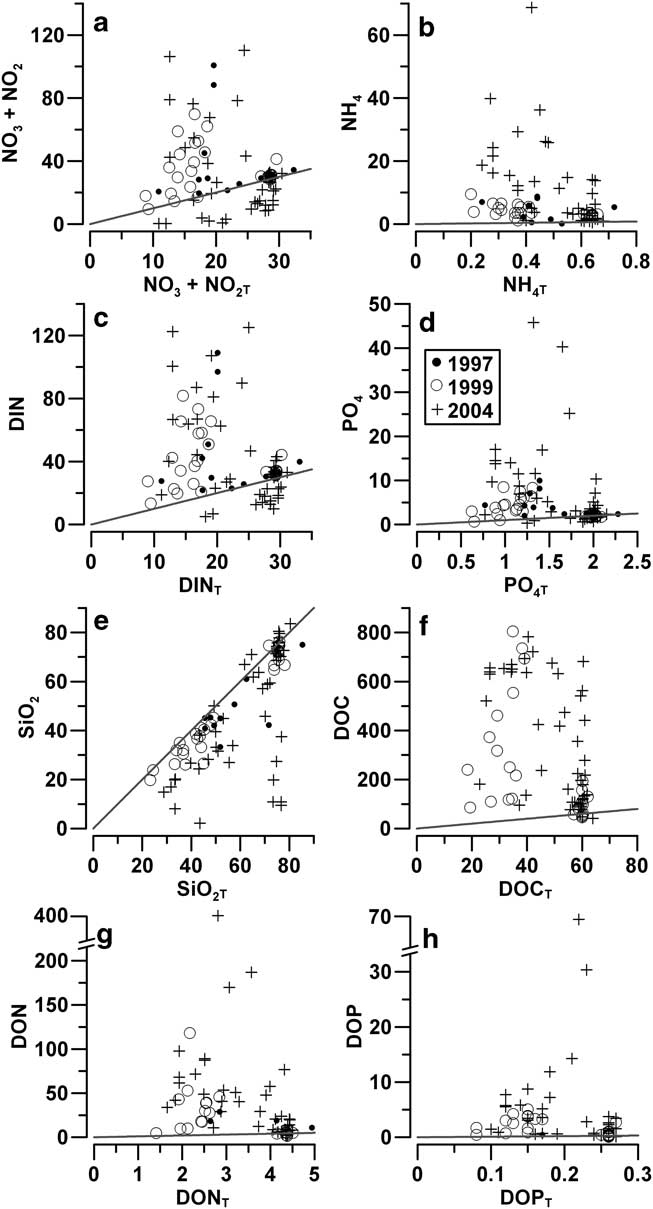
Fig. 9 Comparison between real (N) and theoretical (NT) integrated contents of nutrients (mmol m-3) and dissolved organic matter in the platelet layer (solid lines: N = NT).
The behaviour of phosphorus in the platelet layer was similar to that in fast ice, with PO4 and DOP values close to the equilibrium in 1997 and 1999, and highly positive in 2004 (Fig. 9d & h). Similarly, the balance of SiO2 was was close to the equilibrium in this ice layer in 1997 and 1999, and strongly negative in the ice cores collected at station A04 from 3–18 November 2004 (-67.2 mmol Si m-3) (Fig. 9e).
Discussion
Role of atmospheric forcings in the annual ice cycle
From 1996–2005, meteorological conditions in Gerlache Inlet were characterized by air temperatures ranging from -38°C to +8°C and hourly-averaged wind speeds up to 38.63 m s-1. During winter 2004, freezing and wind conditions were among the most extreme of the decade. The influence of meteorological forcings on the evolution of TNBp has already been highlighted. Katabatic winds blowing from the Antarctic Plateau through the valleys of the David, Priestley and Reeves glaciers maintain its open water area and contribute to the ventilation of the Ross Sea continental shelf through the production of high salinity shelf water (HSSW; Budillon et al. Reference Budillon, Pacciaroni, Cozzi, Rivaro, Catalano, Ianni and Cantoni2003). For the TNBp, Fusco et al. (Reference Fusco, Budillon and Spezie2009) estimated higher annual average heat loss from the sea to the atmosphere (-189 W m-2), ice production (32 km3) and HSSW transport (1.6 Sv) in 2004 compared to 1997 (-103 W m-2, 20 km3, 1.0 Sv) and 1999 (-99 W m-2, 20 km3, 1.1 Sv). The present data indicate that, in the inner bays of the Victoria Land coast, thickness and evolution of fast ice are also modulated by the interannual variability of climatic conditions.
According to Zubov's Law, ice thicknesses in the range 237–246 cm would be expected every year in Gerlache Inlet as a result of similar freezing seasons. The minimal formation of snow ice in this bay should further contribute to the constancy of these values. However, field observations indicate that the ice thickness was only similar to this theoretical value in 1999 (255 ± 7 cm). In this case, the inverse application of Zubov's model indicates that the fast ice had formed over a period of around 9 months, corresponding to a gradual thickening during autumn and winter uninterrupted by ice breakouts, which was in agreement with the low wind speed measured during that year (Fig. 2). In 1997 and 2004, the variable ice thicknesses observed in spring can be related to ice breakouts induced by strong wind events. The estimated period of ice formation at station A97 was around 3.5 months, suggesting that this ice sheet formed after a wind peak that occurred at the beginning of August 1997. At station A04, fast ice (188 ± 2 cm) was generated in 5 months, thus after the wind peak in June 2004. The ice sheet at the outer stations B04–E04 was thin and clearly originated from refreezing. Its thickness indicated an estimated formation over 2.5 months, a value that is in line with the presence of two strong wind events in August 2004.
The data from 1999 indicates that this simplified version of Zubov's Law offers rather accurate predictions of the growth of fast ice resulting from an unperturbed process. The model slightly underestimates the real thickness by c. 10 cm, a difference that might easily ensue from the effects of boundary conditions or oceanic heat fluxes on the ice growth. The difference is also equivalent to the thickness of BI, a layer that forms through consolidation of ice platelets floating in the water column, a mechanism that is not included in Zubov's model.
Less information is available on sea ice in the other bays of the Victoria Land coast. In spring 1996, satellite data indicated a high spatial stability and small changes in the spectral characteristics of ice sheets, suggesting the predominance of annual land fast ice in all the sampling zones covered by this study (Lythe et al. Reference Lythe, Hauser and Wendler1999). In the southern area of Wood Bay, the presence of fast ice was inferred in 1993 by the analysis of floristic composition of bottom communities (Moro et al. Reference Moro, Paccagnella, Barbante and Andreoli2000). In the light of this homogeneity of ice characteristics, the variability of thicknesses observed along the Victoria Land coast again suggests wind stress as an important factor regulating ice dynamics. Station IN99 was located in the area that was most subjected to katabatic wind, because of the airflows channelled through the Reeves and Priestley glaciers. In 1999, the thinner ice noted here was consistent with wind peaks up to 36 m s-1 (www.climantartide.it). In 2004, Wood and Lady Newnes bays were probably less affected by katabatic winds than Gerlache Inlet. However, the thin ice at station NB04 might have been formed after the wind peaks in August (up to 23 m s-1 in this zone). The reduction of ice thickness from WB04-A to WB04-B was due to the gradual ice retreat (Table I).
Overall, the comparison between the field data and model results indicates that strong wind events are able to remove fast ice from the inner zones of the coast, thus generating temporarily ice-free waters during winter. Moreover, it indicates that all biogeochemical features of land fast ice with a thickness of less than 2.5 metres, including the sympagic communities, are not related to an annual process of ice formation but to shorter periods of ice growth (2–5 months).
Spring evolution of physical characteristics of the coastal ice system
Salinity profiles in sea ice usually reflect the ambient conditions during ice growth more closely than the specific mechanisms of thickening (Eicken Reference Eicken1992). However, the present data shows that they are also subjected to a subsequent evolution in the formed ice. A common shift from C- to ?-type was detected in spring, due to decreases in salinity in the top ice (2 to 7 psu) concomitant to increases in TA (7.5 to 11.2°C). This process indicates an enhanced vertical drainage of meltwater, permitted by the enlargement and reconnection of brine pockets as a consequence of warming. The shift from C- to S-type at station B04 was also caused by a strong decrease in salinity in the upper and interior ice layers in conjunction with the most pronounced warming recorded in November 2004. I-type salinity profiles are typical of late spring as they are the result of previous vertical homogenization of salt content in fast ice. However, a further rise in TA at the beginning of December 2004 caused a decrease in salinity in the top ice (1.3 psu) with a consequent deformation in the shape of the profiles (Figs 2 and 3). The mechanisms responsible for the variability of the liquid phase in fast ice are better clarified by the analysis of the brine content at station A04 (Fig. 4). Brine volume was modulated by the oscillations of TA in the upper and interior layers of fast ice, whereas the constant seawater temperature maintained the ice temperature above -4°C in the lowest layer, ensuring a higher porosity of ice. For this reason, the variability of brine (7–20%) in the lowest layer was driven by the oscillations of salinity.
The BI and platelet layers are habitats characterized by large variability in physical conditions. Tidal oscillations have already been indicated as an important factor for such variability, as they generate barotropic gradients that interact with the irregularity of the lowest ice surface originating complex current fields. These flows favour a pulsed replenishment of IW and nutrients that sustain the high growth of ice algae typical of this habitat (Arrigo et al. Reference Arrigo, Dieckmann, Gosselin, Robinson, Fritsen and Sullivan1995). However, present data show a far stronger correlation of salinity in BI and IW with TA and PA (Fig. 5). For TA, this result is in agreement with the thermodynamics of ice that considers -5°C as a threshold above which the porosity of ice, and the volume of meltwater, strongly increase (Leppäranta Reference Leppäranta1993). The relationship between an increase in PA and the freshening of the lowest ice layers might indicate a direct effect on the drainage of meltwater through the ice or be the result of an indirect correlation between local atmospheric conditions and physical processes in sea ice.
Spring evolution of the coastal waters was shown to be strictly coupled to that of fast ice. The homogeneous profiles of salinity and temperature observed at the beginning of the sampling periods indicate the presence of HSSW in this area, possibly modified by the contact with ice shelves in winter (Budillon & Spezie Reference Budillon and Spezie2000). The subsequent rise of heat content in the upper layer (1128·106 J m-2) caused, firstly, the disruption of the platelet layer and the erosion of BI, and secondly, a FW flux of 0.03 m d-1 due to ice melting. This latter phenomenon determines the stabilization of the mixed layer and the formation of Summer Surface Waters (SSW). This evolution is in line with that reported in Terra Nova Bay in 1997–2006 by Massolo et al. (Reference Massolo, Messa, Rivaro and Leardi2009) who observed high meltwater content in the mixed layer (0.52–2.86%) and formation of summer pycnoclines at the depth of 13–26 m, with consequent isolation of nutrient-depleted surface waters. Recently, it was also shown that the interannual variability of this area is not only affected by climatic oscillations (Fusco et al. Reference Fusco, Budillon and Spezie2009) but also by the circulation of mega-icebergs (Remy et al. Reference Remy, Becquevort, Haskell and Tison2008).
Chemical variability of fast ice and coastal waters
The evolution of nutrients and DOM in fast ice is the result of biological processes, which begin when the ambient conditions become favourable for the growth of ice micro-organisms in spring, superimposed on the initial pools of biogenic elements trapped in sea ice during the freezing of seawater in winter (Günther & Dieckmann Reference Günther and Dieckmann1999, Riaux-Gobin et al. Reference Riaux-Gobin, Tréguer, Dieckmann, Maria, Vétion and Poulin2005, Cozzi Reference Cozzi2008, Meiners et al. Reference Meiners, Norman, Granskog, Krell, Heil and Thomas2011).
On an interannual timescale, fast ice chemistry in this area is modulated by two important factors: i) katabatic wind events determine the initial chemical characteristics of ice as every year they regulate the timing of formation and thickening of ice sheets along the coast, and ii) the variability of the physical ice structure generated in winter influences the biogeochemical evolution of fast ice in spring, as shown by the cracked and refrozen ice found in 2004 compared to the homogeneous ice in 1997 and 1999 (Table II, Fig. 7).
Short-term dynamics of nutrient and DOM pools in spring are regulated by the seasonal changes of ambient conditions and by their complex effects on ice biota (Meiners et al. Reference Meiners, Norman, Granskog, Krell, Heil and Thomas2011). The upper layer of fast ice is scarcely affected by the biological activity in early spring. It maintains constant nutrient concentrations with ratios that are mostly determined by the conservative freezing of the original seawater (Si:DIN:PO4 = 38:16:1 in top ice, = 37:16:1 in seawater in 1999; Cozzi Reference Cozzi2008). The first process involving nutrients in fast ice is their decrease in the intermediate layer, where the growth of an interior community is favoured by high levels of light penetration and by an increased ice porosity induced by temperatures above -5°C (1–4 μg l-1 of chlorophaeopigments in 1999; Guglielmo et al. Reference Guglielmo, Carrada, Catalano, Cozzi, Dell'anno, Fabiano, Granata, Lazzara, Lorenzelli, Manganaro, Mangoni, Misic, Modigh, Pusceddu and Saggiomo2004, Lazzara et al. Reference Lazzara, Nardello, Ermanni, Mangoni and Saggiomo2007). This process caused the almost complete depletion of PO4 (> 0.01 μmol P l-1) and strong decrease in SiO2 (> 1.40 μmol Si l-1) and NO3 (> 0.41 μmol N l-1). The uptake of NO3 is an interesting feature of this interior community, considering the supposed inhibitory effect exerted by the presence of NH4 (> 3.1 μmol N l-1; Table II). It indicates that, in this layer, irradiance levels are suitable for NO3 assimilation by ice algae as the photoinhibition typical of the top ice is not present (Thomas et al. Reference Thomas, Papadimitriou and Michel2010).
The highest accumulation of nutrients occurs in BI, concurrent with the extreme development of algal biomasses dominated by sympagic diatoms (2480 and 1740 μg l-1 of chlorophaeopigments in 1997 and 1999; Lazzara et al. Reference Lazzara, Nardello, Ermanni, Mangoni and Saggiomo2007). With reference to the unperturbed ice structures observed in 1997 and 1999, these nutrient increases were highly concentrated in a thin bottom layer (c. 10 cm), leading to high levels of NO3 and PO4. By contrast, extreme accumulations of NH4 and PO4 occurred in a thicker layer in 2004. This phenomenon might have easily originated from the remineralization of particulate organic matter (POM; POC < 2767 μmol C l-1 and PON < 420 μmol N l-1; Cozzi & Cantoni Reference Cozzi and Cantoni2011) and even marine organisms trapped in the ice during the refreezing events in August 2004. Several remains of fishes were recovered in the fast ice during the drilling of the cores in Gerlache Inlet in 2004, indicating that a similar refreezing of coastal waters might also act as a significant mortality event for the pelagic compartment.
The persistent abundance of NH4, as well as urea, throughout the whole ice profile is another interesting characteristic of the nutrient pool in fast ice. Since the excretion of these nitrogen-nutrients by copepods occurs almost exclusively in BI and the platelet layer (Guglielmo et al. Reference Guglielmo, Carrada, Catalano, Cozzi, Dell'anno, Fabiano, Granata, Lazzara, Lorenzelli, Manganaro, Mangoni, Misic, Modigh, Pusceddu and Saggiomo2004, Reference Guglielmo, Zagami, Saggiomo, Catalano and Granata2007), and since their atmospheric deposition is scarce, the observed concentrations are thought to be the result of bacterial activity. Few data concerning urea are published in the literature on sea ice. In pack ice, urea was detected in surface gap layers at levels that were enriched compared to seawater (0.1–2.2 μmol N kg-1), which indicated biological origin in these habitats (Papadimitriou et al. Reference Papadimitriou, Thomas, Kennedy, Kuosa and Dieckmann2009). The present study suggests that the concentration of urea in coastal ice systems might be substantially higher.
Spring increase in DOM was strictly associated with the bottom community and lead to extreme concentrations of DOC in 1999 (< 3480 μmol C l-1), whereas the organic matter was trapped in a thicker ice layer and particularly enriched in DON in 2004 (< 599 μmol N l-1). The accumulation of DOM in the bottom layer indicates that its release by sympagic organisms is large enough to overtake the intense degradation caused by high extracellular enzymatic activities (< 24.3 ± 0.7 μmol l-1 h-1 for aminopeptidase, <0.65 ± 0.01 μmol l-1 h-1 for β-glucosidase in 1997; Pusceddu et al. Reference Pusceddu, Dell'Anno, Vezzulli, Fabiano, Saggiomo, Cozzi, Catalano and Guglielmo2009). At the same time, the limited transfer of DOC and DON into higher trophic levels, which was recently ascribed to the effects of algae-bacteria interactions (Pusceddu et al. Reference Pusceddu, Dell'Anno, Vezzulli, Fabiano, Saggiomo, Cozzi, Catalano and Guglielmo2009) or ambient conditions in brine channels (Thomas et al. Reference Thomas, Papadimitriou and Michel2010), favours the generation in sea ice of an assemblage of refractory, proteinaceous and carbohydrate-dominated materials different from that found in pelagic DOM (Norman et al. Reference Norman, Thomas, Stedmon, Granskog, Papadimitriou, Krapp, Meiners, Lannuzel, van der Merwe and Dieckmann2011, Stedmon et al. Reference Stedmon, Thomas, Papadimitriou, Granskog and Dieckmann2011).
In addition to the dynamics of carbon and nitrogen, the present data provides information on the cycling of phosphorus in sea ice. The peaks of nutrients were always characterized by an abundance of DOP in TDP (35–61%) lower than the abundance of DON in TDN (54–85%), suggesting that the remineralization of organic phosphorus might be more efficient compared to that of nitrogen. Despite limited available information, this finding agrees with the particularly high substrate affinity of alkaline phosphatase measured in bacteria isolated from frazil ice and with the enhancement of its activity in the seawater surrounding fast ice after the occurrence of organic inputs due to ice melt (Celussi et al. Reference Celussi, Balestra, Fabbro, Crevatin, Cataletto, Umani and Del Negro2008, Reference Celussi, Paoli, Crevatin, Bergamasco, Margiotta, Saggiomo, Umani and Del Negro2009).
Overall, the complex biogeochemical processes in the bottom communities generates a habitat rich in inorganic phosphorus (DIN/PO4 = 3.4) and often poor in silicon (Si/NO3 + NO2 = 0.3) compared to nitrogen, while opposite oscillations of DIN/PO4 and DON/DOP ratios indicate temporary phases of uptake and regeneration of these elements in a semi-enclosed environment (Table III). These large pools of nutrients can be released into the water column during the phase of ice retreat in mid-spring (Cozzi & Cantoni Reference Cozzi and Cantoni2011). By contrast, the breakout of aged ice sheets that survive along the coast until summer, like that observed at station TB04, release smaller quantities of nutrients into the pelagic environment because this ice has already been impoverished of its biogenic elements by the internal drainage of meltwater.
The platelet layer is characterized by different ambient conditions and by a weaker degree of isolation from the water column compared to BI. As a result, larger contributions of cryopelagic species are observed in this community (Riaux-Gobin et al. Reference Riaux-Gobin, Tréguer, Dieckmann, Maria, Vétion and Poulin2005). In Gerlache Inlet, the growth of platelet microalgae (748 and 716 μg l-1 of chlorophaeopigments in 1997 and 1999, respectively) was favoured by their acclimation to the low levels of light (c. 0.6% of surface photosynthetically available radiation) and to an adaptation to a nutrient replete environment (Lazzara et al. Reference Lazzara, Nardello, Ermanni, Mangoni and Saggiomo2007). During the phase of release of this biomass into the water column, the platelet community is also subjected to a species succession caused by the modifications of ambient conditions (Mangoni et al. Reference Mangoni, Saggiomo, Modigh, Catalano, Zingone and Saggiomo2009).
The present data indicate that nutrient availability in the platelet layer was not dependent solely on the influx of seawater, but also on a large internal remineralization that generated hot spot increases in concentrations, like those observed for NH4 and PO4 in 2004. Nevertheless, the occurrence of temporary phases of isolation of this ice layer from the water column was also demonstrated by the presence of low concentrations of NO3 and SiO2 in IW (Table II). The combination of internal processes and external inputs made the platelet layer a habitat characterized by a large availability of phosphorus both in inorganic (DIN/PO4 = 4.5–10.2) and organic (DON/DOP = 8.6–10.7) pools. The high content of nitrogen and phosphorus in the pool of DOM is consistent with the accumulation of freshly produced organic matter, which occurs in this habitat despite the presence of intense extracellular enzymatic activity (Pusceddu et al. Reference Pusceddu, Dell'Anno, Vezzulli, Fabiano, Saggiomo, Cozzi, Catalano and Guglielmo2009).
Finally, the data retrieved during the three years of observation indicate that the chemistry of the coastal waters is subjected to an evolution that may be subdivided into two main phases. The first phase, until the middle of November, consisted of nutrient-rich wintry waters in which no substantial changes occurred in the concentration of NO3, SiO2, PO4 and DOM. However, there was a decrease in NH4 (3.69–0.28 μmol N l-1 in 1999) and an increase in NO2 (0.01–0.07 μmol N l-1). The uptake of NH4 could be due to a plankton growth below the sea ice in conditions of low irradiance and the increase in NO2 probably indicates the activity of chemoautotrophic nitrifying bacteria, whose presence has been reported in sea ice and associated seawater (Priscu et al. Reference Priscu, Downes, Priscu, Palmisano and Sullivan1990). Low irradiance and high NH4 levels stimulate nitrification, making the surface waters beneath sea ice a similar environment to the base of the photic zone in the open sea (Arrigo et al. Reference Arrigo, Dieckmann, Gosselin, Robinson, Fritsen and Sullivan1995). The second phase included the freshening of seawater due to ice melting and the formation of a stable mixed layer occupied by SSW. In this period, a reduction in the concentration of NO3, PO4 and SiO2 by c. 50% was observed in seawater, with uptake ratios similar to the values typical of a balanced phytoplankton growth. During this phase, ice particulate was released into the water column, generating sedimentary fluxes that may reach the benthic compartment (Fabiano et al. Reference Fabiano, Chiantore, Povero, CattaneoVietti, Pusceddu, Misic and Albertelli1997, Cozzi & Cantoni Reference Cozzi and Cantoni2011).
Budgets of biogeochemical elements in the coastal zone
Fast ice was almost always characterized by similar deficits of NO3 and SiO2 (3 and 5 mmol m-2, respectively) originated by an interior uptake not compensated for by regeneration and external inputs (Fig. 8). Their values were irrespective of the ice thickness and of the total amount of nutrients, as they were the result of the growth of an ice microalgal community that takes place predominantly in the bottom layer. While the NO3 deficit was overcompensated by a strong accumulation of NH4, the most important regenerated nitrogen form in sea ice, the same did not occur for SiO2. The balances of PO4 and DOP in fast ice were often close to equilibrium, with the main exception of episodic massive degradations of organic matter of marine origin entrapped in ice during refreezing. The accumulation of ice DOM observed in 1997 and 1999 (+588.5 mmol C m-2, +34.6 mmol N m-2 and +1.24 mmol P m-2) was comparable to the estimates calculated by Stedmon et al. (Reference Stedmon, Thomas, Papadimitriou, Granskog and Dieckmann2011) for brine. Since the terrestrial inputs of organic matter are negligible in the Antarctic marine environment and the pelagic DOM does not exceed 15% of the ice pool (Wedborg et al. Reference Wedborg, Persson and Larsson2007), this result indicates the importance of sympagic organisms for the accumulation of DOM in the liquid micro-channels inside the ice. Data collected in 2004 indicate that extreme increases in DOM and regenerated nutrients in fast ice can also occur, determining episodic accumulations of biogenic elements that can be released into the water column when the ice melts.
In the platelet layer, the behaviour of the nutrients was different to that observed in fast ice, due to the effects of an easier exchange of elements with the water column. Highly positive or negative budgets occurred for NO3 depending on the temporary prevalence of regeneration or uptake, whereas the balance of TDN was always positive due to the large contribution of DON (Fig. 9). The balance of SiO2 varied from near depletion to levels approaching those of seawater, confirming the importance of the external supply of this nutrient. The cycling of phosphorus and its partitioning between PO4 and DOP pools seemed to be similar to that of fast ice.
The importance of the ice system for the biogeochemistry of this Antarctic coastal zone can be inferred from the integration of these data. The area covered by annual fast ice shown in Fig. 1 (c. 1320 km2), estimated in spring along a section of coast c. 320 km in length, corresponds to a mean ice extension offshore of 4 km. However, this value is mainly due to the largest ice covers in Wood and Lady Newnes bays. The characteristics of this coastal ice are similar to those reported in other zones like Terre Adélie (Riaux-Gobin et al. Reference Riaux-Gobin, Tréguer, Dieckmann, Maria, Vétion and Poulin2005) and Prydz Bay (Lei et al. Reference Lei, Li, Cheng, Zhang and Heil2010).
Median budgets for ice nutrients ranged from 32 kg P km-2 for PO4 to 632 kg Si km-2 for SiO2 (Table IV). These budgets represent a high accumulation of NH4 in fast ice (+173 kg N km-2) and the platelet layer (+21 kg N km-2) compared to the equivalent content in seawater, as well as a strong SiO2 deficit in both cases (-153 and -81 kg Si km-2). Even more important is the extreme accumulation of DOM, which reached +3890 kg C, +455 kg N and +41 kg P per 1 km2 of ice surface. If these values are compared to the highest integrated ice biomass reported in Gerlache Inlet (280 kg km-2; Lazzara et al. Reference Lazzara, Nardello, Ermanni, Mangoni and Saggiomo2007), it may be concluded that, although the standing stocks of sympagic microalgae are large, the most important biogeochemical role of the fast ice system is to be an environment where a large transition from POM to DOM occurs. Moreover, the accumulation of DOC in fast ice significantly exceeds what has recently been estimated for pack ice (500 kg C km-2 year-1; Norman et al. Reference Norman, Thomas, Stedmon, Granskog, Papadimitriou, Krapp, Meiners, Lannuzel, van der Merwe and Dieckmann2011), indicating that the potential release of organic matter generated in coastal ice systems might largely overtake that in the Antarctic open sea areas.
Table IV Integrated quantity (N) and balance (dN) of nutrients and dissolved organic matter in fast ice and the platelet layer (kg km-2). For comparison, nutrient balance in the seawater column (150 m of depth) from 8 November to 22 December 2004 is also shown.
Q1 = first quartile, Q3 = third quartile.
The estimate for the platelet layer is made assuming a mean thickness of 50 cm.
Nutrient removal and DOM accumulation in the water column resulting from pelagic production processes during late spring are greater than the inputs from fast ice, although the ice is still an important source of NH4 and DOP (Table IV). However, the importance of fast ice far exceeds its nutrient budget, as the ice behaves as a compartment that connects the cycles of biogenic elements in these coastal zones. This role of fast ice has recently been highlighted with reference to carbon cycling and its consequences on climate change (Loose et al. Reference Loose, Miller, Elliott and Papakyriakou2011). During winter, the formation of sea ice leads to the rejection of brine with high total carbon dioxide (TCO2) content and the scavenging in the water column of solid calcium carbonate (CaCO3) precipitated inside the ice. These processes increase the concentration of inorganic carbon in the dense waters sinking from the polar regions into the abyssal system, contributing to the sequestration of CO2 from the atmosphere. In summer, this mechanism is absent as brine and seawater in the upper layer are under-saturated with respect to TCO2 because of the primary production (Rysgaard et al. Reference Rysgaard, Glud, Sejr, Bendtsen and Christensen2007). In addition, as the present study shows, in the middle of these two opposite phases, the ice also acts as a source of organic carbon for the marine environment. This organic matter can reach deeper waters and sediments, or be remineralized to CO2 by pelagic and benthic microbial activities.
Conclusion
Katabatic wind peaks in July–August (> 27 m s-1) are the major forcings that determine the interannual variability of the thickness (1.0–2.5 m) and physical characteristics of fast ice in the inner bays of the Victoria Land coast. The increase in heat content in the upper water column and high fluxes of meltwater (0.03 m d-1) in late spring trigger the transition from highly homogeneous nutrient-rich HSSW to stratified SSW, which are impoverished in nutrients due to pelagic production.
Fast ice growth is accurately modelled by Zubov's Law extended to ice-atmosphere coupling when breakout events are absent. The model may underestimate thickness due to formation of a thin bottom layer (c. 10 cm) that originates from the consolidation of platelets floating in the water column. The inverse application of this law proved to be a useful tool to estimate the timing of formation of ice when field observations or satellite imagery were not available, indicating that the fast ice in this area is often only 2–5 months old.
The short-term variability of brine content, drainage of meltwater and salinity in BI and IW is modulated by spring oscillations of the atmospheric conditions. These physical changes, in combination with an enhanced biological activity, modify the initial pools of nutrients and DOM entrapped in the ice during seawater freezing in winter, determining distinct trends of the biogenic elements in the different ice horizons. However, despite this internal heterogeneity, the budgets of ice nutrients and DOM show clear overall features. Fast ice is a compartment where a large biomass consumes NO3 and SiO2, produces DOM, including urea, and regenerates NH4 in an environment usually not affected by deep phosphorus-deficiencies due to the fast internal recycling of this element. The largest accumulation of DOM is highly localized in BI and the platelet layer, but a broad entrapment of organic materials and marine organisms may also occur as a result of the refreezing of coastal waters. The major role played by sea ice in this coastal Antarctic zone in winter is the physical mechanism of dense water formation in the polynya, whereas the accumulation of organic matter and its release in the water column is its most important contribution to the biogeochemistry of this ecosystem during spring.
Acknowledgements
This study was based on the field activity carried out during PIPEX, PIED and SEAROWS research projects, funded by the National Programme of Research in Antarctica (PNRA) of Italy. I would like to thank the logistic support of the Italian Mario Zucchelli Station and the colleagues involved in the field activity. I am also grateful to the reviewers for constructive comments on this paper.


