


Introduction
Natural environments around the world have been affected by oil spills. The transport and storage of petroleum-derived fuels are often sources of soil contamination (Aislabie & Foght Reference Aislabie and Foght2010) and are a serious threat to unique and sensitive environments, such as Antarctica, which possesses the last remaining pristine zones on Earth (Delille et al. Reference Delille, Coulon and Pelletier2004). Physical and chemical methods are generally applied in attempts to clean up petroleum hydrocarbon-polluted soils (Ferguson et al. Reference Ferguson, Woinarski, Snape, Morris and Revill2004). However, the utilization of the machinery necessary for the application of physical methods on Antarctic soils is very expensive, whereas the application of chemical methods can be quite dangerous when considering the risk of additional environmental impacts. Therefore, bioremediation techniques have been considered an appropriate remediation technology for Antarctic soils (Aislabie & Foght Reference Aislabie and Foght2010).
The hydrocarbon degradation potential of microbial communities has been demonstrated in different Antarctic soils, and in other cold ecosystems, such as in Arctic soils (Aislabie et al. Reference Aislabie, Ryburn and Sarmah2008, Flocco et al. Reference Flocco, Gomes, MacCormack and Smalla2009, Panicker et al. Reference Panicker, Mojib, Aislabie and Bej2010, Bell et al. Reference Bell, Yergeau, Martineau, Juck, Whyte and Greer2011, Reference Bell, Yergeau, Maynard, Juck, Whyte and Greer2013). Using microbial culture-based methods, Aislabie et al. (Reference Aislabie, Ryburn and Sarmah2008) isolated different hydrocarbon-degrading bacteria related to Gram-positive Gordonia and Rhodococcus genera from polluted ornithogenic Antarctic soils and showed that aliphatic hydrocarbon mineralization in these soils could occur at 4°C and 15°C. It has also been reported that oil-degrading bacteria isolated from hydrocarbon-polluted cold soils generally belong to Gram-positive Rhodococcus and Arthrobacter, and Gram-negative Acinetobacter, Sphingomonas and Pseudomonas (Aislabie & Foght Reference Aislabie and Foght2010, Panicker et al. Reference Panicker, Mojib, Aislabie and Bej2010).
Culture-based methods can mask the actual diversity of the microbial communities present in polluted and unpolluted Antarctic soils. Recent molecular-based studies in cold hydrocarbon-contaminated Arctic soils showed that the predominant microbial composition changed based on the time of soil contamination (Yergeau et al. 2012), and on the carbon and nitrogen sources available to the microbial community (Bell et al. Reference Bell, Yergeau, Martineau, Juck, Whyte and Greer2011, Reference Bell, Yergeau, Maynard, Juck, Whyte and Greer2013). Additional studies have been performed in attempts to identify key genes of bacterial hydrocarbon degradation pathways, such as genes coding for alkane monooxygenase (alkB) (Powell et al. Reference Powell, Bowman, Ferguson and Snape2010, Bell et al. Reference Bell, Yergeau, Martineau, Juck, Whyte and Greer2011, Yergeau et al. 2012, Jurelevicius et al. Reference Jurelevicius, Alvarez, Peixoto, Rosado and Seldin2013) and ring-hydroxylation dioxygenases (RHDs) (Flocco et al. Reference Flocco, Gomes, MacCormack and Smalla2009, Jurelevicius et al. Reference Jurelevicius, Alvarez, Peixoto, Rosado and Seldin2012a, Yergeau et al. 2012). Interestingly, the results obtained also revealed the presence of genes that are not commonly detected in hydrocarbon-degrading bacterial species typically isolated from polluted Antarctic soils (Powell et al. Reference Powell, Bowman, Ferguson and Snape2010, Jurelevicius et al. Reference Jurelevicius, Alvarez, Peixoto, Rosado and Seldin2012a, Reference Jurelevicius, Alvarez, Peixoto, Rosado and Seldin2013).
Different factors may affect the hydrocarbon degradation potential of microbial communities. The depletion of nutrients (particularly nitrogen and phosphorus) in petroleum hydrocarbon-polluted soils may decrease microbial activity and potentially increase contaminant recalcitrance in polluted soils (Atlas & Hazen Reference Atlas and Hazen2011). Although biostimulation, i.e. the addition of fertilizers, is an alternative strategy for overcoming this problem (Delille et al. Reference Delille, Coulon and Pelletier2004, Bell et al. Reference Bell, Yergeau, Maynard, Juck, Whyte and Greer2013), the determination of the precise concentration of fertilizers has been considered a challenge for these methods. For example, an excess level of fertilizer can inhibit hydrocarbon biodegradation by decreasing the soil water potential, whereas a low concentration may have little effect on microbial hydrocarbon degradation rates (Aislabie & Foght Reference Aislabie and Foght2010). The positive, negative and neutral effects of biostimulation have all been described in the literature (Delille et al. Reference Delille, Coulon and Pelletier2004, Alvarez et al. Reference Alvarez, Marques, Korenblum and Seldin2011).
Diesel oil contaminated soils near the Brazilian Antarctic scientific station Estação Antártica Comandante Ferraz (EACF) may encompass different microbial communities that have been previously selected by the amount of total petroleum hydrocarbons (TPH). Therefore, the aim of this work was to characterize the bacterial, archaeal and microeukaryotic diversity from low (LC) and high (HC) diesel oil contaminated Antarctic soils. Moreover, different microcosms were constructed to simulate the effect of different doses of fertilizer on the depletion of hydrocarbons in LC and HC soils. The results would provide valuable information for developing an efficient and suitable alternative treatment for remediating oil pollution in Antarctic soils.
Materials and methods
Site description and sampling
All necessary permits were obtained for the field studies described. The sampling site was located in front of EACF station (Fig. S1 found at http://dx.doi.org/10.1017/S0954102014000728). A previous analysis had indicated that the soils near the fuel tanks contained variable concentrations of TPHs in the subsurface (data not shown). Approximately 500 g of soil was collected in triplicate from five different sampling sites near EACF in March 2010 (Fig. S1; see the GPS position in Table I). At the time of collection, the average air temperature in this area was 1.1°C, with an average daily maximum of 3.3°C and an average daily minimum of -1.0°C (means for March 1986–2010, http://antartica.cptec.inpe.br). Soil samples were maintained at ≈ 4°C for c. 20 days until the laboratory analyses. The physico-chemical properties of the soil samples were analysed as described in Simas et al. (Reference Simas, Schaefer, Melo, Albuquerque-Filho, Michel, Pereira, Gomes and da Costa2007). The TPH content of each sampling site was analysed as described in Bícego et al. (Reference Bícego, Taniguchi, Yogui, Montone, Da Silva, Lourenço, Martins, Sasaki, Pellizari and Weber2006). Briefly, each triplicate sample was pooled, mixed and oven-dried at 50°C for 4–5 days. Further, 25 g of each sample was Soxhlet-extracted with a 50% mixture of residue grade n-hexane and dichloromethane for 8 hours. The hydrocarbon extracts were then fractionated into F1 (aliphatics) and F2 (aromatics) using a silica gel-alumina chromatography column. Aliphatic hydrocarbons were determined on a Hewlett Packard 5890 II high-resolution gas chromatograph equipped with flame ionization detector (GC-FID). Polycyclic aromatic hydrocarbons (PAH) were quantitatively analysed by an Agilent 6890 gas chromatograph coupled to a 5973N mass spectrometer (GC-MS) in the selected ion monitoring (SIM) mode (Bícego et al. Reference Bícego, Taniguchi, Yogui, Montone, Da Silva, Lourenço, Martins, Sasaki, Pellizari and Weber2006).
Table I Chemical and biological characteristics of the soil samples collected within the vicinity of the Brazilian Antarctic station.

n.d.=not detected.
Values in parentheses represent the standard deviation between triplicates.
Soil DNA extraction
Total DNA extraction of the microbial communities present in the soil samples was performed using the Fast DNA Spin Kit for soil (QBIOgene, Carlsbad, CA) following the manufacturer’s instructions. The integrity of the extracted DNA was confirmed by electrophoresis using a 0.8% agarose gel with 0.5× TBE buffer (45 mM Tris-borate and 1 mM EDTA, pH 8.0).
Quantification and molecular detection of hydrocarbon-degrading microorganisms
The most probable number (MPN) technique (Maturin & Peeler Reference Maturin and Peeler2001) was used to estimate hydrocarbon-degrading microorganisms: 5 g of each soil sample was placed in 125 ml flasks containing 45 ml of saline solution (0.85%) and shaken for 1 hour at 120 rpm. A 200 µl aliquot of this microbial suspension was then used for serial dilutions in 24-well plates containing 1.8 ml of Bushnell Haas medium with 2% (v/v) of ‘diesel Arctic oil’ (DFA) as the sole carbon source. The plates were incubated at 4°C for 7 days, and the number of hydrocarbon-degrading microorganisms was calculated according to Maturin & Peeler (Reference Maturin and Peeler2001). The same procedure was performed for counting the heterotrophic bacterial cells by replacing the addition of diesel oil with yeast extract as the carbon source.
In addition, the indigenous bacterial hydrocarbon-degrading potential was analysed by PCR using specific primers for the amplification of biomarker genes of bacterial: i) aerobic alkane degradation (Chenier et al. Reference Chenier, Beaumier, Roy, Driscoll, Lawrence and Greer2003), ii) aerobic PAH degradation (Cébron et al. Reference Cébron, Norini, Beguiristain and Leyval2008), iii) anaerobic aromatic degradation (Kuntze et al. Reference Kuntze, Shinoda, Moutakki, McInerney, Vogt, Richnow and Boll2008), and iv) anaerobic aliphatic and aromatic hydrocarbon degradation (Callaghan et al. Reference Callaghan, Davidova, Savage-Ashlock, Parisi, Gieg, Suflita, Kukor and Wawrik2010). The target genes for each hydrocarbon degradation pathway and the list of primers are described in Table II. The PCR reactions and conditions were the same as previously described for each pair of primers (Table II).
Table II List of primers used in this study.

aA GC clamp was attached at the 5’ position of these primers for denaturing gradient gel electrophoresis (DGGE).
PAH=polycyclic aromatic hydrocarbons, SSU=small-subunit.
Small-subunit rRNA library sequencing
To evaluate the effect of hydrocarbon contamination in prokaryotic and microeukaryotic communities, the soil samples were mixed in two main groups based on TPH levels: the high hydrocarbon-polluted mixture (HC) consisted of 1:1:1 (w/w) of soil from sample sites 1, 2 and 3 (containing higher amounts of TPH), the low hydrocarbon-polluted mixture (LC) consisted of 1:1 (w/w) of soils from sample sites 4 and 5 (containing lower amounts of TPH). These soil mixtures were used for the microcosm experiments following the procedure described below. Furthermore, the community structures of the archaea, bacteria and eukaryote domains were analysed by sequencing the small-subunit (SSU) rRNA genes obtained by PCR amplification with DNA extracted from the HC and LC soils as the template. The primer pairs used for the PCR amplification of the SSU rRNA genes of the bacteria (Mills et al. Reference Mills, Martinez, Story and Sobecky2004), archaea (Bano et al. Reference Bano, Ruffin, Ransom and Hollibaugh2004) and eukaryote (Moon-van der Staay et al. Reference Moon-van der Staay, de Wachter and Vaulot2001) domains are described in Table II, and the PCR conditions were the same as those described in the references cited.
For library constructions, 150 µl of PCR product was purified using the QIAquick Gel Extraction Kit (QIAGEN Biotecnologia, Sao Paulo) according to the manufacturer’s instructions. Purified amplicons were ligated to the pGEM® T Easy Vector plasmid (Promega, Rio de Janeiro), and the ligation products were transformed into competent Escherichia coli DH5-α cells. Positive clones were grown in LB medium, and the extraction of the plasmids was performed using the miniprep alkaline lysis method (Sambrook & Russell Reference Sambrook and Russell2001). Sequencing of the inserts was performed using the Big Dye Terminator system and an ABI-3730 automatic capillary sequencer (Applied Biosystems, Carlsbad, CA).
Sequence analysis
The electropherogram files generated by sequencing were processed using the Phred programme (Ewing & Green Reference Ewing and Green1998) for base-calling and trimming of vector and low-quality (<20) sequences. The high-quality sequences located between the rRNA primers were used for further analysis. The sequences were chimera-checked using the Mallard programme (Ashelford et al. Reference Ashelford, Chuzhanova, Fry, Jones and Weightman2006), and the putative chimeras were excluded from further analysis. Additional downstream analyses were performed using MOTHUR software (Schloss et al. Reference Schloss, Westcott, Ryabin, Hall, Hartmann, Hollister, Lesniewski, Oakley, Parks, Robinson, Sahl, Stres, Thallinger, van Horn and Weber2009). All sequences were aligned using the bacterial, archaeal and eukaryotic sequences from the Silva Database Project (www.arb-silva.de) as the template, and the sequences were assigned to operational taxonomic units (OTUs) with 97% similarity. The matrices generated were used to calculate the species richness using Chao1 (Chao Reference Chao1987) and ACE (Chao & Lee Reference Chao and Lee1992) estimators, rarefaction curves and the Shannon–Weaver diversity index (Shannon & Weaver Reference Shannon and Weaver1949) using MOTHUR with default parameters. Good’s coverage estimator was used to calculate the sample coverage with the formula C=1-(ni/N)×100 (Good & Toulmin Reference Good and Toulmin1956), where N is the total number of sequences analysed and ni is the number of reads that occurred only once among the total number of reads analysed using MOTHUR0.03. Thereafter, representative sequences for each OTU from the bacteria, archaea and eukaryotic libraries were taxonomically assigned using the Ribosomal Database Project’s Naïve Bayesian classifier (Wang et al. Reference Wang, Garrity, Tiedje and Cole2007) in the Silva Database Project (www.arb-silva.de) with a confidence level of 80%.
Nucleotide sequence accession numbers
The sequences generated by the clone libraries were deposited in GenBank under the accession numbers JF281299-JF281731 (18S rRNA libraries), JF303478-JF303637 and JQ420136-JQ420368 (bacterial 16S rRNA libraries), and JQ420369-JQ420801 (archaeal 16S rRNA libraries).
Evaluation of fertilizer doses for biostimulation in a microcosm experiment
The HC and LC mixtures were used for the microcosm construction. The microcosm experiment was performed in triplicate for each treatment in 288.5 cm3, non-transparent polyvinyl chloride (PVC) flasks containing ≈1.5 kg (wet weight) of each soil mixture. Biostimulation was evaluated by the addition of monoammonium phosphate (MAP; powder: 12% N and 61% P2O5), and five fertilizer doses were tested: 0, 125, 250, 375 and 500 mg N kg-1 of soil. The microcosms were maintained at a temperature between 2–5°C and a photoperiod of 12:12 hours. Every 2 days, ≈10 ml of deionized water was added to each replicate to avoid desiccation. After 2 months, microcosm samples were collected for molecular, physical and chemical analyses. The DNA extraction and physical and chemical analyses of the soils of the microcosms were performed as described above.
Denaturing gradient gel electrophoresis analyses of prokaryotic communities
Denaturing gradient gel electrophoresis (DGGE) was used to analyse the archaeal and bacterial communities present in the microcosm soils. The 16S rRNA genes of the archaea and bacteria domains were PCR amplified using the primers presented in Table II. The DGGE of the PCR products was performed using the DCode universal mutation detection system (Bio-Rad DCode, Richmond, VA), as described in Jurelevicius et al. (Reference Jurelevicius, Cotta, Peixoto, Rosado and Seldin2012b). The 6% (w/v) polyacrylamide gels were formulated with a denaturing gradient ranging from 40–65% for bacteria and 40–70% for archaea. To compare the profiles generated from the different treatments (five fertilizer doses) in the same gel, only two of the three replicates (R1 and R2) of the microcosm experiment were used.
After electrophoresis, the gels were stained with SYBR Gold nucleic acid gel stain (Molecular Probes, Leiden) for 40 minutes and then scanned using a Storm PhosphorImager (Amersham Biosciences, Uppsala). The analysis of the DGGE profiles was performed using the BioNumerics version 5.10 software package (Applied Maths, St-Martens-Latem). A dendrogram was constructed for each gel using Jaccard correlation coefficients, and a cluster analysis was performed using the unweighted pair group method with arithmetic mean (UPGMA) method.
Results
Soil characteristics
The physical and chemical characteristics of the collected soils are presented in Table I. Nitrogen was not detected in any of the collected soil samples with the method used. Furthermore, a linear decrease in the amount of TPHs from sampling point 1 (426 mg kg-1) to sampling point 5 (82 mg kg-1) was observed (Table I), and the mean TPH content of soil samples 1, 2 and 3 was at least 3-fold higher than in soil samples 4 and 5.
Bacterial counts and the detection of genes related to bacterial hydrocarbon degradation
The MPN results showed that the number of cultivable heterotrophic bacteria was approximately 108 cells g-1 soil in all the soil samples (Table I), although the MPN of hydrocarbon-degrading bacteria varied between the soil samples. The highest number of hydrocarbon-degrading bacteria was found in the soil from sampling point 2 (108 cells g-1), whereas the lowest was found in the soil from sampling point 3 (106 cells g-1) (Table I).
The results from the PCR amplification of key bacterial hydrocarbon degradation genes are shown in Table III. Biomarker genes of aerobic alkane degradation and of anaerobic aromatic hydrocarbon degradation were detected in all soil samples (Table III). By contrast, biomarker genes related to aerobic PAH degradation were only detected in the soils from sampling points 1, 2 and 3 (Table III), and biomarker genes of anaerobic aliphatic degradation were only detected in the soils from sampling points 3, 4 and 5 (Table III).
Table III PCR amplification of bacterial hydrocarbon degradation genes in the different soil samples.

aTriplicates of each sampling point were used in the PCR amplifications.
bTarget genes are as follows: alkB (alkane monooxygenase AlkB), RHDα (α-subunit of PAH ring-hydroxylating dioxygenases), bamA (6-oxocyclohex-1-ene-1-carbonyl-coenzyme A hydrolases) and assA/bssA (benzyl- and alkylsuccinate synthase genes, respectively).
PAH=polycyclic aromatic hydrocarbons.
Microbial diversity
To evaluate the effect of hydrocarbon contamination on bacterial, archaeal and microeukaryotic communities, DNA extracted from HC and LC soils was used as the template for PCR reactions. Furthermore, clone libraries of the partial SSU rRNA gene were constructed, and a total of 393, 433 and 433 clones were sequenced from the bacteria, archaea and eukaryote libraries, respectively. The sequences were clustered into OTUs (0.03% cut-off), representing 91, 71 and 96 unique OTUs of bacterial, archaeal and eukaryotic communities, respectively (Table IV). The richness and diversity indices (Table IV) and rarefaction curves (Fig. S2 found at http://dx.doi.org/10.1017/S0954102014000728) indicate that the LC soils presented higher microeukaryotic and bacterial diversity than the HC soils. Nonetheless, significant differences in the archaeal community were not observed between the HC and LC soils (Table IV and Fig. S2).
Table IV Estimated operational taxonomic units (OTU) richness, diversity and estimated sample coverage for small-subunit (SSU) rRNA libraries obtained from Antarctic high total petroleum hydrocarbon (TPH) content (HC) and low TPH content (LC) soil samples, calculated with MOTHUR0.03.

a Calculated with MOTHUR at the 3% distance level.
b Shannon–Weaver diversity index (Shannon & Weaver Reference Shannon and Weaver1949).
c ESC=estimated sample coverage: Cx=1-(Nx/n), where Nx is the number of unique sequences and n is the total number of sequences (Good & Toulmin Reference Good and Toulmin1956).
Values in parentheses represent the confidence intervals.
Bacterial communities
The relative abundance of the major microbial taxonomic groups detected in the soils using the RDP-Classifier is presented in Figs 1, 2 & 3 (bacteria, archaea and microeukaryotes, respectively). Considering the bacteria domain, a high relative abundance of sequences affiliated with Proteobacteria, Actinobacteria and Bacteroidetes phyla was observed in the HC and LC soils (Fig. 1a). However, the results showed differences between the bacterial community composition of the LC and HC soils. For example, sequences related to the Nitrospira, Verrucomicrobia, Chloroflexi, Planctomycetes, and Acidobacteria phyla were only detected in the low-polluted soil library (LC) (Fig. 1a). In addition, only 0.03% of the bacterial OTUs (0.03% cut-off) were found simultaneously in the LC and HC soils. At the genus level, the results showed that the OTU with the highest relative abundance obtained from the HC soil was affiliated with an uncultured bacterium from candidate division TM7 (17.60% in HC and 0.13% in LC). Other OTUs also displayed a higher relative abundance in the library obtained from the HC soil than from the LC soil, such as OTUs affiliated with uncultivated Corynebacterineae (9.98% in HC and 2.70% in LC), Flavobacterium (7.69% in HC and 3.37% in LC) and Conexibacteraceae (4.39% in HC and 0.67% in LC) (Fig. 1b).

Fig. 1 Taxonomic distribution of the partial bacterial 16S rRNA sequences in clone libraries. The samples were named based on total petroleum hydrocarbon levels: the high hydrocarbon-polluted mixture (HC) and the low hydrocarbon-polluted mixture (LC). a. Phylum level classification. b. Genus level classification.
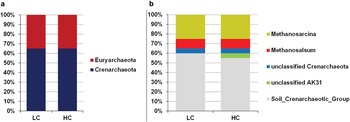
Fig. 2 Taxonomic distribution of the partial archaeal 16S rRNA sequences in clone libraries. The samples were named based on total petroleum hydrocarbon levels: the high hydrocarbon-polluted mixture (HC) and the low hydrocarbon-polluted mixture (LC). a. Phylum level classification. b. Genus level classification.

Fig. 3 Taxonomic distribution of the partial 18S rRNA sequences in clone libraries. The samples were named based on TPH levels: the high hydrocarbon-polluted mixture (HC) and the low hydrocarbon-polluted mixture (LC). a. Phylum level classification. b. Genus level classification.
Archaeal communities
The archaeal community was similar between the LC and HC soils, and 48.15% of the OTUs were found simultaneously in both soils. The taxonomic classification of OTUs showed that the Crenarchaeota and Euryarchaeota phyla represented 65% and 35% of the OTUs, respectively, obtained from the HC and LC soils (Fig. 2a). All the Euryarchaeota-related OTUs were affiliated with the Methanomicrobia class from Methanosalsum (10% of the relative abundance in both soils) and Methanosarcina genera (25% of the relative abundance in both soils). Among the Crenarchaeota, unclassified archaea from the Soil Crenarchaeotic Group represented 55% and 60% of the relative abundance of sequences obtained in the libraries from the HC and LC, respectively (Fig. 2b).
Eukaryotic communities
The distribution of eukaryotic groups in the HC and LC soils was also affected by the TPH concentration, with only 0.04% of the OTUs simultaneously found in these soils (data not shown). A more complex eukaryotic community was observed in the LC soils than in the HC soils (Fig. 3a). Although ten main eukaryotic groups were detected in the LC soils, only four eukaryotic groups were detected in the more contaminated soils (HC). The eukaryotic groups Cryptophyta, Euglenozoa, Metazoa, Rhizaria and Heterokont were only detected in the LC soil. Fungi represented >50% of the relative abundance of the eukaryotic community observed in the HC soil (20.85% in LC), whereas the OTUs affiliated with the Viridiplantae group represented 34.60% of the relative abundance of the eukaryotic community in the LC soil (21.74% in HC) (Fig. 3a). At a deeper phylogenetic level, the results showed that the fungal community from the HC soil was mainly represented by an OTU affiliated with an uncultivated Pezizomycotina (37.86% in HC and 0.94% in LC). By contrast, only a slight difference was observed among the Viridiplantae group present in both the HC and LC soils, and an OTU affiliated with an uncultivated Chlorokybus genus represented 18.01% and 21.80% of the libraries obtained from the HC and LC soils, respectively (Fig. 3b).
The effect of fertilizer application in TPH degradation
The effectiveness of the application of different fertilizer doses in TPH degradation was estimated using microcosms. The HC and LC soil samples were used for microcosm construction, and five MAP doses were tested for the HC and LC (0, 125, 250, 300 and 500 mgNkg-1 of soil). After 60 days, both the high- and low-polluted microcosms resulted in increased hydrocarbon degradation values in relation to the untreated microcosms (Table V). Nevertheless, the best fertilizer doses were dependent on the TPH concentration in the soil. For example, in the LC soil, the highest degradation value was obtained from the microcosms treated with 125 mgNkg-1 of soil (22.18% more hydrocarbon degradation when compared with the untreated microcosms). By contrast, the application of higher doses of MAP (from 200–500 mg Nkg-1) to the HC soil resulted in higher TPH degradation values (18–27% more hydrocarbon degradation when compared with the untreated microcosms). However, when only the alkane fraction of TPH was considered, the results showed that the application of 500 mgNkg-1 of soil resulted in the highest degradation value for the LC and HC microcosms. In addition, a very low amount of nitrogen was detected in all the treated microcosms after 60 days of incubation (Table V).
Table V Physico-chemical characteristics of the microcosm treatments.

a Calculated comparing the results with the values obtained using the untreated microcosms (LC0 and HC0).
N=nitrogen, n.d.=not detected, TPH=total petroleum hydrocarbon.
Values in parentheses represent the standard deviation among triplicates.
The effect of fertilizer concentration on prokaryotic communities was also evaluated by a molecular fingerprint analysis using microcosms that received 0, 250 and 500 mgNkg-1 of soil. The dendrograms generated after the DGGE analysis showed that the bacterial and archaeal communities exhibited the same pattern of hierarchical clustering after 60 days of incubation (Fig. 4). The results for both the archaeal and bacterial communities revealed the following: i) the microcosm duplicates always grouped together, showing the reproducibility of the prokaryotic communities in the microcosms, ii) the formation of two main groups in the dendrograms (LC and HC groups) based on the TPH concentration in the soils, and iii) within the LC and HC groups, the presence and concentration of fertilizer affected the structural patterns of the prokaryotic communities (Fig. 4).

Fig. 4 Denaturing gradient gel electrophoresis (DGGE) profiles of PCR amplified 16S rRNA gene fragments of the a. bacterial and b. archaeal communities. Two samples of each treatment were used. The numbers after the letters C (corresponding to the high hydrocarbon-polluted mixture; HC) or N (corresponding to the low hydrocarbon-polluted mixture; LC) indicate the amount of nitrogen added (mg kg-1). The numbers after the letter R indicate the microcosm repetition.
Discussion
Understanding the distribution of microbial communities in petroleum hydrocarbon-polluted Antarctic soils is of extreme importance due the difficulty of applying soil remediation techniques in this region and the singular environmental conditions of the continent. The presence of hydrocarbon-degrading bacteria in Antarctic soils has been previously demonstrated (Aislabie et al. Reference Aislabie, Ryburn and Sarmah2008, Flocco et al. Reference Flocco, Gomes, MacCormack and Smalla2009, Panicker et al. Reference Panicker, Mojib, Aislabie and Bej2010). However, the molecular surveys in the present study showed that the hydrocarbon-degrading bacteria (gene-target PCR) were not homogeneously distributed in the soil samples from King George Island. The distribution of detectable hydrocarbon-degrading bacteria depends on the fraction and concentration of available hydrocarbons (Flocco et al. Reference Flocco, Gomes, MacCormack and Smalla2009, Jurelevicius et al. Reference Jurelevicius, Alvarez, Peixoto, Rosado and Seldin2012a). Powell et al. (Reference Powell, Bowman, Ferguson and Snape2010) showed that the TPH concentration is an important factor that influences bacterial and hydrocarbon-degrading bacterial communities in sub-Antarctic soils. In addition, using DGGE followed by partition of variances analyses, Jurelevicius et al. (Reference Jurelevicius, Cotta, Peixoto, Rosado and Seldin2012b) showed that TPH may contribute 14.1% of the hydrocarbon-degrading bacteria variability in Antarctic soils.
The effect of hydrocarbon contamination on microbial communities, considering the three domains of life, is not completely understood and has not been elucidated in Antarctic soils. Our results showed that, with the exception of the archaea domain, a high TPH concentration resulted in a decrease in the richness and diversity of the bacteria and eukaryote domains. Two main reasons can explain the decrease in bacterial and microeukaryotic diversity: i) the enrichment of specific hydrocarbon-degrading microorganisms by the high availability of hydrocarbons, as suggested by Atlas & Hazen (Reference Atlas and Hazen2011), and ii) the toxic effect of different petroleum hydrocarbons on microbial communities (Ball & Truskewycz Reference Ball and Truskewycz2013). The toxic effect of TPH may explain the absence of different bacterial phyla (Nitrospira, Verrucomicrobia, Chloroflexi, Planctomycetes and Acidobacteria) and eukaryotic groups (Metazoa, Amoebozoa, Euglenozoa and Stramenopiles) in soil with a higher TPH concentration, as observed in our study.
Using molecular approaches, the hydrocarbon-degrading bacteria typically isolated from Antarctic soils (Aislabie et al. Reference Aislabie, Ryburn and Sarmah2008, Panicker et al. Reference Panicker, Mojib, Aislabie and Bej2010) or detected in hydrocarbon-contaminated Arctic soils (Bell et al. Reference Bell, Yergeau, Martineau, Juck, Whyte and Greer2011, Reference Bell, Yergeau, Maynard, Juck, Whyte and Greer2013), usually belonging to Proteobacteria or Actinobacteria phyla, were detected in a low relative abundance in the highly polluted soils in this study. However, uncultured bacteria affiliated with candidate division TM7 was the group most often found in soil with a high TPH concentration. Bacteria from candidate division TM7 are almost always described using molecular methods (Hugenholtz et al. Reference Hugenholtz, Tyson, Webb, Wagner and Blackall2001) and have rarely been cultivated to date (Ferrari et al. Reference Ferrari, Winsley, Bergquist and van Dorst2012). Accordingly, the possible function of the bacteria from candidate division TM7 in hydrocarbon degradation is unknown. Nevertheless, Hamamura et al. (Reference Hamamura, Olson, Ward and Inskeep2006) observed the enrichment of bacteria affiliated with candidate division TM7 while studying bacterial communities present in different petroleum-contaminated soils from the United States.
The high relative abundance of microeukaryotic OTUs related to the Pezizomycotina subdivision (Fungi) in soil with a high TPH concentration is consistent with the data obtained by Ferrari et al. (Reference Ferrari, Zhang and van Dorst2011), where different fungal species from the Pezizomycotina subdivision were isolated from diesel fuel-contaminated sub-Antarctic soils. Moreover, Bell et al. (Reference Bell, Hassan, Lauron-Moreau, Al-Otaibi, Hijri, Yergeau and St-Arnaud2014) described the association of Pezizomycotina members in the phytoremediation process of highly contaminated soils, and Moktali et al. (Reference Moktali, Park, Fedorova-Abrams, Park, Choi, Lee and Kang2012) showed that the genomes of Pezizomycotina members present numerous genes coding for hydrocarbon degradation pathways, such as genes coding for cytochrome P450. Altogether, these results suggest the importance of Pezizomycotina in hydrocarbon degradation.
Moreover, the microbial communities observed in the high- and low-polluted soils suggest the presence of complex hydrocarbon-degrading communities in the King George Island soil samples. Therefore, the bioremediation of Antarctic soils may occur naturally if the nutrient conditions found in the soil support microbial growth. However, the low level of nitrogen observed in Antarctic soils would reduce microbial metabolism and pollution degradation rates (Aislabie & Foght, Reference Aislabie and Foght2010). As suggested previously, biostimulation appears to be a valuable method to increase the hydrocarbon degradation in cold temperature soils (Delille et al. Reference Delille, Coulon and Pelletier2004, Aislabie & Foght, Reference Aislabie and Foght2010, Bell et al. Reference Bell, Yergeau, Martineau, Juck, Whyte and Greer2011, Reference Bell, Yergeau, Maynard, Juck, Whyte and Greer2013). However, the optimum concentration of fertilizers needs to be determined for each ecosystem. This study has shown that the application of fertilizer doses increased petroleum hydrocarbon degradation in Antarctic soils (particularly the alkane fraction), although the best fertilizer doses were dependent on the TPH concentration. We hypothesize that easily degraded hydrocarbons were quickly degraded by the microbial communities as soon as the fertilizer was applied and continued until the nutrient level once again became a limiting factor. This hypothesis explains: i) the depletion of added nitrogen after 60 days of microcosm incubation, ii) the higher degradation value for alkanes when higher amount of fertilizers were applied (the same was not observed for TPH), and iii) the differences in prokaryotic communities found in the microcosms treated with different fertilizer doses. In conclusion, the repeated application of fertilizer on Antarctic contaminated soils would seem to facilitate bioremediation. However, further studies are needed to evaluate the efficiency of these methods in Antarctic soils.
Acknowledgements
This study integrates the National Institute of Science and Technology Antarctic Environmental Research (INCTAPA) which receives financial support from the National Council for Research and Development (CNPq process: no. 574018/2008-5) and Carlos Chagas Research Support Foundation of the State of Rio de Janeiro (FAPERJ no. E-16/170.023/2008). The authors also acknowledge the support of the Brazilian Ministries of Science, Technology and Innovation (MCTI), of Environment (MMA) and Inter-Ministry Commission for Sea Resources (CIRM). JCC was supported by a post-doctoral fellowship from CAPES (Coordenação de Aperfeiçoamento de Pessoal de Nível Superior)/ FAPERJ. ASR, RSP, and LS are also supported by CNPq and FAPERJ. The authors also thank Dr Yara Traub-Cseko and Dr Alberto Davila for the use of IOC/FIOCRUZ facilities, and both reviewers who provided some very helpful suggestions for the improvement of the manuscript.
Author contributions
Juliano C. Cury and Diogo A. Jurelevicius contributed equally to this work. Conceived and designed the experiments: JCC, HEJ, ASR, RSP. Performed the experiments: JCC, HDMV. Analysed the data: JCC, DAJ, HDMV. Contributed reagents/materials/analysis tools: CEGRS, MCB. Wrote the paper: DAJ, JCC, LS.
Supplemental material
Two supplemental figures will be found at http://dx.doi.org/10.1017/S0954102014000728.


