


Introduction
The Southern Ocean below 50°S, with 14% of the total ocean surface area, was estimated to be responsible for 24% (0.39 Pg C yr-1) of the global ocean carbon dioxide (CO2) uptake from the atmosphere (Takahashi et al. Reference Takahashi, Sutherland, Sweeney, Poisson, Metzl, Tillbrook, Bates, Wanninkhof, Feely, Sabine, Olafsson and Nojiri2002). However, more recent studies, based on expanded surface seawater CO2 partial pressure databases, reveal that the oceanic CO2 sink in the Southern Ocean is much smaller than previously estimated (0.05 Pg C yr-1 or 4% of global ocean CO2 uptake, Takahashi et al. Reference Takahashi2009) and the potential of the Southern Ocean as a CO2 sink is decreasing (Metzl Reference Metzl2009, Takahashi et al. Reference Takahashi2009). This improvement in the CO2 flux estimate is largely attributed to the new databases capturing more spatiotemporal variations in surface water CO2, which exhibits a mosaic of saturation state with the presence of both super- and undersaturation relative to atmospheric CO2 in each season (Takahashi et al. Reference Takahashi, Olafsson, Goddard, Chipman and Sutherland1993, Hoppema et al. Reference Hoppema, Stoll and De Baar1995, Reference Hoppema, Fahrbach, Schröder, Wisotzki and De Baar2000, Carrillo & Karl Reference Carrillo and Karl1999, Gibson & Trull Reference Gibson and Trull1999, Stoll et al. Reference Stoll, De Baar, Hoppema and Fahrbach1999, Álvarez et al. Reference Álvarez, Ríos and Rosón2002, Carrillo et al. Reference Carrillo, Smith and Karl2004, Bertolin & Schloss Reference Bertolin and Schloss2009). However, compared to warmer ocean basins the Southern Ocean is still sparsely sampled and its role in regulating atmospheric CO2 and in the global ocean carbon cycle remains elusive. Notably, most of the past CO2 observations are limited to offshore waters and to summer with few studies conducted in coastal waters, where larger spatial and seasonal changes are expected, and on annual or continuously long-term seasonal scales from which a better evaluation of CO2 variation can be made (Carrillo & Karl Reference Carrillo and Karl1999, Gibson & Trull Reference Gibson and Trull1999).
Underlying the large spatial, seasonal, and interannual variability of the surface water CO2 saturation state is the parallel heterogeneity of various physical and biological processes controlling the distribution and evolution of the CO2 system. In this, the frontal and marginal sea ice zones are especially noteworthy. The frontal zones usually possess a high primary productivity and sequester atmospheric CO2 by the ′′“biological pump′′” and through the formation of intermediate water (e.g. in the area of the Antarctic Polar Front), which brings CO2 from surface water to deeper layers (Fransson et al. Reference Fransson, Chierici, Anderson and David2004). In marginal sea ice zones biological activity is synchronized with the ice dynamics with primary production dominating in spring and summer and remineralization prevailing in winter. These areas, therefore, usually act as atmospheric CO2 sinks in spring and summer and sources in winter (Carrillo et al. Reference Carrillo, Smith and Karl2004, Takahashi et al. Reference Takahashi2009). Amongst the numerous Antarctic marginal sea ice zones, the coastal and shelf areas of the West Antarctic Peninsula (WAP) are particularly ideal for testing the effects of climate warming on the marine ecosystem, including the CO2 system, since the WAP is one of the most rapidly warming regions on Earth (Ducklow et al. Reference Ducklow, Baker, Martinson, Quetin, Ross, Smith, Stammerjohn, Vernet and Fraser2007). Rising temperature has led to later advance and earlier retreat of sea ice, diminishing ice concentration and thickness, and thereby an overall reduced ice extent (Ducklow et al. Reference Ducklow, Baker, Martinson, Quetin, Ross, Smith, Stammerjohn, Vernet and Fraser2007, Stammerjohn et al. Reference Stammerjohn, Martinson, Smith and Iannuzzi2008). This changing ice dynamics has substantially altered and will continue to alter the heat flux between the water column and the atmosphere, the timing and magnitude of the spring phytoplankton bloom, the abundance and composition of organisms at various trophic levels, and the interactions between prey and predators (Ducklow et al. Reference Ducklow, Baker, Martinson, Quetin, Ross, Smith, Stammerjohn, Vernet and Fraser2007). All of these factors are expected to significantly influence the CO2 system via increased air-sea exchange area, reduced solubility, modified primary production and remineralization, and altered trophic energy transfer and sedimentation.
The cycling of the oceanic CO2 system closely interacts with that of dissolved organic carbon (DOC), the largest organic carbon pool in the ocean. Primary production, which utilizes dissolved inorganic carbon (DIC), is the main source of DOC while remineralization of DOC is a major contribution to the marine DIC pool. DOC concentrations (DOCs) in the surface ocean usually exceed those in the deep ocean as a result of temporal and spatial uncoupling of in situ DOC production (e.g. extracellular release, cell lysis, sloppy feeding, excretion) and loss (e.g. bacterial consumption, photooxidation, downward diffusion) in the upper ocean (Carlson Reference Carlson2002). The dynamics of the excess DOC, therefore, reflects the interactions between various biological and physical processes that control DOC production, loss, and distribution. At present, DOC measurements in Antarctic coastal waters are rare (Ducklow et al. Reference Ducklow, Baker, Martinson, Quetin, Ross, Smith, Stammerjohn, Vernet and Fraser2007) and less is known of its temporal variability than of its spatial heterogeneity (Scott et al. Reference Scott, Davidson and Marchant2000). Limited data reveal extraordinary variations in DOC ranging from > 8333 μmol l-1 during a massive Phaeocystis sp. bloom in Prydz Bay (Davidson & Marchant Reference Davidson and Marchant1992) to more typical values of 52–102 μmol l-1 in the upper mixed layer (ML) in the Bransfield and Gerlache straits (Doval et al. Reference Doval, Álvarez-Salgado, Castro and Pérez2002) and of 30–258 μmol l-1 at an Antarctic coastal site (68°34′S, 77°57′E) (Scott et al. Reference Scott, Davidson and Marchant2000).
This study reports the changes in the CO2 system and DOC from late autumn to spring at a coastal site off the WAP. CO2 fluxes between air and sea are estimated and physical and biological processes controlling the CO2 system are evaluated. Results from this study augment the meagre datasets on DIC and DOC in the coastal areas of the Southern Ocean and help improve the estimates of CO2 fluxes and the knowledge of DIC and DOC cycling in this climatically sensitive region.
Methods
Sampling
The sampling station (64°19′31″S, 62°53′42″W) was located in the Scholaert Channel flanked by Anvers and Brabant islands off the West Antarctic Peninsula (WAP) (Fig. 1). Water depth at the site is ∼150 m and the most important water mass influencing the area originates from the Bellingshausen Sea (García et al. Reference García, Castro, Ríos, Doval, Rosón, Gomis and López2002). Bulk water was collected with 5 or 12 litre Niskin bottles around 14h00 on each sampling day from 3 June–10 November 2006. During periods of ice cover water was taken from a hole drilled through the ice (7 October only) or from open water near the ice edge (29 August only), ∼1 km away from the station. Simultaneous profiling of conductivity, temperature (T), and depth was made with a Seabird CTD (model SBE 19Plus). Sampling depths for DIC and DOC followed those for concurrent biological studies, usually at 100, 50, 0.1% photosynthetically active radiation (PAR) levels with the deepest depth at 50 m below the 1% PAR level (sampling depth vs PAR level is shown in Fig. 2a). Only surface water (100% PAR) was sampled for pH due to logistic and analytical constraints. DIC samples were collected into 120 ml borosilicate glass bottles, sterilized with 25 μl saturated mercuric chloride solution, and tightly sealed with Teflon-lined screw caps. The samples were stored in the dark at room temperature and analysed within two weeks of sample collection in a ship based (Sedna IV) laboratory in the immediate vicinity of the sampling station. Samples for DOC analysis were passed through 0.2 μm Whatman polyethersulphone filters and stored frozen (-20°C) in 60 ml borosilicate glass bottles until analysis. Samples for pH determination were drawn into 60 ml borosilicate glass bottles and analysed upon collection. All glass bottles had been acid-cleaned and thoroughly rinsed with Nanopure water prior to sampling. DIC and pH bottles were rinsed and then overflowed by around three times their volumes with sample water before the final filling. DOC bottles were pre-rinsed three times with the filtered sample water.

Fig. 1 Map showing sampling station and surrounding areas.
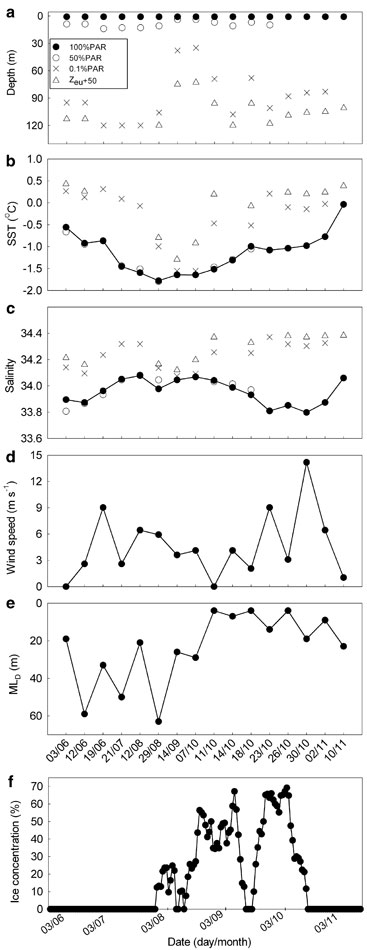
Fig. 2 Temporal variations of a. the sampling depth, b. seawater temperature, c. salinity, d. daily averaged wind speed, e. surface mixed-layer depth, and f. ice concentration. Symbols in panel b–f are the same as those in panel a. Zeu + 50 stands for 50 m below the 1% PAR level.
Analysis and calculation
DIC concentrations were measured according to Cai & Wang (Reference Cai and Wang1998) using an AS-C2 DIC Analyser (Apollo SciTech Inc, Athens, GA) that comprises a Kloehn versa pump 6 digital dispensing device, a custom made purging vessel, and a LI-COR 6252 CO2/H2O analyser. The system was calibrated with the Certified Reference Material (CRM) from A. Dickson (Scripps Institution of Oceanography) at intervals of ∼2 h or every 10 samples during which deviation of the CRM was < 0.1%. The precision of DIC measurement was ± 1 μmol kg-1 based on 10 replicate analyses of the CRM. pH was measured at 25°C with a Ross semi-micro combination pH electrode (Orion Research). Three NBS pH buffers (pH 4.01, 7, 10.01) were used to determine the electrode’s response slope and a tris/HCl buffer at salinity 35 to derive a seawater pH scale (Millero et al. Reference Millero, Zhang, Fiol, Sotolongo, Roy, Lee and Mane1993, Chen et al. Reference Chen, Cai, Wang, Rii, Bidigare and Benitez-Nelson2008). The accuracy was ± 0.01 pH units as determined with the CRM. DOC was measured using high temperature catalytic oxidation (HTCO) with a Shimadzu-5000A TOC Analyser. The measurement was standardized with potassium hydrogen phthalate. The precision for 3–5 replicate analyses of each sample was ∼1%. Chlorophyll a (chl a) concentrations were measured according to the HPLC method by Zapata et al. (Reference Zapata, Rodriguez and Garrido2000) with a detection limit of 0.005 μg l-1. A Bran Luebbe AutoAnalyzer 3 system determined the concentration of nitrate and nitrite (nitrate + nitrite) based on the method by Grasshof et al. (Reference Grasshof, Ehrahrdt and Kremling1983). The precision of the nitrate + nitrite measurement is 0.21%. Free-living heterotrophic bacterial cell abundance was cytometrically determined using an Epics Altra flow cytometer (Beckman Coulter) with a coefficient of variation ranging from 1 to 2% between each measurement. Detailed procedures of chl a, nutrients, and bacteria measurements will be published elsewhere (S. Moreau et al. unpublished).
The fugacity of CO2 (fCO2) in seawater was calculated from DIC, pH, temperature, salinity and nutrient data using the CO2 system programme by Lewis & Wallace (Reference Lewis and Wallace1998) and the apparent thermodynamic dissociation constants of Roy et al. (Reference Roy, Roy, Vogel, Moore, Pearson, Good, Millero and Campbell1993, Reference Roy, Roy, Vogel, Porter-Moore, Pearson, Good, Millero and Campbell1994). The accuracy in the fCO2 calculation was estimated to be < 10 μatm based on the errors from pH (∼7 μatm) and DIC (∼1 μatm) measurements. CO2 air-sea flux, FCO2 (mmol m-2 d-1), was computed using the following equation:
where k is the piston velocity of CO2 (cm h-1), the factor 0.24 converts k from cm h-1 to m d-1, K0 is the solubility of CO2 (mmol m-3 atm-1) calculated according to Weiss (Reference Weiss1974), and ΔfCO2 the difference in CO2 fugacity (μatm) between seawater and atmosphere. The piston velocity was calculated according to the formula of Liss & Merlivat (Reference Liss and Merlivat1986), which expresses k as a function of wind speed and the CO2 Schmidt number, the latter being obtained from Wanninkhof (Reference Wanninkhof1992). The mean error in FCO2 over the whole sampling period was estimated to be ± 1.3 mmol m-2 d-1 or ± 55% using the errors of 1 m s-1 in wind speed, 10 μatm in seawater fCO2, and 0.1 μatm in atmospheric fCO2. We chose the Liss & Merlivat (Reference Liss and Merlivat1986) relationship to calculate k since our study site was in a relatively fetch-limited area. Atmospheric CO2 data were provided by CNR-ISAC and IAA (Consiglio Nazionale delle Ricerche Istituto di Scienze dell’Atmosfera e del Clima and Instituto Antártico Argentino), which continuously monitored CO2 concentrations in air (mole fraction in dry air) over our sampling period at the neighbouring Jubany Station (62°14′S, 58°40′W). The atmospheric CO2 concentration was converted to CO2 fugacity in wet air using in situ sea surface temperature (SST) and salinity, air pressure, and humidity (Weiss Reference Weiss1974), giving a mean value of 368.6 ± 5 μatm. Wind speed was measured at a height of ∼10 m every 6 h from the Sedna IV’s meteorological station and daily averaged wind speed was used in the CO2 flux calculation. Ice concentration data were provided by the National Snow and Ice Data Center (NSIDC) in Boulder, CO, USA (available at http://nsidc.org/data/nsidc-0051.html).
Results
General meteorology, hydrography, and biology
Air temperature ranged from -7 to 2°C (mean: -2.9°C; median: -4.0°C) during the study period with the coldest days occurring in late winter from 12 August–15 September (-5 to -7°C) and the warmest in late spring from 26 October–10 November (0 to 2°C). Wind speed always remained below 10 m s-1 (mean: 4.4 m s-1; median: 3.6 m s-1) except on 30 October during which wind speeds of 12.9–15.5 m s-1 were experienced (Fig. 2d). Excluding a few time windows in which total ice free conditions emerged, the study area was partially ice covered in the later half of the winter (28 July–13 October) with ice concentration ranging from 7.6–69.2% and averaging 38.1%; the rest of the sampling season was completely ice free (Fig. 2f).
Water temperature showed a clear seasonal trend. Sea surface temperature (SST) ranged from -0.56 to -0.92°C (mean: -0.78°C) in late autumn (3–19 June), was close to the seawater freezing point throughout the winter (21 July–14 September), and started rising rapidly at the onset of the ice breakout on 14 October in spring (7 October–10 November) (Fig. 2b). SST reached the maximum of -0.04°C on the last sampling day (10 November). Seawater temperature increased with depth in the upper 120 m throughout the entire sampling period (Fig. 2b). The winter low-temperature tongue dominated the seasonal evolution of the water column temperature.
Salinity variation at the surface was small (33.8–34.07), being lower in late autumn and spring and higher in winter (Fig. 2c). The rapid drop of salinity starting on 7 October was probably due to ice melting. A 0.26 increase in salinity in late spring from 30 October–10 November followed the high wind speed observed on 30 October (Fig. 2d). Wind-driven mixing, therefore, probably caused the increase in salinity. Water column salinity structure was characterized by two large upward salty tongues separated by a minor downward fresher wedge in midwinter and overlain by two large downward fresher tongues formed in late autumn and late spring (data not shown). The largest salinity vertical gradients were recorded in late spring and the lowest in midwinter, exhibiting an opposing trend to that of the surface mixed-layer depth (MLD), as determined by the 0.01 kg m-3 difference criterion (Fig. 2e). The MLD increased slightly from late autumn (37.0 ± 20.3 m) to winter (40.0 ± 19.9 m) but shoaled to 10.4 ± 8.7 m in spring apparently due to surface warming (Fig. 2b) and ice melting-induced freshening (Fig. 2f). The deepening of the ML on 30 October echoed the high wind speeds at that time (Fig. 2e vs 2d) and supported the above argument on the concurrent rise in salinity.
Surface chl a was very low (< 0.22 μg l-1) over the late autumn and winter periods (Fig. 3b). Slightly elevated chl a concentrations were observed during the first three sampling days and on 29 August and 14 September in late winter; the former possibly a remnant of higher chl a in early autumn while the latter could have resulted from phytoplankton production as daylength at that time lasted ∼10 hr and ice concentrations were relatively low (Fig. 2f). As expected from light-limited primary productivity, the sole under-ice water sample displayed a chl a minimum on 7 October. Accompanying the retreat of sea ice, chl a steadily increased from 11 October onward (Fig. 3b). The rapid drop of chl a at the end of the survey could be related to the wind-driven deepening of the ML as mentioned above. Vertically, subsurface chl a maxima occurred at times in spring but were mostly absent in late autumn and winter as expected (Fig. 3b).

Fig. 3 Temporal variations of a. nitrate + nitrite, b. chl a, c. bacterial abundance, and d. DOC. Symbols are the same as those in Fig. 2a.
Surface bacterial abundances were similar between spring (2.4 ± 0.3 × 10⁵ cells ml-1) and late autumn (2.4 ± 0.2 × 10⁵ cells ml-1) but winter’s abundance was c. 30% lower (1.7 ± 0.3 × 10⁵ cells ml-1). Temporal distribution of the surface bacterial abundance generally followed the seasonal trend of surface chl a (Fig. 3c vs 3b) and the two variables linearly correlated (R = 0.868) in spring. Subsurface bacterial abundances were usually lower than at the surface in late autumn and spring but little vertical variability was observed in winter (Fig. 3c).
Dissolved inorganic carbon
Surface DIC fell in a small range from 2163.3 to 2194.5 μmol kg-1 over the entire study period (Fig. 4a). Mean surface DIC increased from 2167.6 ± 2.4 μmol kg-1 in late autumn (3–19 June) to 2186.6 ± 5.5 μmol kg-1 in winter (21 July–14 September), and then decreased to 2173.8 ± 7.2 μmol kg-1 in spring (7 October–10 November). The highest surface DIC (2194.0 μmol kg-1) was observed on 14 September in late winter (Fig. 4a). Surface DIC at our study site trended oppositely compared to water temperature (Fig. 4a vs Fig. 2b). The overall seasonal pattern of DIC was similar to that of salinity and inverse to that of chl a but the point-to-point correspondences were less consistent than those between DIC and T. Accordingly, the linear correlation of DIC vs T (R = -0.885) is better than those of DIC vs S (R = 0.561) and DIC vs chl a (R = -0.475). However, temperature-driven solubility variation could only account for < 4% of the maximum DIC variation in late autumn and winter (28.9 μmol kg-1) and < 7% of that in spring (21.9 μmol kg-1). The contribution from salinity-associated solubility change was negligible. On the other hand, as DIC generally increased with depth (Fig. 4a), the physical structure of the upper water column was expected to influence the surface DIC. Indeed, the difference in DIC between the bottom and surface of the sampled layer (ΔDIC) linearly correlated (R = 0.891) to the parallel difference in salinity over the whole sampling period; the correlation was better in late autumn and winter (R = 0.966) than in spring (R = 0.818). Additionally, the seasonal mean ΔDIC inversely varied with the seasonal mean MLD: 29.4 ± 6.7 μmol kg-1 vs 37.0 m in late autumn, 17.9 ± 13.1 μmol kg-1 vs 40.0 m in winter, and 50.5 ± 10.8 μmol kg-1 vs 10.4 m in spring. Hence, weak stratifications and deepening of the ML brought warmer, saltier, and DIC-richer deeper water into the surface layer and thereby diminished the vertical DIC gradient in the ML. Increasing DIC with time over late autumn and winter should therefore principally be linked to the enhanced vertical mixing whereas the drawdown of DIC in spring was attributable to intensifying stratification of the upper layer along with growing primary production as indicated by chl a (Fig. 3b).

Fig. 4 Temporal variations of a. DIC, b. pH (25°C), c.fCO2 (filled circles and solid line = in seawater, grey line = in air), and d. CO2 flux. Symbols in panel a are the same as those in Fig. 2a.
pH
Surface pH ranged from 7.57–7.86 over the sampling period with the highest pH values (> 7.8) recorded in late spring when chl a concentrations were relatively elevated (Fig. 4b). Mean pH was lower in late autumn and winter (7.62 ± 0.05) than in spring (7.74 ± 0.08), conforming to the seasonal trend of the mean chl a: 0.17 ± 0.06 μg l-1 in late autumn and winter vs 0.29 ± 0.14 μg l-1 in spring. However, on a point-to-point basis, pH correlated better with nitrate + nitrite (R = -0.698) than with chl a (R = 0.335), implying that net community production, which accounts for heterotrophic respiration, rather than primary production alone, controlled pH. Rising temperature in spring also affected pH but contributed only c. 10% of the observed change.
Fugacity and air-sea flux of CO2
Surface water fCO2 ranged from 214.0 μatm on 10 November in spring to 430.0 μatm on 12 August in winter and averaged 323.5 ± 71 μatm (Fig. 4c). CO2 at the surface was generally supersaturated relative to atmospheric CO2 in late autumn and winter (377.4 ± 46 μatm) but undersaturated in spring (281.5 ± 58 μatm). The CO2 saturation state rendered our study site to be a weak CO2 source for the atmosphere in late autumn and winter (mean FCO2: 0.78 mmol m-2 d-1) and a moderate sink in spring (mean FCO2: -2.3 mmol m-2 d-1) (Fig. 4d). In spring FCO2 varied widely from day to day, keeping in-line with the corresponding fluctuations of the wind speed (Fig. 2d). Winter FCO2 values could be overestimates as the study area was usually partially ice covered in that season (Fig. 2f).
Dissolved organic carbon
Surface DOC varied between 39.4 (14 October) and 108.6 μmol l-1 (29 August) and averaged 70.9 ± 19.7 μmol l-1 over the entire sampling period. No consistent temporal DOC trends were observed at the surface and depth (Fig. 3d). Seasonally averaged surface DOC increased from 61.6 ± 11.7 μmol l-1 in late autumn to 79.5 ± 21.1 μmol l-1 in winter and then decreased slightly to 70.1 ± 21.3 μmol l-1 in spring. The depth-weighted mean DOC in the ML, defined as the DOC inventory in the upper ML divided by the MLD, over the whole sampling period ranged from 51.0–107.6 μmol l-1 and averaged 75.4 ± 15.0 μmol l-1.
The vertical distribution of DOC in the water column was complicated with patches of high DOCs located at varying layers below the surface ML. Figure 5 illustrates various types of vertical structures of DOC. DOC profiles on 3 June, 18 and 23 October, 2 November resembled the corresponding chl a profiles (Fig. 5a), suggesting a close linkage between DOC formation and primary production at these times. Similar correspondences were also found for 29 August, 7, 11 and 14 October except at the deepest sampling depths where the chl a and DOC distributions diverged (Fig. 5b). Some profiles of DOC were similar to those of heterotrophic bacterial abundance (12 June, 21 July, 12 and 29 August, 2 November; Fig. 5c) and/or to those of nitrate + nitrite (21 July, 23, 26 and 29 August, 30 October, 10 November; Fig. 5d), pointing to DOC as an important substrate for bacterial multiplication and nutrient production from remineralization of dissolved organic matter.

Fig. 5 Examples of vertical profiles of DOC, chl a, sigma-t, bacterial abundance, and nitrate + nitrite.
Discussion
This section compares our results with those from previous studies, assesses the biological and physical processes regulating fCO2 and DIC, discusses the implication of DOC dynamics, and evaluates the fate of net community production that was derived from mass-balance budgeting of DIC.
Comparison with previous studies
Our spring’s chl a concentrations are far below the reported chl a concentrations (> 1 μg l-1) during phytoplankton blooms in the adjacent Bellingshausen Sea and Gerlache Strait, which usually occur in the summer season (Álvarez et al. Reference Álvarez, Ríos and Rosón2002, Carrillo et al. Reference Carrillo, Smith and Karl2004, Ducklow et al. Reference Ducklow, Baker, Martinson, Quetin, Ross, Smith, Stammerjohn, Vernet and Fraser2007). Bacterial abundances in autumn and spring from the present study are smaller than the summer’s values obtained in the Bellingshausen Sea (3.2 × 10⁵ cells ml-1) and Gerlache Strait (3.8–5.7 × 10⁵ cells ml-1) (Vaqué et al. Reference Vaqué, Guixa-Boixereu, Gasol and Pedrós-Alió2002) and in the shelf waters south-west off Anvers Island (3.8 × 10⁵ cells ml-1) (Church et al. Reference Church, DeLong, Ducklow, Karner, Preston and Karl2003). Our winter value is, however, three times the winter’s bacterial abundance (0.6 × 10⁵ cells ml-1) reported for the shelf waters south-west off Anvers Island (Church et al. Reference Church, DeLong, Ducklow, Karner, Preston and Karl2003). The DIC values observed in the present study lie in the summer–winter DIC range in surface waters west of our study site (Carrillo et al. Reference Carrillo, Smith and Karl2004) and in the annual DIC variation limits in Prydz Bay, East Antarctica (Gibson & Trull Reference Gibson and Trull1999). Our mean fCO2 in spring is within the range of the summer’s mean fCO2 values (241–313 μatm) reported for the adjacent Bellingshausen Sea and Gerlache Strait (Álvarez et al. Reference Álvarez, Ríos and Rosón2002). The supersaturation observed in winter at our site is consistent with previous results obtained in other Antarctic surface waters (Takahashi et al. Reference Takahashi, Olafsson, Goddard, Chipman and Sutherland1993, Carrillo & Karl Reference Carrillo and Karl1999, Gibson & Trull Reference Gibson and Trull1999, Carrillo et al. Reference Carrillo, Smith and Karl2004). Our mean winter supersaturation (2%) is however, lower than that (10%) in the area west off Anvers Island (Carrillo et al. Reference Carrillo, Smith and Karl2004). The spring’s mean CO2 influx calculated by the present study is below the summer’s mean influxes (3.8–15.9 mmol m-2 d-1) in the Bellingshausen Sea and Gerlache Strait (Álvarez et al. Reference Álvarez, Ríos and Rosón2002), in accordance with the higher phytoplankton biomass observed by the latter authors. It should be noted that our CO2 flux estimates (absolute values) would increase approximately by a factor of two if the Wanninkhof (Reference Wanninkhof1992)’s formulation were used to calculate the piston velocity. Surface DOCs at our study site are within the DOCs in coastal Antarctic waters reported by Gibson (Reference Gibson1998) and Hansell & Carlson (Reference Hansell and Carlson1998) (41.7–185 μmol l-1) and by Scott et al. (Reference Scott, Davidson and Marchant2000) (30.0–258.3 μmol l-1). The complex vertical structures of DOC found here are consistent with the observations by Dafner (Reference Dafner1992) and Doval et al. (Reference Doval, Álvarez-Salgado, Castro and Pérez2002) in other Antarctic waters. The increasing DOC at the bottom of some profiles (Fig. 5b) was probably due to a DOC input from the underlying sediment as suggested by Doval et al. (Reference Doval, Álvarez-Salgado, Castro and Pérez2002).
Processes controlling fCO2
The slight CO2 supersaturation (4 ± 11%) in late autumn could largely result from bacterial respiration as evidenced by the relatively high bacterial abundance then (Fig. 3c). The fairly high SST (-0.78 ± 0.2°C) at that time should also play a role in creating this supersaturation. In winter 50% (8.8 μatm) of the decrease in fCO2 from 19 June (T: -0.87°C; fCO2: 405.3 μatm) to 21 July (T: -1.46°C; fCO2: 385.7 μatm) could be accounted for by surface cooling based on calculation using the temperature coefficient of fCO2 in seawater (4.23% °C-1 or c. 15 μatm, Takahashi et al. Reference Takahashi, Olafsson, Goddard, Chipman and Sutherland1993). The surprising CO2 undersaturation on 29 August (by 20%, 72.3 μatm) could result from a combination of the cooling effect, diminished air-sea exchange, weak respiration, and CO2 uptake by phytoplankton production as inferred from decreasing water temperature, ice cover, low bacterial abundance, and elevated chl a (Figs 2 & 3) and phytoplankton cell abundance (S. Moreau et al. unpublished) at that time. The CO2 undersaturation in spring was apparently due mainly to enhanced biological CO2 uptake in the water column. However, the low fCO2 values for the first two spring sampling days (i.e. 7 and 11 October) (Fig. 4c), when the area was still partially ice covered (Fig. 2f), were not expected from the low surface-water chl a concentrations (Fig. 3b) but were supported by the drawdown of nitrate + nitrite (Fig. 3a) at the corresponding times. This seeming paradox might have resulted from the uptake of water column CO2 and nutrients by microalgae growing in the bottom sea ice, as previously observed by Lee et al. (Reference Lee, Whitledge and Kang2008). Ice algae blooms usually precede water column phytoplankton blooms by a couple of months (Fritsen et al. Reference Fritsen, Memmott and Stewart2008), which fits the timeline for an ice algae bloom in early spring at our site (water column bloom there often starts in early summer). Direct observations by divers of the Sedna IV expedition confirmed profuse colonization of microalgae in sea ice at this time of the year in the sampling area.
More quantitatively, processes controlling the temporal evolution of surface fCO2 were evaluated according to the equation of Bakker et al. (Reference Bakker, De Baar and Bathmann1997):
Δf / Δt is the observed change of fCO2 in the time interval of Δt, which is the sum of variations in fCO2 due to thermodynamic changes ([δf / δt]T), air-sea exchange ([δf / δt]F), and a residual term ([δf / δt]R) representing the combined effects of biological activity and physical processes other than temperature and salinity variations (e.g. vertical mixing). [δf / δt]T was calculated using the CO2-system programme by Lewis & Wallace (Reference Lewis and Wallace1998) and [δf / δt]F using Bakker et al.’s (Reference Bakker, De Baar and Bathmann1997) equation:
Fav and fCO2av are, respectively, the average CO2 flux and surface fCO2 over Δt, β, the Revelle factor (i.e. δln(fCO2) / δlnDIC), and TDIC the product of the mean depth-weighted DIC in the ML, the MLD, and the seawater density at the start of each Δt (Bakker et al. Reference Bakker, De Baar and Bathmann1997). Subtracting [δf / δt]T and [δf / δt]F from the observed Δf / Δt gives the residual term, [δf / δt]R. Each term in Eq.
(2)was calculated for Δt corresponding to each time interval (days) between two adjacent sampling days. Seasonal mean values of these terms (Table I) were obtained by averaging the two-point-based values for each specific season. The mean relative error for Δf / Δt, [δf / δt]T, [δf / δt]F, and [δf / δt]R in Eq.
(2)was estimated to be ± 31%, ± 41%, ± 48%, and ± 23%.
Table I Seasonally averaged values of the total dissolved inorganic carbon (TDIC), the Revelle factor (β), the observed change of fCO2 (Δf / Δt), the thermodynamic change ([δf / δt]T), the air-sea exchange ([δf / δt]F), and the residual term ([δf / δt]R) as defined in Eqs (2) & (3).

In late autumn and winter the residual term, supposedly due largely to respiration and vertical mixing, raised fCO2 by 0.45 μatm d-1 while surface cooling and outgassing drew down fCO2 by 0.20 and 0.08 μatm d-1, respectively, leading to a net fCO2 increase of 0.17 μatm d-1. In contrast, the springtime residual term, to which primary production was likely the main contributor, reduced fCO2 by 4.52 μatm d-1. This CO2 drawdown was partially offset by vernal surface warming and atmospheric CO2 input, which increased fCO2 by 0.77 and 0.81 μatm d-1, respectively, giving rise to a net fCO2 decrease of 2.95 μatm d-1. In both periods the residual term was the main control on the fCO2 variation while gas exchange and thermodynamic changes were much less important.
Mass-balance budgeting for DIC
Figure 6 displays DIC as a function of nitrate + nitrite in the upper ML on a salinity-normalization basis, which is intended to eliminate the effect of dilution by melting sea ice. The measured data points for winter and spring are mostly below and above, respectively, the theoretical lines predicted from the concurrently measured molar ratios of particulate organic carbon (POC) to particulate organic nitrogen (PON), 16.8 ± 3.2 for winter and 8.8 ± 1.0 for spring (E. Pelletier et al. unpublished data). Our winter POC:PON ratios are close to those observed by Carlson et al. (Reference Carlson, Hansell, Peltzer and Smith2000) and Hansell & Carlson (Reference Hansell and Carlson2001). This pattern indicates a net loss of DIC in the upper ML in winter and a net gain in spring due to processes other than biological activity. The loss of DIC in winter could result from efflux of CO2 to the atmosphere while the gain in spring could be a consequence of atmospheric CO2 influx and upward DIC diffusion from below the ML. The scattering of the data reflects the variability of these processes over the sampling period.

Fig. 6 Plot of DIC vs nitrate + nitrite in the upper mixed layer. Lines indicate DIC expected from nitrate and nitrite uptake and the POC:PON ratios determined in this study (see text). The starting DIC was set at 2236.6 μmol l-1 for winter and 2254.9 μmol l-1 for spring. Both DIC and nitrate + nitrite are normalized to salinity 34.
A mass-balance model, modified from Bégovic & Copin-Montégut (Reference Bégovic and Copin-Montégut2002) and Fransson et al. (Reference Fransson, Chierici, Anderson and David2004), was employed to quantitatively assess the relative importance of different processes in controlling the seasonal dynamics of DIC. Neglecting horizontal advection (as it is unknown), we can express the model as:
where ΔDICobs, ΔDICbio, ΔDICexch, and ΔDICmix represent the change in salinity-normalized DIC (salinity 34) from observation, biological activity, air-sea exchange, and vertical mixing, respectively. The model was applied to the upper mixed layer and two seasons: winter including late autumn (3 June–14 September) and spring (7 October–10 November). ΔDICbio was calculated as the product of nitrate and nitrite uptake or release and the measured molar POC:PON ratios from this study. ΔDICmix was estimated by multiplying vertical eddy diffusivity, Kz, by dDIC/dz between MLD and 100 m using a Kz value of 3 × 10⁻⁵ m2 s-1 (De Baar et al. Reference De Baar, De Jong, Bakker, Löscher, Veth, Bathmann and Smetacek1995, Bakker et al. Reference Bakker, De Baar and Bathmann1997, Álvarez et al. Reference Álvarez, Ríos and Rosón2002). ΔDICexch was then computed as ΔDICobs - ΔDICbio - ΔDICmix. Results are shown in Table II. The mean relative error for ΔDICobs, ΔDICbio, ΔDICexch, and ΔDICmix in Eq.
(4)was estimated to be ± 49%, ± 19%, ± 27%, and ± 11% in winter, and ± 14%, ± 11%, ± 34%, and ± 7% in spring. ΔDICbio approximates bacterial remineralization in winter due to weak primary production at that time and corresponds to net community production in spring. Clearly, biological activity dominated over air-sea exchange and vertical transport in regulating the dynamics of DIC in both seasons. As expected, the study area acted as a source of CO2 in winter and a sink in spring. The air-sea flux term was more than twice the vertical mixing term in both seasons. Note that we did not take into account the change in DIC due to biological calcium carbonate since the cell abundance of calcareous organisms during our study period was undetectable (S. Moreau et al. unpublished).
Table II Seasonally averaged changes in salinity-normalized DIC from observation (ΔDICobs), biological activity (ΔDICbio), vertical mixing (ΔDICmix), and air-sea exchange (ΔDICexch) as defined in Eq. (4).

Qualitatively, the CO2 flux derived from the mass-balance model is in the same direction (i.e. source in winter and sink in spring) as that for the flux based on fCO2 and piston velocities. Quantitatively, the former is similar to the latter (0.80 vs 0.78 mmol m-2 d-1) in winter but more than twice the latter (-5.3 vs -2.3 mmol m-2 d-1) in spring. Given the two-fold uncertainty in the piston velocity calculation and the further complication by ice coverage, these two independent approaches actually reach a reasonable agreement. This concord indirectly validates the assumption made in the mass-balance model, i.e. insignificant horizontal advection.
Based on the observation of strong summertime CO2 undersaturation in the north-east water polynya on the Greenland Shelf, Yager et al. (Reference Yager, Wallace, Johnson, Smith, Minnett and Deming1995) hypothesized that marginal sea ice zones in the Arctic Ocean act as a rectified (one-way) net annual CO2 sink that provides a negative feedback to increasing atmospheric CO2. A key assumption underlying this hypothesis is that air-sea gas exchange is effectively blocked by sea ice in winter and by intense surface stratification in spring due to freshening of the water column by sea ice melting. Consequently, DIC accumulated in the water column during winter cannot be transferred to the atmosphere via gas exchange before it is consumed by primary production in spring. In the present study, however, escape of CO2 to the atmosphere in winter was not completely prevented due to only partial ice coverage, as also observed in other WAP marginal sea ice zones (e.g. Carrillo et al. Reference Carrillo, Smith and Karl2004). Furthermore, summertime surface water CO2 in the WAP shelf region can be near atmospheric equilibrium or supersaturation, instead of undersaturation, (Álvarez et al. Reference Álvarez, Ríos and Rosón2002, Carrillo et al. Reference Carrillo, Smith and Karl2004). Therefore, the Scholaert Channel and some other WAP coastal and shelf areas probably do not act as a rectified CO2 sink. As the WAP is one of the most rapidly warming regions on Earth (Ducklow et al. Reference Ducklow, Baker, Martinson, Quetin, Ross, Smith, Stammerjohn, Vernet and Fraser2007), this leads to a broader implication in relation to whether climate warming strengthens the rectified sink, if it does exist. Yager et al. (Reference Yager, Wallace, Johnson, Smith, Minnett and Deming1995) suggested that rising temperature increases the seasonally ice covered area and thus the rectified sink as well. Yet rising temperature also reduces the concentration and thickness of sea ice, which diminishes the effectiveness of sea ice as a barrier for air-sea gas exchange. Moreover, the contraction of sea ice leads to less freshening (thus less stratification) of the water column once sea ice melts, thereby facilitating CO2 exchange to air through wind-driven mixing in early spring when CO2 is well above atmospheric equilibrium. Hence, the impacts of climate warming on the dynamics of DIC in relation to the rectified sink hypothesis appear rather complex. In fact, the most recent flux estimation by Takahashi et al. (Reference Takahashi2009) demonstrates that the Antarctic marginal sea ice zones are a weak source, instead of sink, of atmospheric CO2.
Implication of DOC dynamics
Our DOC data indicate an excess of DOC in the surface ML against a deepwater background DOC of 44 μmol l-1 found by Doval et al. (Reference Doval, Álvarez-Salgado, Castro and Pérez2002) in the vicinity of our sampling site or of 39 μmol l-1 obtained by Ducklow et al. (Reference Ducklow, Baker, Martinson, Quetin, Ross, Smith, Stammerjohn, Vernet and Fraser2007) in a more extensive WAP shelf region. The former was adopted for calculating the excess DOC in the present study, giving mean excess DOC values of 29.4 ± 5.8 μmol l-1 in late autumn, 27.6 ± 19.4 μmol l-1 in winter, and 34.0 ± 17.3 μmol l-1 in spring. The overall range of the excess DOC (7.0–63.6 μmol l-1) from this study indicates that 14–59% (mean: 39%) of the measured DOC in the ML of the sampling site was labile or semi-labile. This large variability of excess DOC is consistent with the observations by Doval et al. (Reference Doval, Álvarez-Salgado, Castro and Pérez2002) in the adjacent area in summer (15–57%) and by Hansell & Peltzer (Reference Hansell and Peltzer1998) in the Arabian Sea (31–58%). Using the concurrently determined particulate organic carbon concentration (POC) (E. Pelletier et al. unpublished data), we calculated the ratio of excess DOC to excess DOC plus POC. This ratio showed little intra- and inter-seasonal variability and averaged 79 ± 10% for the entire sampling period, indicating that 79% of the potentially degradable organic carbon existed in dissolved form and 21% as suspended particles. Our ratio is larger than the summertime ratio of 59% in the nearby Bransfield and Gerlache straits (Doval et al. Reference Doval, Álvarez-Salgado, Castro and Pérez2002) but comparable to the ratio of 89% in the Mediterranean Sea (Copin-Montégut & Avril Reference Copin-Montégut and Avril1993).
The seasonal pattern of the excess DOC generally followed that of the depth-weighted mean chl a in the ML (Fig. 7), indicating that primary production was a key control on the accumulation of DOC. Considering the low phytoplankton biomass in late autumn and winter, we suspect that the excess DOC at that time could be a remnant of DOC accumulated during the preceding summer phytoplankton bloom. Our higher DOC excess value in spring agrees with the findings by Copin-Montégut & Avril (Reference Copin-Montégut and Avril1993) and Carlson et al. (Reference Carlson, Ducklow and Michaels1994) for warmer seas. The springtime increase in the excess DOC indicated that phytoplankton-based DOC production overtook DOC losses due to vertical and horizontal DOC transport and bacterial remineralization which should also be enhanced in spring as inferred from the higher bacterial abundance in the ML (Fig. 7). The similar temporal trends of the bacterial abundance and excess DOC (Fig. 7) further demonstrate that DOC was plausibly the main substrate for bacterial growth during the sampling period.

Fig. 7 Temporal variations of depth-weighted mean excess DOC, chl a, and bacterial abundance in the surface mixed layer.
Fate of net community production
In spring, the biological term in Eq. (4), ΔDICbio, represents the net community production at the study site given by
where ΔPOC and ΔDOC are the measured changes in the concentrations of POC and DOC in the upper ML in spring (11 October–10 November), and E the downward flux of POC that can be estimated as ΔDICbio - ΔPOC - ΔDOC. The values of ΔPOC, ΔDOC, and E are 0.8 ± 0.1, 3.6 ± 1.3, and 2.9 ± 1.4 mmol m-2 d-1, respectively, accounting for 11, 50, and 39% of ΔDICbio (7.3 ± 0.3). Therefore, DOC production is the dominant fate of the net community production, followed by the downward transport of POC, and biomass increase. The similarity in the patterns of temporal distributions of DOC and chl a in spring (Fig. 7) suggests that extracellular release could be mainly responsible for DOC production. The percent ΔDOC value from this study is at the upper end of the summertime percent extracellular release range reported by Morán & Estrada (Reference Morán and Estrada2002) for the nearby Bransfield and Gerlache straits (3–47%) and within the range reported by Gosselin et al. (Reference Gosselin, Levasseur, Wheeler, Horner and Booth1997) for the Canada Basin in the Arctic Ocean (31–65%). This high percent ΔDOC value might be related to enhanced extracellular DOC release under high doses of UV-B radiation as a result of the Antarctic springtime ozone hole that occurred over our sampling period (Carrillo et al. Reference Carrillo, Medina-Sánchez, Villar-Argaiz, Delgado-Molina and Bullejos2006, S. Moreau et al. unpublished). The downward export term from our study is much lower than the summertime values obtained by Álvarez et al. (Reference Álvarez, Ríos and Rosón2002) for the adjacent Bellingshausen Sea (9.0 mmol m-2 d-1) and Gerlache Strait (23.5 mmol m-2 d-1), in accordance with the lower phytoplankton production at our sampling time. The difference in the percent E value between the two studies is, however, smaller: 39% vs 67% (for the Gerlache Strait).
Conclusions
This study examined the seasonal evolution of water-column DIC, DOC, and related meteorological, physical, biological, chemical variables at a coastal water site off the West Antarctic Peninsula. Surface DIC spanned a small range (2163.3 to 2194.5 μmol kg-1) and increased from late autumn to winter and then decreased in spring. No consistent temporal trends of DOC were observed but an excess of DOC (7.0–63.6 μmol l-1) existed in the surface ML throughout the sampling period. Mass-balance modelling was employed to assess the relative importance of various processes in controlling the seasonal DIC dynamics and in the partition of the net community production in spring. Despite the very low biomass of both autotrophic and heterotrophic organisms, the biological contribution to the DIC dynamics was considerably higher than those from air-sea exchange and physical mixing. The net community production in spring was mainly funnelled through DOC and sinking particles rather than suspended POC in the upper ML. CO2 at the surface was slightly supersaturated (by 2%) in late autumn and winter and moderately undersaturated (by 24%) in spring. Both mass-balance modelling and fCO2-based calculation indicate that the study area was a source of CO2 to the atmosphere in late autumn and winter (∼0.8 mmol m-2 d-1) and a sink in spring (2.3–5.3 mmol m-2 d-1). The Scholaert Channel will probably not act as a rectified (one-way) annual CO2 sink in the context of climate warming. More surveys are needed to consolidate these conclusions and to verify their applicability to other Antarctic coastal and shelf regions owing to the relatively sparse wintertime sampling resolution in our study and to large inter-annual and spatial variability of the Antarctic marine ecosystems, including ice coverage.
Acknowledgements
We thank M. Lionard, É. Pelletier, E. Carmack, and CNR-ISAC and IAA for providing chl a, POC, CTD, and atmospheric CO2 concentration data, respectively. We appreciate the help and cooperation from I. Schloss, B. Mercier, S. Roy, and the captain and crew of Sedna IV. This research is part of a project entitled “Combined effects of UV-B radiation, increased CO2 and climate warming on the biological pump: a temporal and latitudinal study” under the overall direction of S. Demers. Research funds were provided by the Natural Sciences and Engineering Research Council of Canada (NSERC, SRO Grant 334876-2005), the Ministère du Développement Économique, de l’Innovation et de l’Exportation du Québec (MDEIE), and Développement Économique Canada (DEC).


