Introduction
The Antarctic Peninsula was one of the most rapidly warming regions of our planet in the second half of the twentieth century (Turner et al. Reference Turner, Lu, White, King, Phillips and Hosking2016). Increasing temperatures have been responsible for glacier retreat and ice shelf disintegration (Davies et al. Reference Davies, Carrivick, Glasser, Hambrey and Smellie2012, Engel et al. Reference Engel, Nývlt and Láska2012), lake level and temperature changes (Quayle et al. Reference Quayle, Peck, Peat, Ellis-Evans and Harrigan2002, Váczi et al. Reference Váczi, Barták, Nedbalová and Elster2011) and greening of terrestrial habitats (Lee et al. Reference Lee, Raymond, Bracegirdle, Chadès, Fuller, Shaw and Terauds2017). Despite the recent hiatus in warming at the beginning of the twenty-first century (Turner et al. Reference Turner, Lu, White, King, Phillips and Hosking2016), with associated impacts on the cryosphere (Oliva et al. Reference Oliva, Navarro, Hrbáček, Hernández, Nývlt and Pereira2017, Engel et al. Reference Engel, Láska, Nývlt and Stachoň2018), the Representative Concentration Pathways (RCP) scenarios for 2100 predict further warming and pronounced drying of the ice-free areas of James Ross Island (JRI) due to ongoing glacial shrinkage and enhanced active-layer thawing (ATCM 2015), which will strongly affect local streams, lakes and associated biological communities. Lakes and ponds in particular are regarded as sensitive, rapidly reacting indicators of climatic and environmental changes, and as such should be subject to long-term limnological and biological monitoring programmes (Toro et al. Reference Toro, Camacho, Rochera, Rico, Bañón and Fernández-Valiente2007, Verleyen et al. Reference Verleyen, Hodgson, Gibson, Imura, Kaup and Kudoh2012) in order to understand the context of current changes (Quayle et al. Reference Quayle, Peck, Peat, Ellis-Evans and Harrigan2002), inform palaeolimnological reconstructions (Sterken et al. Reference Sterken, Roberts, Hodgson, Vyverman, Balbo and Sabbe2012) and predict future ecosystem responses to a changing climate (Lee et al. Reference Lee, Raymond, Bracegirdle, Chadès, Fuller, Shaw and Terauds2017).
Recently, limnological investigations have been conducted in several deglaciated regions of the Antarctic Peninsula, with a particular focus on the South Shetland Islands (Vinocur & Unrein Reference Vinocur and Unrein2000, Toro et al. Reference Toro, Camacho, Rochera, Rico, Bañón and Fernández-Valiente2007) and the James Ross Archipelago (Nedbalová et al. Reference Nedbalová, Nývlt, Kopáček, Šobr and Elster2013, Lecomte et al. Reference Lecomte, Vignoni, Córdoba, Chaparro, Chaparro and Kopalová2016). Similar studies and other works from continental Antarctica (Borghini & Bargagli Reference Borghini and Bargagli2004, Lyons et al. Reference Lyons, Welch, Gardner, Jaros, Moorhead, Knoepfle and Doran2012, Verleyen et al. Reference Verleyen, Hodgson, Gibson, Imura, Kaup and Kudoh2012, Sakaeva et al. Reference Sakaeva, Sokol, Kohler, Stanish, Spaulding and Howkins2016) have shown these habitats to be geo-/hydrochemically highly variable, even within relatively short distances between sites, and strongly influenced by the underlying geology and proximity to the coast. Furthermore, the long-term landscape history, including glacial–interglacial cycles and the last deglaciation, plays an important role in the formation and evolution of lake basins and catchments of the present waterbodies (Hodgson et al. Reference Hodgson, Vyverman and Sabbe2001, Van Hove et al. Reference Van Hove, Belzile, Gibson and Vincent2006, Barrett et al. Reference Barrett, Virginia, Lyons, McKnight, Priscu and Doran2007, Roberts et al. Reference Roberts, Hodgson, Sterken, Whitehouse, Verleyen and Vyverman2011, Davies et al. Reference Davies, Glasser, Carrivick, Hambrey, Smellie and Nývlt2013). Therefore, a deeper understanding of lake hydrochemistry, biology and physical processes necessitates a holistic assessment of these three interrelated aspects: the underlying bedrock, geomorphological setting and long-term landscape history.
Lakes and ponds are important centres of biomass, biodiversity and biogeochemical cycling in the Antarctic (Laybourn-Parry & Wadham Reference Laybourn-Parry and Wadham2014). Dominating these habitats are brightly pigmented cyanobacterial mats, which in turn host unique assemblages of heterotrophic and chemotrophic bacteria, diatoms, green algae and various groups of invertebrates (such as crustaceans and tardigrades), many of which are endemic (Laybourn-Parry & Wadham Reference Laybourn-Parry and Wadham2014). Lakes studied on JRI thus far have shown specific autotrophic communities exhibiting strong linkages between species composition, lake type and physicochemical characteristics (Kopalová et al. Reference Kopalová, Nedbalová, Nývlt, Elster and Van de Vijver2013, Škaloud et al. Reference Škaloud, Nedbalová, Elster and Komárek2013). Furthermore, relatively large altitudinal gradients present on JRI offer an opportunity to study lakes with varying durations of ice cover, which may promote differences in their sensitivity to a changing environment. Lastly, due to its limnological diversity and transitional biogeographical position within the north-eastern Antarctic Peninsula (Terauds & Lee Reference Terauds and Lee2016), the James Ross Archipelago represents an excellent place to explore ecological relationships between freshwater communities and abiotic conditions.
Here, we describe the geomorphological and limnological features of Clearwater Mesa (CWM), a previously unexplored part of JRI in the Antarctic Peninsula region. We provide original field data characterizing the local geomorphological settings, including detailed mapping of the area, as well as the first survey of its lentic freshwater ecosystems. Because of its high density of lakes, unique geomorphological setting, remote elevated position and lack of a previous human presence, CWM presents an ideal opportunity for studying pristine lacustrine systems, their links to the long-term evolution of deglaciated land systems (Davies et al. Reference Davies, Glasser, Carrivick, Hambrey, Smellie and Nývlt2013) and biological communities facing rapid environmental changes (Quayle et al. Reference Quayle, Peck, Peat, Ellis-Evans and Harrigan2002).
Materials and methods
Study site
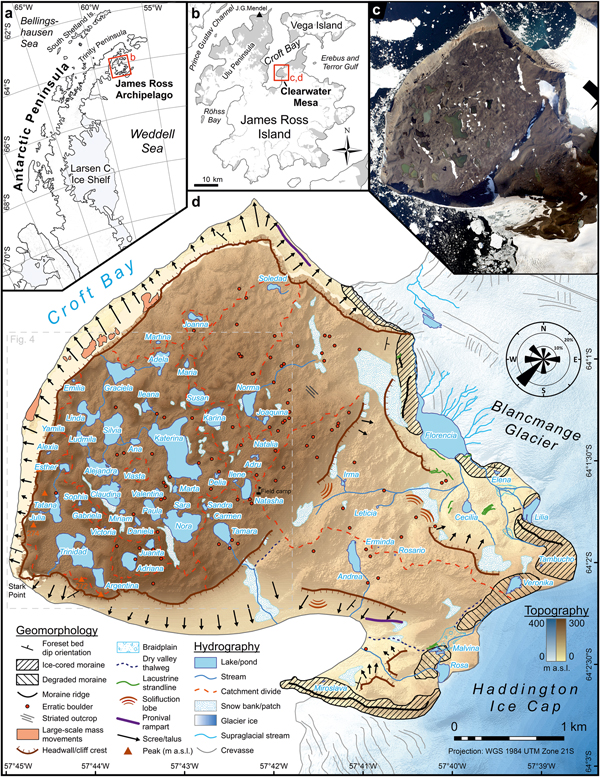
Clearwater Mesa (64°1′S, 57°43′W) is located in north-central JRI, north-eastern Antarctic Peninsula (Fig. 1), and is bordered by Croft Bay to the west (with Stark Point at its westernmost point), the Haddington Ice Cap to the east, the outlet tidewater Blancmange Glacier to the north-east and an unnamed glacier to the south. Clearwater Mesa represents a prominent lava-fed delta, or ‘tuya’, composed of JRI Volcanic Group rocks (Smellie et al. Reference Smellie, Johnson and Nelson2013), found in an altitudinal range of ~200–275 m a.s.l. (slightly sloping north-eastwards), and covers an area of ~8 km2. The mesa has a levelled surface, with a vertical relief of less than 30 m from valley floors to hilltops, referred to as tumuli (e.g. Johnson et al. Reference Johnson, Smellie, Nelson and Stuart2009). To the east, the wider CWM area consists of lower-lying promontory connecting the mesa and the ice cap (Fig. 1). This lithologically and geomorphologically distinct area covers ~5 km2 and is also the subject of this study – it will be referred to as the ‘CWM foreland’.
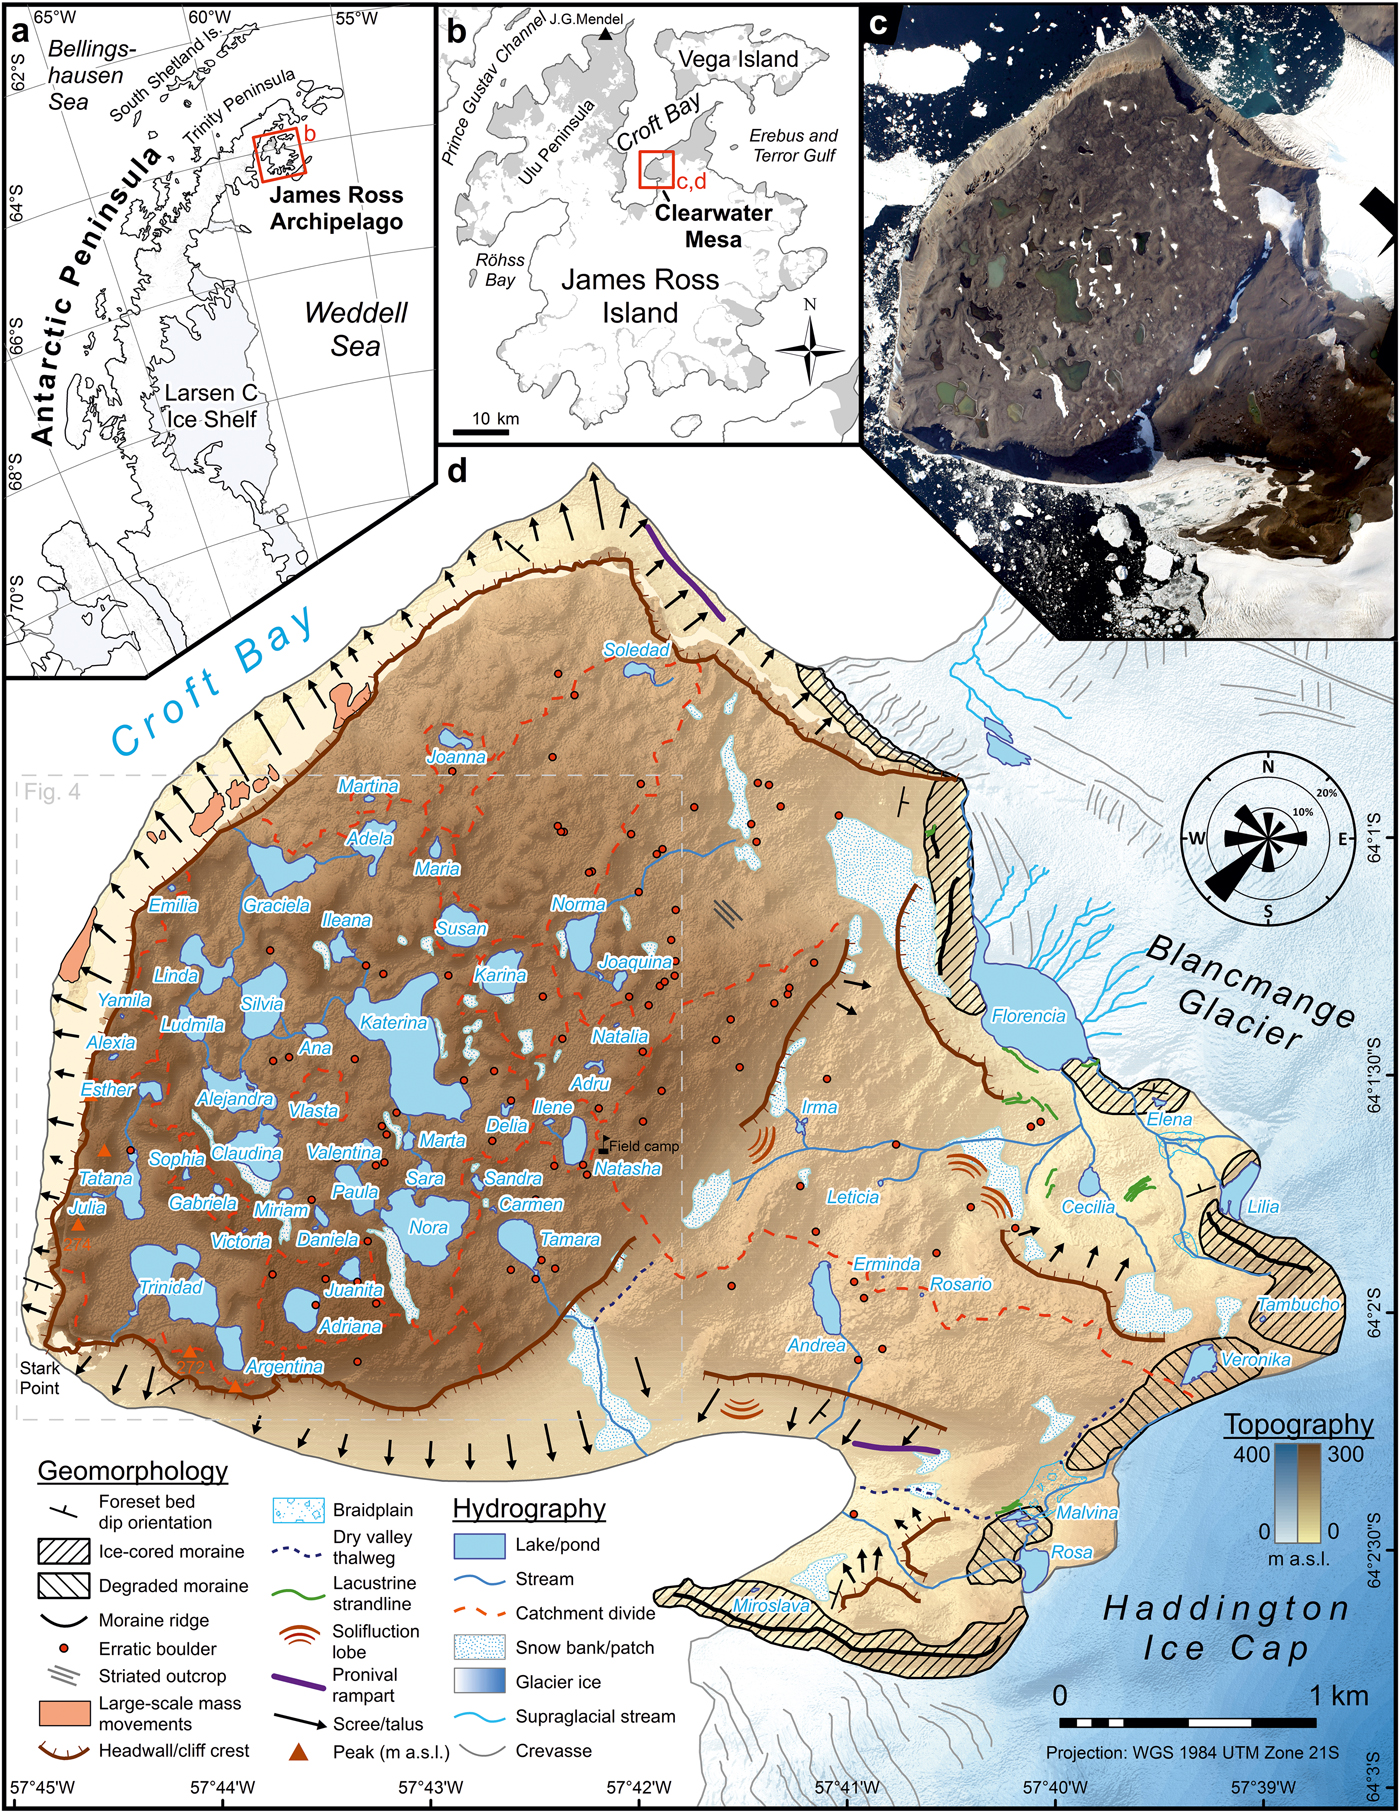
Fig. 1. Clearwater Mesa is located on a. the north-eastern side of the Antarctic Peninsula and b. in the north-central part of James Ross Island. c. Aerial orthophotograph that was used for mapping. d. The main geomorphological and hydrographical features of CWM overlain on the digital elevation model (created by the Polar Geospatial Center from DigitalGlobe, Inc. imagery). The wind rose diagram expresses the relative frequency of wind direction based on observations in the field camp during the 2016 summer campaign.
The regional climate is influenced by the position of the boundary between the maritime sub-Antarctic air masses and the more continental and arid Weddell Sea sector of the Antarctic Peninsula, which acts as an orographic barrier responsible for the rain shadow effect (van Lipzig et al. Reference van Lipzig, King, Lachlan-Cope and van den Broeke2004). Mean annual air temperature at Mendel Station (25 km to the NNW) reaches -7.0°C (2006–2015; Hrbáček et al. Reference Hrbáček, Kňažková, Nývlt, Láska, Mueller and Ondruch2017). Mean daily air temperature from December to February typically exceeds 0°C, with daily maxima of ~8°C, allowing lake ice break-up almost every summer for most lake types (Nedbalová et al. Reference Nedbalová, Nývlt, Kopáček, Šobr and Elster2013). Precipitation is rather low (< 500 mm yr−1; van Lipzig et al. Reference van Lipzig, King, Lachlan-Cope and van den Broeke2004), and the semiarid climate characteristics are further accentuated by exposure to cold and dry south-westerly barrier winds that contribute to surface desiccation and snow drifting off the mesa (Engel et al. Reference Engel, Láska, Nývlt and Stachoň2018).
Geomorphological mapping
Basic geomorphological mapping was performed by utilizing field observations made during the 2015 and 2016 field campaigns and through the interpretation of remote sensing imagery. Photographs taken from an Argentine Air Force Twin Otter flight during the 2014 austral summer were used to produce the orthophotograph in Agisoft PhotoScan Professional software in two steps: orthorectification of the aerial photographs and georeferencing it with ground-truthed GPS coordinates using a handheld differential GPS (dGPS; Trimble, Sunnyvale, CA, USA). Subsequent identification and interpretation of the main geomorphic features was performed in ArcMap 10.3.1 software (Esri, Redlands, CA, USA). Description of landforms follows the sediment–landform assemblage classification of Davies et al. (Reference Davies, Glasser, Carrivick, Hambrey, Smellie and Nývlt2013).
Limnological measurements and lake water sampling
Shorelines of all lakes and larger ponds were mapped with a dGPS. Their area, perimeter, elevation and other morphometric parameters were calculated, and surface drainage catchments were delineated after consulting the orthophotograph and digital elevation model called Reference Elevation Model of Antarctica (REMA; provided by B. Harried, from the Polar Geospatial Center, before the official release date). All lake names given here are unofficial and have not been approved by any national body. Lakes were classified according to their origin, geomorphology and hydrological stability, partly following the criteria of Nedbalová et al. (Reference Nedbalová, Nývlt, Kopáček, Šobr and Elster2013), who defined six lake types on the nearby Ulu Peninsula, JRI: 1) stable shallow lakes on higher-altitude levelled surfaces (mostly on volcanic mesas), 2) shallow coastal lakes (induced by post-Glacial glacioisostatic uplift of the surface), 3) stable lakes in old moraines (i.e. of Late Glacial or Early Holocene age), 4) small unstable lakes in young moraines (formed in the Late Holocene by post-Neoglacial ice retreat), 5) deep cirque lakes, and 6) kettle lakes.
Temperature, conductivity and pH were measured in situ with a Hanna Combo tester (Hanna Instruments, Woonsocket, RI, USA) and C66 conductivity meter (Milwaukee Instruments, Rocky Mount, NC, USA) several times over the course of the 2015 and 2016 summers (January to mid-February). Sampling was performed from the shore at various times of day depending on current meteorological conditions that permitted fieldwork. Bathymetric mapping of the largest non-ice-contact lake, Katerina, was performed, and a Minikin T temperature logger (EMS Brno, Brno, Czech Republic) was deployed from 7 to 30 January 2015, placed ~10 m from the shore (64°01′19.0″S, 57°43′14.2″W) at a depth of ~0.3 m. A subset of lakes (21 in 2015 and 13 in 2016) were further sampled for hydrochemical analyses. All water samples were collected in the final days of the field campaigns (i.e. 26–30 January in 2015 and early February in 2016). Water was taken from the shore with clean and triple-rinsed plastic bottles and returned to the field camp, where they were kept chilled and in the dark and frozen immediately upon return from the field. Water samples were also collected from a set of five lakes (Adriana, Andrea, Katerina, Natasha and Nora) during the first visit to CWM in February 2009.
Hydrochemistry
The water samples of five lakes collected in 2009 were analysed at the Institute of Hydrobiology CAS (České Budějovice, Czech Republic) following the methods used by Nedbalová et al. (Reference Nedbalová, Nývlt, Kopáček, Šobr and Elster2013). Briefly, acid neutralizing capacity (ANC; determined by Gran titration) and total concentrations of phosphorus (TP) and nitrogen (TN) were determined in unfiltered samples. For the determination of ions, samples were filtered with membrane filters (pore size 0.45 µm). Glass fibre filters (pore size 0.4 µm) were used for other analyses. Ion concentrations were determined by ion chromatography (Dionex IC25; Thermo Scientific, Waltham, MA, USA), and for the analysis of NO2− spectrophotometry was used. A total organic carbon (TOC)/TN analyser (Formacs; Skalar, Breda, The Netherlands) was used for determination of total and dissolved nitrogen and organic carbon. Dissolved organic carbon (DOC) was analysed on a TOC 5000A analyser (Shimadzu, Kyoto, Japan). The molybdate method was applied for the determination of dissolved silica (Si) and phosphorus forms. The samples of 29 lakes in total from the 2015 and 2016 field campaigns were analysed at the T. G. Masaryk Water Research Institute (Prague, Czech Republic), with the following differences from the previously described procedures: samples for analysis of ions were filtered with 0.7 µm pore-size glass fibre filters. For the determination of major cations, inductively coupled plasma optical emission spectroscopy was used instead of ion chromatography. Lastly, total and dissolved nitrogen were analysed by the chemiluminescence method after oxidation to nitrogen oxides.
The differences in conductivity between different categories of CWM lakes (grouped according to the basin type, lake type and meltwater source) were tested using Mann–Whitney or Kruskal–Wallis nonparametric tests. To visualize the variability in hydrochemical characteristics between different CWM lakes and within their corresponding surface drainage systems, we also conducted a principal component analysis (PCA) that included the major anions, cations, TP, TN, DOC and ANC. To compare CWM lakes with the different lake types from the Ulu Peninsula (Nedbalová et al. Reference Nedbalová, Nývlt, Kopáček, Šobr and Elster2013), which represent the closest and best-studied analogue waterbodies using the same collection and analytical methods, we conducted a second PCA incorporating the same variables for both datasets. All multivariate statistical analyses were conducted using the program CANOCO 5 (ter Braak & Šmilauer 2012). The limnological variables were log(x + 1) transformed and standardized prior to statistical analyses. A PCA was selected to visualize the variability within the dataset, because the gradient lengths were short (ter Braak & Šmilauer Reference ter Braak and Šmilauer2012). When chemical concentrations were below the limit of detection, half the value of the detection limit was used in the analyses.
Results
Geology and geomorphology
Lithologically, the surface of the mesa is formed by basalts, with only locally protruding hyaloclastite breccia outcrops. Basalts occur in massive, often oxidized forms or in light-coloured, vesicular forms. A horizontally bedded structure of basaltic topsets is clearly visible, as well as steeply dipping strata of hyaloclastite breccia foresets underneath, the orientation of which is directed predominantly outwards from the central part of CWM (Fig. 2a). The structural relationships, including the passage zone, slump zones and chute-scour structures, can be especially clearly observed on the vertical cliff of the mesa's north-western side. East of the mesa, the deep fluvial valley of a stream outflowing from Lake Rosa is incised into volcanic/palagonite tuffs, underlying the hyaloclastite breccias. Large areas are covered by diamictites, often with an allochthonous component of erratic pebbles to boulders.
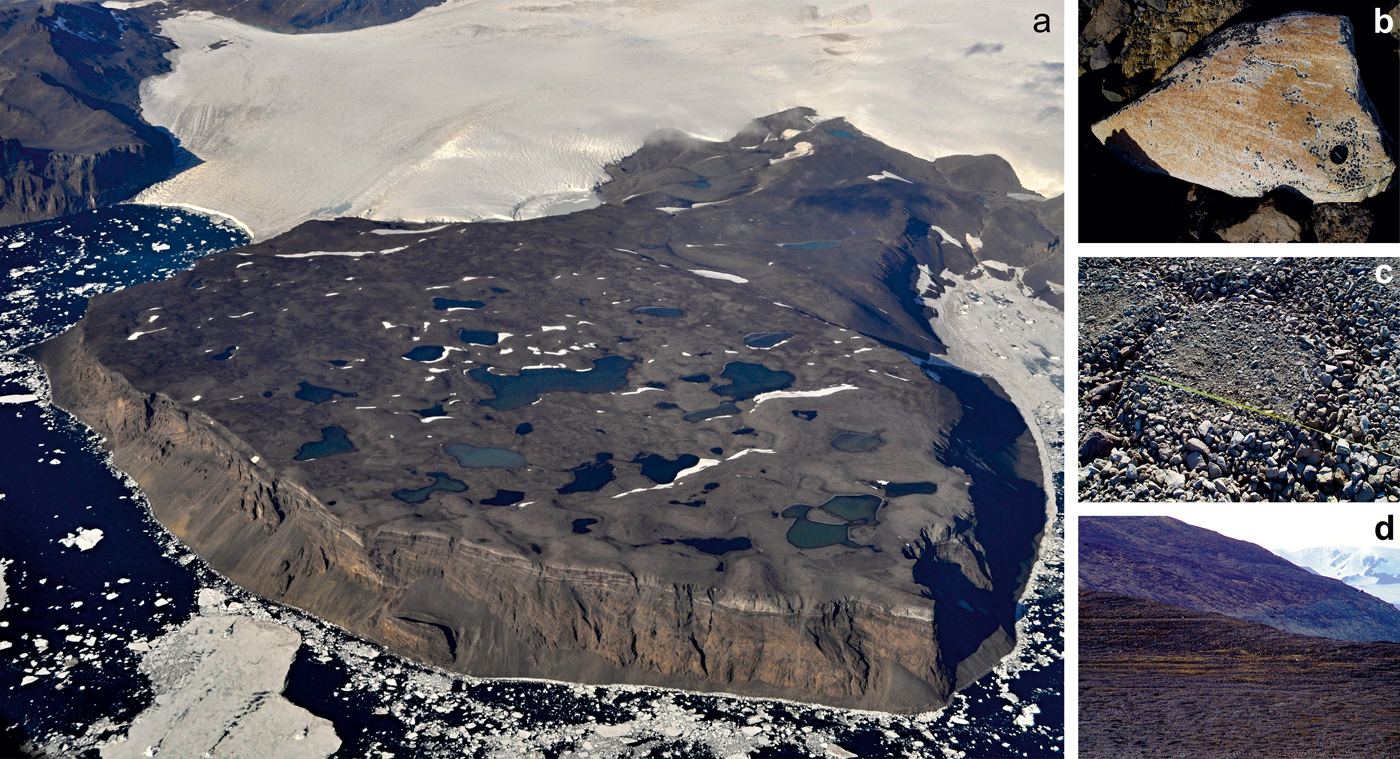
Fig. 2. Geomorphological features of the CWM area. a. General aerial view of the mesa looking from the west, with basaltic horizontal topsets and inclined foresets of hyaloclastite breccia distinguishable on the vertical Stark Point profile. Note the distinct changes of lake water colour across small distances. b. Wind-polished and striated glacial erratic boulder. c. Well-developed sorted polygon in saturated depressions. d. Strandlines of glacier-dammed palaeolake Florencia from the past high stand.
The glacier ice and snow assemblage is present on the fringes of the CWM area at the terminus of the Haddington Ice Cap and two tidewater outlet glaciers emanating from it. The Blancmange Glacier to the north separates CWM from Taylor Bluff and ends abruptly in a fjord-like inlet. The vertical ice-front is ~20 m high; numerous transverse crevasses near the snout suggest the acceleration of probably ungrounded ice and an increased propensity to calving. Supraglacial drainage is generated during the ablation period, with one supraglacial lake of dendritic shape having been observed over several seasons. The Haddington Ice Cap terminates as a gently sloped ice-front dissected by a dendritic or parallel network of shallow V-shaped gullies. Numerous cryoconite holes with a diameter of up to 15 cm and ice stratification were observed on the glacier terminus. Several snow banks and snow patches are located especially on the leeward (i.e. north-eastern) slopes.
The glacigenic assemblage is most clearly manifested as glacial deposits in the peripheral areas of the CWM foreland, especially in the form of ice-cored or degraded lateral and frontal moraines adjacent to the glacier margins. Unsorted subangular breccia and basalt boulders with affluent marks of glacial striation and polish predominate in the moraines. Lateral moraines close to the outlet glaciers form prominent landforms with ridges, while the moraines on the flat ice-divide near Lake Veronika are strongly degraded, resembling a surficial drift, with boulders perched upon the surface. Pebble–cobble gravel, which is widespread mainly in the CWM foreland area, is composed of basalts with an admixture of erratic cobbles. Larger erratic boulders are abundant throughout the CWM area, but mostly occur in the central part of the mesa, further from the cliff edges. The locations of more than 90 granitoid erratic boulders with a b-axis > 0.5 m were recorded, including 15 boulders found in the CWM foreland. Several boulders, mostly located in the northern part of the mesa, bear the marks of glacial striation (Fig. 2b). Only one striated bedrock outcrop was found on a basaltic frost-riven cliff. Two transposed sets of glacial striae and grooves are orientated at azimuths of ~75° and 130°.
The paraglacial assemblage comprises the lag deposits developed on the erratic-poor drift in the form of a 1–5 cm layer of cobbles and pebbles protecting a finer matrix from aeolian deflation. Numerous aeroxysts were observed in the central part of CWM. Along the steep cliffs of the mesa, vertically massive blocks and spires of lava-fed delta detach from the original surface and slide downslope upon the scree slopes or underlying ductile layers in large-scale mass movements. Other paraglacial landforms are found near the Haddington Ice Cap terminus. A degraded moraine close to the flat ice-divide area documents a recession of the glacier snout by ~200 m. Parallel to this moraine edge, a dry fluvial valley is deeply incised into hyaloclastite breccias. An analogous fluvial valley with a currently active lateral meltwater channel is adjacent to the present-day glacier snout. Another example of paraglacial landforms in terminoglacial areas is found near the ice-contact lakes Florencia, Rosa and proglacial Malvina: there is a series of strandlines, or prolonged horizontal steps in the slope profile, accompanied by changes in grain size. The majority of strandlines occur several metres above the present lake levels, although in the case of Florencia, the strandlines reach up to 60 m higher than the present water level of the ice-contact lake (Fig. 2d).
The periglacial assemblage is noticeable on the majority of CWM as a uniform blockfield composed of angular basaltic rubble. Patterned ground, especially sorted polygons and circles, is developed in low-lying water-saturated areas on the mesa. Sorted stripes frequently occupy moderately steep slopes, while sorted nets are abundant in the CWM foreland. The mean height to width ratios of these polygons at eight representative localities ranged from 0.1 to 0.25, and the elongation index (length to width ratio) varied from 1.1 (almost circular; Fig. 2c) to 1.5 (very shallow, prolonged polygons with small clast sizes). The periglacial assemblage further comprises solifluction lobes and terraces on low-gradient slopes, while rock glaciers and pronival ramparts occur on steeper debris-rich slopes beneath the mesa's cliffs.
Lake types and hydrology
Altogether, we surveyed, characterized and measured the basic parameters (water temperature, pH and conductivity) of 63 lakes or ponds in the CWM area (Fig. 1, Table I). Of these, 48 lakes are concentrated in the central-south-western part of CWM (the plateau itself). The remaining waterbodies are found at lower altitudes, close to the ice cap and tidewater glacier margins surrounding the CWM area. The altitude, area and other morphometric parameters are shown in Table I. Most of the mesa's lakes are found in a narrow range of elevation, at ~250 m a.s.l. However, there is great variability in lake surface areas, with the largest lakes (Katerina and Florencia) covering ~13 ha, to ponds with diameters of < 10 m (the surface area of ice-contact Lake Florencia is only an approximation due to floating icebergs and remnants of ice cover). Most lakes are circular or regular in shape, although lakes such as Trinidad and Malvina exhibit a higher degree of shoreline development. The lakes on the mesa are generally shallow, with Katerina reaching a maximum depth of ~1 m (Fig. S1). Other lakes, such as Argentina and Ludmila, are presumably deeper, although bathymetric data are lacking. All of the aforementioned lakes demonstrate rocky/gravely substratum and very low clastic input. Several closed basin lakes developed white–grey evaporite crusts on their coasts, documenting previous higher water levels and changing water supply.
Table I. Location and morphometric parameters of CWM lakes. Water samples for chemical analyses were taken from lakes indicated by bold font. Conductivity and pH denote ranges of multiple measurements taken in situ during the 2015 and 2016 summer seasons.

1 The shoreline development index relates the perimeter of a given lake to the circumference of a circle with equal surface area.
2 Calculated as the shortest path from the lake centroid to the coastline.
3 Lake types classified loosely following Nedbalová et al. (Reference Nedbalová, Nývlt, Kopáček, Šobr and Elster2013): 1) stable, shallow lakes on higher-lying volcanic surfaces, 2) stable, moraine-dammed lakes, 3) unstable, termino-glacial lakes in young moraines, and 4) kettle lakes.
4 Qualitative characterization of primary source of meltwater in the catchments of the lakes: 0 – no (semi-)permanent snow bank nor glacier as a source of water for the lake; 1 – snow banks; 2 – glacier.
5 Main drainage systems of the study area: 0 – closed or minor catchment; 1 – Florencia, 2 – Trinidad–Tatana, 3 – Norma, 4 – Florencia, 5 – Rosa.
* Readings from summer 2016 only.
** Single readings.
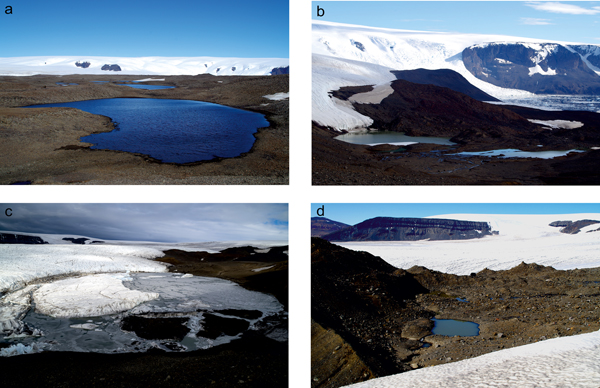
The majority of lakes and ponds on the mesa are located in depressions between the tumuli and were classified as stable, shallow lakes on higher-lying volcanic surfaces (type 1; Fig. 3a). These lakes are located primarily in the south-western part of CWM on the thick, impervious lava topsets, whereas the decreasing altitude and presumably also decreasing thickness of this capping layer farther north imply that more fissured and permeable hyaloclastite bedrock occurs at shallower depths and precludes any significant accumulation of water on the surface. Nonetheless, several lakes of this type also lie on hyaloclastite breccias of the CWM foreland (e.g. Andrea). Other lake types are underrepresented and are concentrated close to the ice cap margins. For example, several lakes (namely Cecilia, Malvina and Veronika) are moraine-dammed lakes (type 2; Fig. 3b). Although these lakes are relatively young compared to the first lake type, they appear more stable and therefore older than terminoglacial (ice-contact) lakes such as Florencia, Lilia and Rosa (type 3; Fig. 3c), which are dammed by both glacier ice and young moraine deposits. Finally, degrading ice-rich glacial deposits provide ideal conditions for the formation of rare kettle lakes, which include Miroslava and Tambucho (type 4; Fig. 3d).

Fig. 3. Lake types of CWM. a. Type 1: stable, shallow lake Ludmila on the volcanic surface of the mesa. b. Type 2: moraine-dammed lake Malvina (right) and type 3: ice-contact (terminoglacial) lake Rosa (left) in the young glacial deposits. c. Type 3: ice-contact lake Florencia with floating icebergs and remnants of ice cover (some of which were heavily loaded with debris from the nearby scree slope). d. Kettle lake Tambucho; a large ice lens of the ice-cored moraine was found adjacent to the north side of the lake.
The main water source for the lakes is (sub-)surface runoff from melting snow, active layers and (in lakes of types 2–4) glacier ice. Some waterbodies in the open drainage basins are connected by ephemeral surficial streams. During the 2015 and 2016 campaigns, outflows from lakes Graciela and Julia exited the mesa as waterfalls/icefalls over cliff edges. No surface outflow was identified for approximately a third of all lakes and these were thus provisionally classified as endorheic (closed-basin) lakes (Table I). The remaining lakes were organized into five primary (and several minor) drainage systems (Figs 1 & 4):
i) Katerina system: the largest catchment formed around Lake Katerina. Other lakes, including Lara, Daniela, Miriam and Ileana, drain into this system only when lake levels rise. Lakes Delia and Vlasta may have subsurface connectivity only.
ii) Trinidad–Tatana system: Trinidad and Tatana sub-catchments are connected only at higher lake levels.
iii) Norma system: the outflowing stream from Lake Norma vanishes into the fissured ground before reaching the mesa's edge.
iv) Florencia system: proglacial; the course of the stream draining Florencia follows a depression between the lateral moraine and glacier margin before disappearing into the glacier interior.
v) Rosa system: proglacial; the lakes are drained by a single stream, but part of the discharge is routed sub-surficially via the seepage in the moraine impounding Lake Rosa.
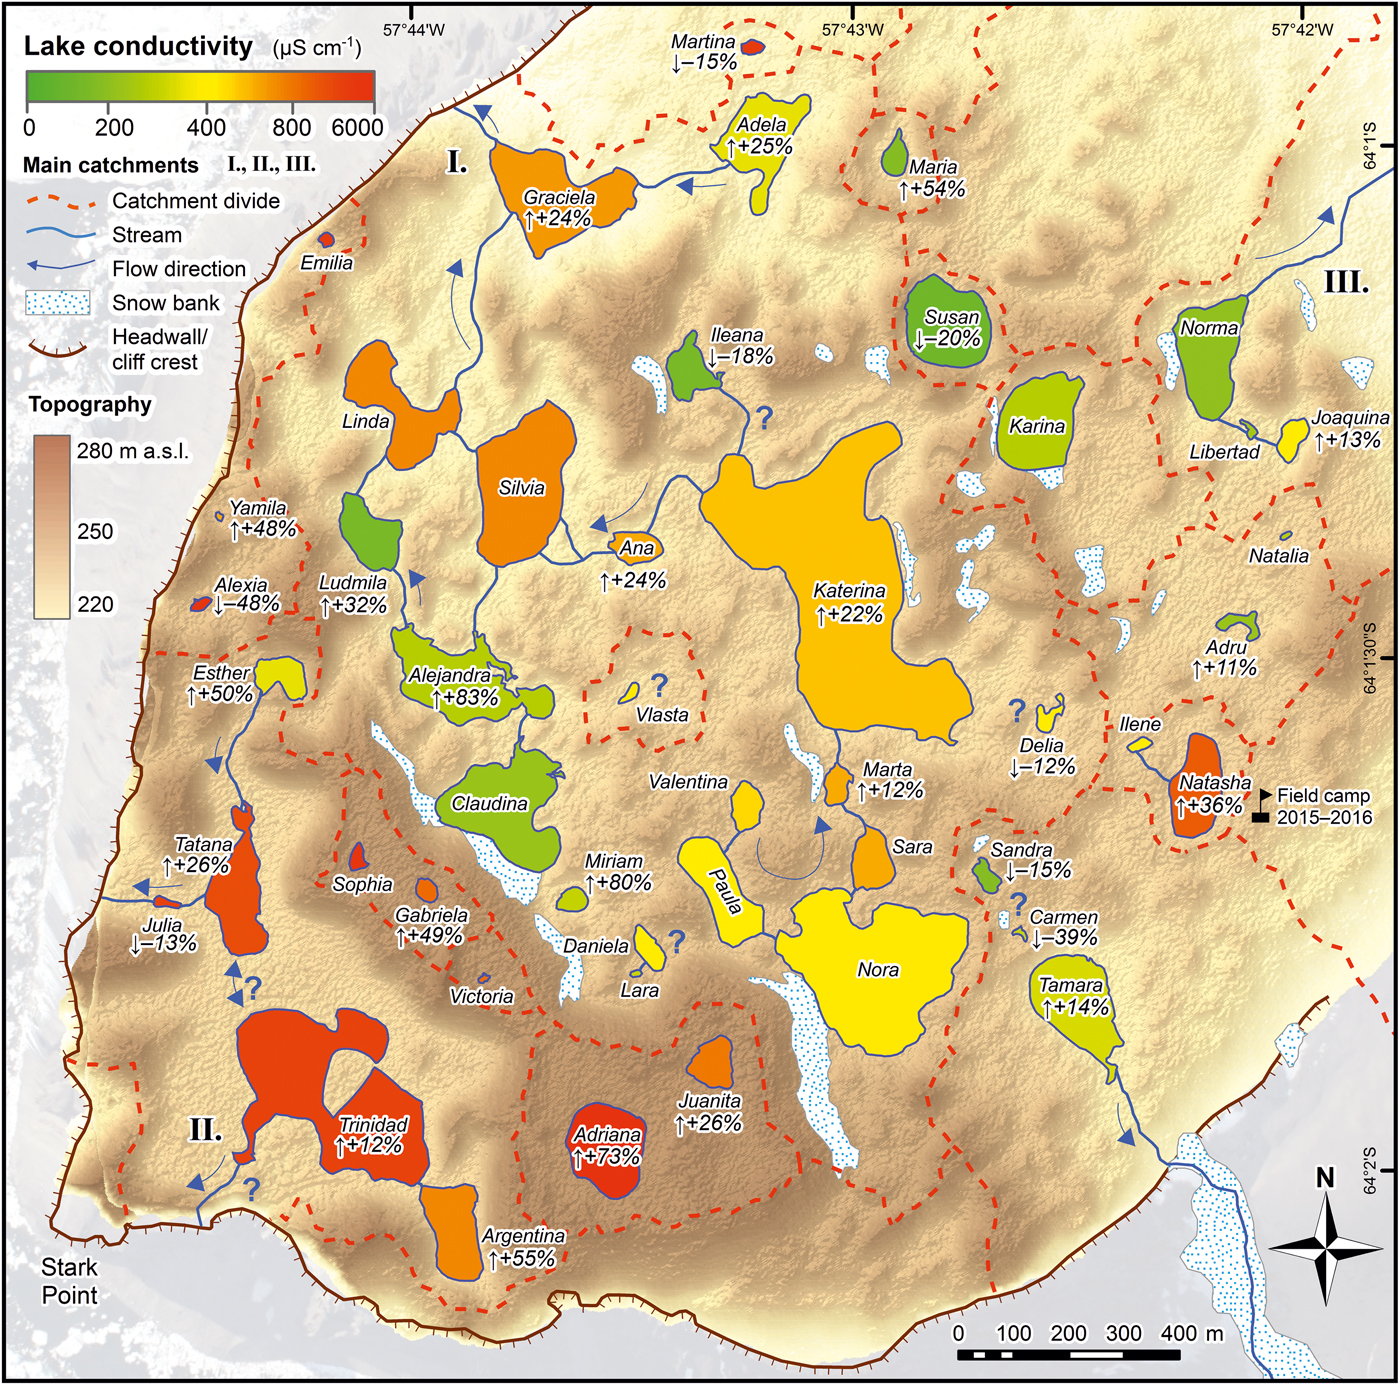
Fig. 4. The inferred hydrological system of CWM comprises several sub-catchments formed around the main lakes Katerina, Norma and Trinidad–Tatana. Lake conductivity (averaged for all measurements taken over the 2015 and 2016 summer seasons, if available) is represented on a colour scale. Conductivity changes between 2015 and 2016 (where difference was > ±10% and at least two readings per season were available) are denoted below the lake name. Note that not all snow banks (feeding lakes with mostly low conductivity) observed during the field campaigns are pictured in this map, which is based on an aerial image from 2014.
The remaining lakes on CWM lie within much smaller, usually endorheic basins, where surface water flow was not observed, although subsurface seepage through the thawed active layer cannot be excluded (e.g. lakes Sandra, Carmen and Tamara, or Daniela and Paula). In addition, several lakes and ponds are impounded only by shallow sills that may overflow after the water level rises from precipitation or melt. The current hydrometeorological situation, and corresponding hydrological balance, will thus affect the connectivity of the lakes.
Lake water physical and chemical characteristics
Lakes were mostly ice free during the three field campaigns, although brief periods of freeze-over occurred even at the height of the summer season. Water temperatures at the sampling sites ranged from 1.5 to 22.4°C and was highly dependent on current meteorological conditions, as well as lake size and type. In lakes of type 1, water temperatures usually surpassed 10°C, whereas proglacial lakes were colder, with Lake Florencia reaching only ~2°C and partially sustaining ice cover over summer. The logger deployed in the largest type 1 lake, Katerina, showed that in January 2015 temperatures varied from ~0°C to ~15°C, with large diurnal oscillations of up to ~10°C (Fig. S2). The development of lake ice cover following the sudden air temperature drops in mid-January 2015 and mid-February 2016 was connected with periods of strong south-westerly windstorms. In January 2015, lake ice cover melted after a few days, whereas ice in February 2016 probably indicated the onset of the winter ice cover period.
Waterbodies exhibited a large gradient in conductivity (Fig. 4, Table I). The highest values were recorded from the closed-basin lakes (median 765 μS cm−1 in reliably classified endorheic lakes in contrast to 356 μS cm−1 for open-basin lakes; compare with Fig. 5a) and the Trinidad–Tatana catchment. Lakes Adriana and Erminda showed the highest conductivity values of 7170 and 6010 μS cm−1, respectively. In the largest catchment, Katerina, there was a clear gradient in conductivity, with lower values in higher-lying lakes influenced by the melting of snowbanks (Fig. 4). There was a significant difference in conductivities between old (type 1) and young lakes (types 2–4; Fig. 5b). Overall, the lowest conductivities were found in ice-contact lakes (type 3, mean 50 μS cm−1), reflecting the input of diluted glacial meltwater (Fig. 5c). By contrast, conductivity generally increased closer to the sea, as evidenced by a significant negative exponential relationship between conductivity and the distance from the coastline (r 2 = 0.32; Fig. 6). In lakes where at least two readings per season were recorded (in order to eliminate randomness related to possibly unrepresentative single measurements), a rather high inter-annual variability was observed. Generally, lake water conductivity increased in ~30% of lakes between the summers of 2015 and 2016, with the highest increase (~50–85%) in Adriana, Argentina, Alejandra or Miriam. However, most lakes that were sampled in both years exhibited negligible change, but conductivity even noticeably decreased (by ~48–80%) in several lakes (e.g. Alexia, Carmen and Irma) and young lakes of type 1 (e.g. Florencia and Cecilia). Lake water conductivity changes between the two years are shown in Fig. 7. Compared to conductivity, lake water pH (measured in situ) was less variable and generally slightly alkaline (average values for individual lakes 8.1–9.3; Table I).

Fig. 5. Box and whisker plots showing the water conductivity of different lakes classified according to: a. basin type (open vs closed), b. lake type (generalized to old and young lakes) and c. source of the meltwater for the lake. Medians (bars), 25% and 75% quartiles (boxes) and 10% and 90% percentiles (whiskers) are shown; note that different y-axis scales are given for greater clarity. Differences among lake categories were tested using Mann–Whitney or Kruskal–Wallis tests with a Dunn's multiple comparison test; lower-case letters above the plots (a, b) indicate significant differences.

Fig. 6. Mean lake water conductivity (on a log10 scale) plotted against the distance to the coastline. Lakes are classified according to the hydrological connectivity of their catchment (open basins – filled symbols; closed basins – open symbols) and water source (no large snow bank nor glacier present in catchment – circles; snow bank-fed lakes – squares; glacier-fed lakes – triangles). The exponential regression computed for all lakes explains 33% of the variability.

Fig. 7. Comparison of lake water conductivity between the summers of 2015 and 2016. Line 1:1 denotes no change in conductivity between the years. If the point lies above the line, conductivity increased. Lakes are classified as having open (black) or closed basins (white), with snow banks present in a substantial part of the lake catchment (squares) or mostly absent (circles). Of the glacier-fed lakes, only Florencia was measured in both years, showing a dramatic decline between the two years (from 130 to 27 μS cm−1).
Major ion and nutrient concentrations varied within a wide range of 2–3 orders of magnitude (Tables II & S1), reflecting different contributions of precipitation and sea spray to lake water composition. Chloride played the dominant role among strong acid anions (SO42−, Cl− and NO3−), contributing 92% on average to their total equivalent pool (one equivalent is one mole of charge), similar to the average composition of seawater (91%) (Sarmiento & Gruber Reference Sarmiento and Gruber2006). Sulphate contributed 8% on average, and nitrate concentrations were negligible (Table III). Base cations (BCs; Ca2+, Mg2+, Na+ and K+) were dominated by sodium, corresponding to seawater, but at a lower proportion (62 vs 76%). In contrast, average proportions of magnesium (30%) and calcium (6%) were higher in the lakes than in seawater (where they reach 19% and 3%, respectively). This composition of BCs suggests that lake water was to a large extent affected by sea spray, diluted by precipitation and amended by magnesium and calcium from weathering. The weathering was also a significant source of bicarbonate for lake water, and the equivalent ratios of HCO3−:Ca and HCO3−:Mg were on average ~20 times higher in lakes than in seawater.
Table II. Minimum, median and maximum values of basic chemical characteristics of the 29 lakes analysed during 2009–16 (detailed values are presented in Tables III & S1).

Abbreviations: Cond. = conductivity (at 25°C); ANC = acid neutralizing capacity, SAAs = strong acid anions (SO42-, NO3− and Cl−), BCs = base cations (Ca2+, Mg2+, Na+ and K+), TN = total nitrogen; TP = total phosphorus, DOC = dissolved organic carbon.
One equivalent (eq) is one mole of charge.
Table III. Detailed chemical characteristics of five lakes sampled in 2009.

Abbreviations: Cond. = conductivity (at 25°C), ANC = acid neutralizing capacity, DON = dissolved organic nitrogen, TN = total nitrogen, DP = dissolved phosphorus, SRP = solved reactive phosphorus, TP = total phosphorus, DOC = dissolved organic carbon, PC = particulate carbon.
Conductivity and pH are laboratory values.
Concentrations of TN varied between 0.3 and 5.9 mg l−1 and were dominated by organic N, with concentrations of reactive N forms being generally low (Table III). Concentrations of DOC were surprisingly high in some lakes (up to 13 mg l−1) and were most probably autochthonous in origin (presumably originating from cyanobacterial growth and decay). The highest TP concentrations (> 0.05 mg l−1) were found in the lakes situated in the CWM foreland. Soluble reactive phosphorus concentrations in the 2009 samples were below 10 µg l−1. High average molar TN:TP and DOC:TP ratios of 104 and 600, respectively, suggest that lake primary production was P limited.
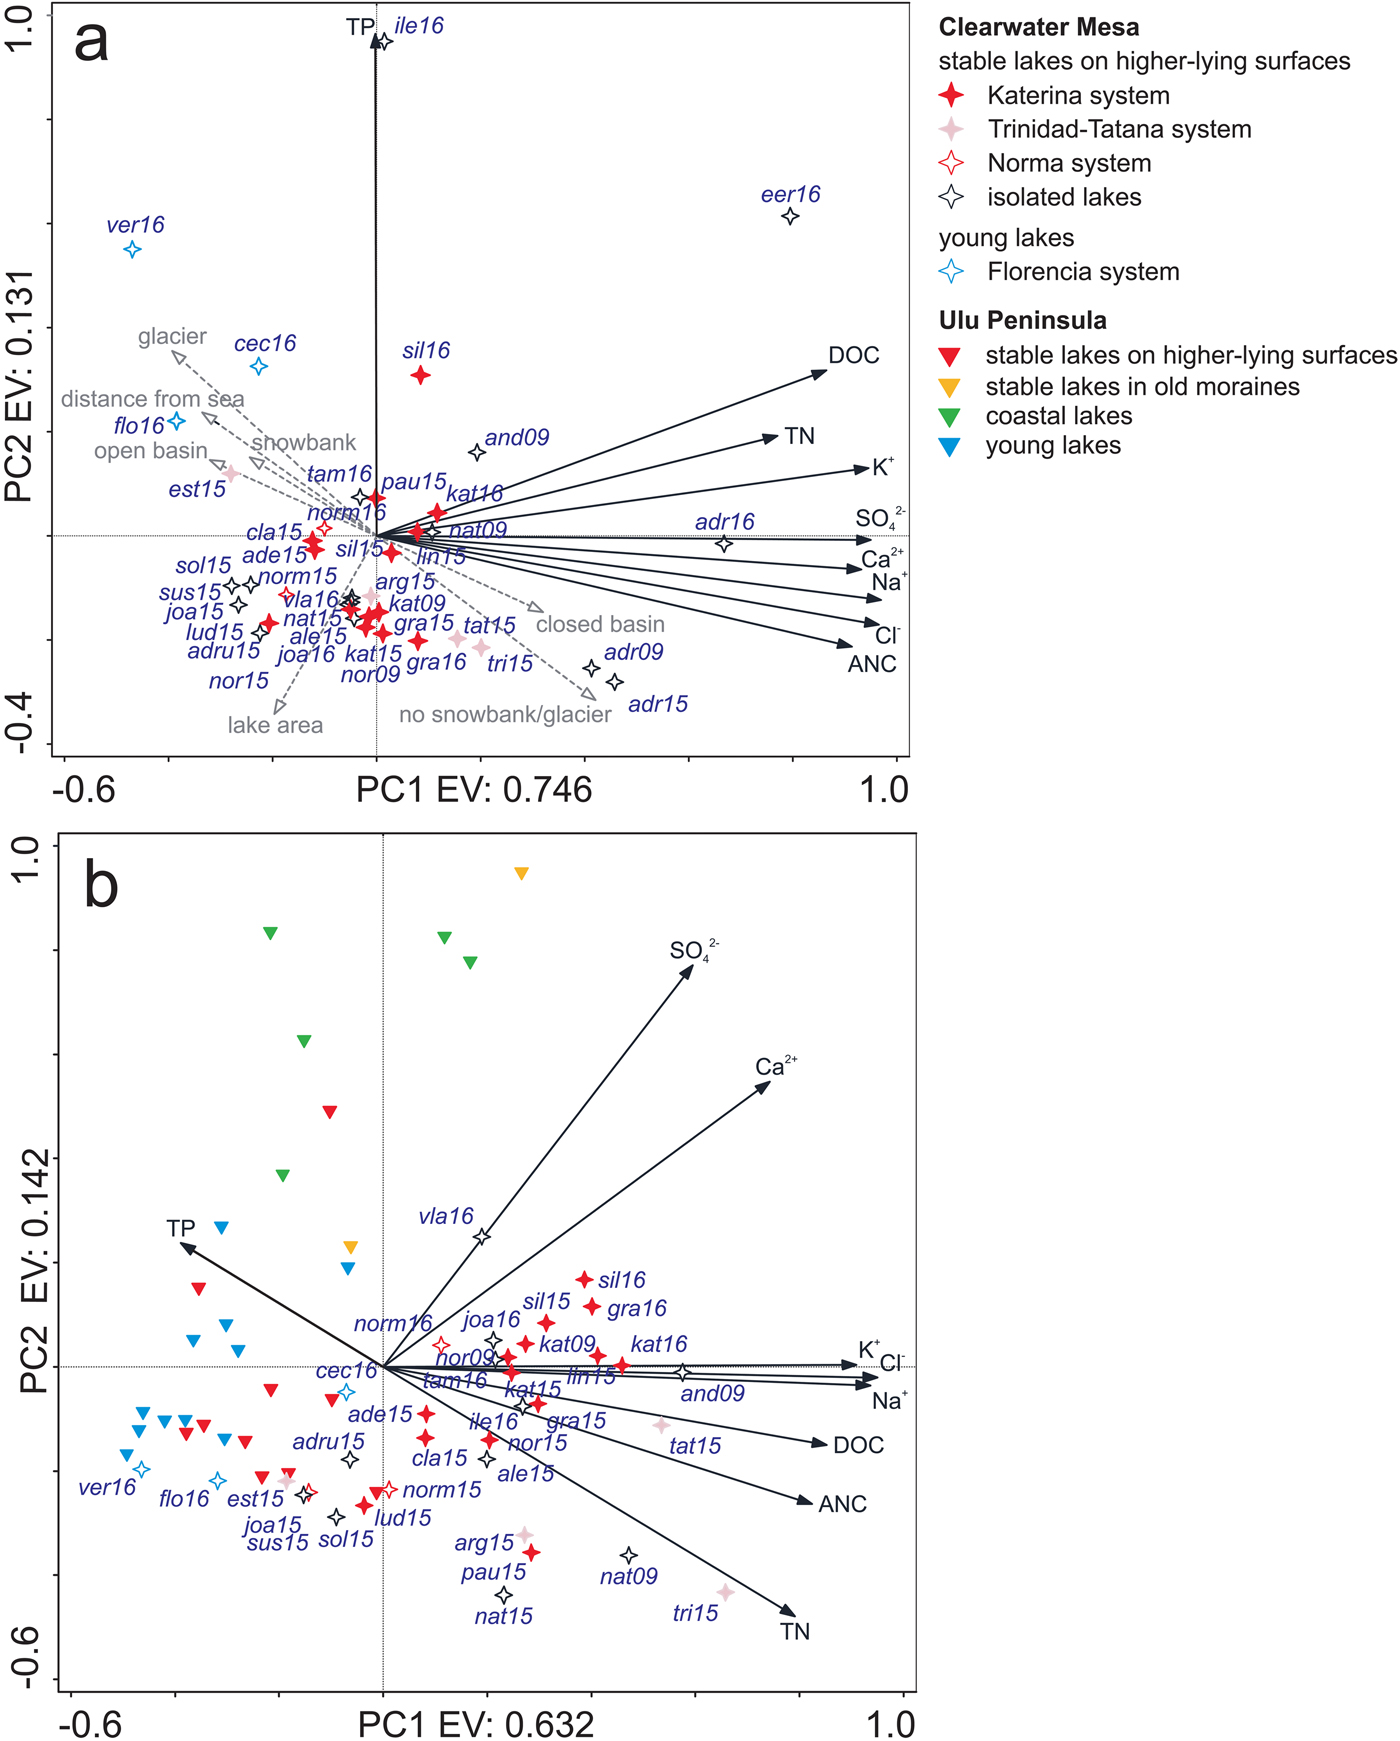
The PCA generated for the CWM dataset showed that the first axis was associated with conductivity, DOC and ANC, and it explained a major part of the variability (74.6%), whereas the second axis was primarily related to TP (Fig. 8a). The proglacial Florencia system located on the CWM foreland was characterized by diluted waters with TN concentrations < 0.025 mg l−1 and with relatively high TP concentrations (up to 0.103 mg l−1 in Veronika). Overall, there was a gradient along the first axis from the Florencia system lakes to the most concentrated lakes Adriana and Erminda. The PCA combining both the CWM and Ulu Peninsula datasets (Nedbalová et al. Reference Nedbalová, Nývlt, Kopáček, Šobr and Elster2013) showed a similar pattern, with the first axis associated with concentrations of major ions, DOC and ANC explaining 63.2% of the variability (Fig. 8b). The analysis also revealed a negative correlation of TN and TP across both datasets, reflecting generally higher TN and lower TP concentrations in CWM lakes in comparison with the Ulu Peninsula lakes (medians of TN 0.800 vs 0.248 mg l−1 and TP 0.018 vs 0.054 mg l−1). In general, the CWM dataset exhibited larger variability across the first axis in comparison with the Ulu Peninsula lakes, which showed more variability on the second axis. However, some lakes from the two regions clustered together. For example, the Florencia system lakes showed strong similarities with the young lakes on the Ulu Peninsula and some of the CWM lakes on higher-lying surfaces clustered near corresponding Ulu Peninsula lake types.

Fig. 8. The PCA of the chemical parameters of a. CWM and b. CWM and Ulu Peninsula lake datasets combined. The two lakes with the highest conductivities (Adriana and Erminda) were excluded from the second analysis due to their disproportionate effects on the PCA projection. Additional CWM lake characteristics (lake area, distance from the sea, basin type and main meltwater source) were added as supplementary variables in a. and are visualised as dashed grey arrow lines. The data of the Ulu Peninsula lakes are from Nedbalová et al. (Reference Nedbalová, Nývlt, Kopáček, Šobr and Elster2013). For sample acronyms, see Tables III and S1.
Flora and fauna
The bottoms of most waterbodies were carpeted with orange, green and pink microbial mats, presumably composed primarily of filamentous cyanobacteria and to a lesser extent green algae and diatoms. Around the margins of the lakes, lying directly over the adjacent saturated sediments, black clumps of Nostoc with patches of mosses were found (Fig. S3). The abundance of these microbial consortia indicate that high rates of nutrient uptake and biogeochemical transformations are probable, and they provide an energy source for populations of the fairy shrimp Branchinecta gaini and the calanoid copepod Boeckella poppei, which were also observed in the majority of the lakes.
Outside the lakes, lichens were the most conspicuous feature of the rock surfaces and ranged from brilliant orange crustose varieties through dark foliose types to long fruticose grey–green types (Fig. S3). The lichens were observed growing in cracks, cavities and on the lee sides of rock surfaces, protected thus from wind abrasion and exploiting more humid conditions from snowdrift accumulation. Fauna includes scattered individuals of the Antarctic tern (Sterna vittata) that were observed in close vicinity to the lakes. A tern colony was established near the kettle lake Elena in 2016. Skuas (Catharacta spp.) were also observed in the CWM area, and a few individuals were breeding near lakes Nora and Soledad. Individuals of the Antarctic fur seal (Arctocephalus gazella) and Weddell seal (Leptonychotes weddellii) were spotted on the packed sea ice and the coast of the southern embayment of the CWM foreland; two mummified seal carcasses in various degrees of decay were also registered near the CWM foreland catchment divide.
Discussion
Long-term landscape evolution of the mesa
A wealth of previous work on the landscape evolution of the James Ross Archipelago (e.g. Johnson et al. Reference Johnson, Smellie, Nelson and Stuart2009, Reference Johnson, Bentley, Roberts, Binnie and Freeman2011, Davies et al. Reference Davies, Glasser, Carrivick, Hambrey, Smellie and Nývlt2013), including the formation of volcanic mesas (Smellie et al. Reference Smellie, Johnson, McIntosh, Esser, Gudmundsson, Hambrey and van Wyk de Vries2008, Reference Smellie, Johnson and Nelson2013), allowed us to compare and interpret the geomorphological landforms of CWM and thus infer its probable origin and history. The mesa was formed in a basaltic subglacial effusive eruption that produced steeply dipping lava-fed deltaic foresets of subaqueously deposited hyaloclastite breccias capped by the subhorizontal topset layer of subaerial pahoehoe lavas (Smellie et al. Reference Smellie, Johnson, McIntosh, Esser, Gudmundsson, Hambrey and van Wyk de Vries2008). No dating of volcanic rocks has been performed directly for CWM, but a visual correlation of lava-fed deltas may help overcome the lack of dating control. Smellie et al. (Reference Smellie, Johnson and Nelson2013) ascribed the CWM tuya to the Forster Cliffs Formation, which stretches over large portions of the north-eastern JRI, probably as far as St Rita Point. Subaerial lava caprock of this formation was dated ~5 km to the east from CWM at 2.5 ± 0.07 Ma ago (Smellie et al. Reference Smellie, Johnson, McIntosh, Esser, Gudmundsson, Hambrey and van Wyk de Vries2008); the tuya surface, however, reaches a slightly higher altitude there than at CWM (i.e. 320–400 m a.s.l. compared to 250–275 m a.s.l.). Subaerial lava caprock of this formation also crops out at Taylor Bluff, where it is overlain by a columnar intrusion, probably a remnant of a ‘thin ice’ vent deposit (Smellie et al. Reference Smellie, Johnson, McIntosh, Esser, Gudmundsson, Hambrey and van Wyk de Vries2008). The altitude and thickness of this lava-fed delta topset at Taylor Bluff visually correspond with those at CWM, located across the bay of Blancmange Glacier. We therefore argue that both of these sites might be cogenetic (i.e. part of a single large lava-fed delta) or that they formed during the same phase of volcanic activity from neighbouring eruptive centres or branches of a lava stream under similar conditions (such as ice thickness or relative sea level at that time). Taylor Bluff and CWM were subsequently separated by erosional deepening of the Blancmange outlet glacier. Considering their structural relationship, the tuya(s) must have formed earlier than the columnar intrusion of the vent deposit at Taylor Bluff, dated at 2.03 ± 0.13 Ma ago (Smellie et al. Reference Smellie, Johnson, McIntosh, Esser, Gudmundsson, Hambrey and van Wyk de Vries2008). The observational evidence thus suggests an early Pleistocene age for CWM, with formation probably occurring during a period of intensive volcanic activity ~2.5 Ma ago. The hyaloclastite breccias composing the CWM foreland are probably older, and on the map of Smellie et al. (Reference Smellie, Johnson and Nelson2013) they are assigned to the Taylor Bluff Formation. According to the dating of deltas and dykes in the Blancmange Hills, the breccias formed 5.85 ± 0.03 Ma ago (Smellie et al. Reference Smellie, Johnson, McIntosh, Esser, Gudmundsson, Hambrey and van Wyk de Vries2008).
The CWM tuya probably originated in a glaciovolcanic eruption, similar to the majority of JRI Volcanic Group lava-fed deltas (Skilling Reference Skilling, Smellie and Chapman2002). Deposition in an englacial lake is suggested by large-scale slumping of the foresets and subaerial lava flows (which are banked against older foreset-bedded breccias) and Surtseyan tephra-jet deposits (formed in littoral explosions), pointing to sudden changes in water level and even catastrophic drainage (Skilling Reference Skilling, Smellie and Chapman2002). On the other hand, the exemplary Stark Point profile displays uninterrupted lava lobes up to 2.7 km wide, lacking features such as falling or rising passage zones, which would indicate variable glacial lake levels (Smellie et al. Reference Smellie, Johnson, McIntosh, Esser, Gudmundsson, Hambrey and van Wyk de Vries2008). However, based on the correlation with lava-fed deltas of the Forster Cliff Formation that were emplaced englacially (Smellie et al. Reference Smellie, Johnson, McIntosh, Esser, Gudmundsson, Hambrey and van Wyk de Vries2008), we assume a glaciovolcanic (rather than marine) origin for CWM as well.
The relief of the mesa with its tumuli and depressions, probably formed by inflation of lava flows or ‘blisters’ during emplacement and resulting in the formation of the lake basins, suggests the mesa itself has never been extensively overridden by erosive ice. The survival of a relatively complex, uneven topography (at the macro-scale) on the mesa plateau is attributed to conservation of the primary volcanogenic relief by the cold-based dome or plateau glacier for extended periods of time (Johnson et al. Reference Johnson, Smellie, Nelson and Stuart2009). On the other hand, the mesa has probably been glaciated for shorter periods of time than the higher-lying Patalamon Mesa and Crisscross Crags on JRI (Johnson et al. Reference Johnson, Smellie, Nelson and Stuart2009). This explanation is supported by the almost ubiquitous presence of autochthonous blockfields formed by the in situ frost weathering (and other periglacial and paraglacial landforms, such as aeroxysts) during prolonged ice-free periods. In addition, primary volcanogenic small-scale features like ropy lava textures are less common, as they were modified by weathering. The former ice cover is further documented by very thin pebble–cobble gravel cover found in depressions and interpreted as a glacigenic erratic-poor drift (Davies et al. Reference Davies, Glasser, Carrivick, Hambrey, Smellie and Nývlt2013). This erratic-poor drift is thicker and more clearly developed in the CWM foreland, where the paraglacial processes, namely wind-driven deflation, created the lag deposits (i.e. a coarse pebble–cobble armour over finer particles of hyaloclastite breccia palagonite tuff). The ubiquitous presence of erratic boulders, mainly granitoids and metasediments, provides evidence that the Antarctic Peninsula Ice Sheet previously overran CWM (Johnson et al. Reference Johnson, Bentley, Roberts, Binnie and Freeman2011, Davies et al. Reference Davies, Glasser, Carrivick, Hambrey, Smellie and Nývlt2013). There arguably remains the possibility that the erratic material was reworked from older glacimarine Neogene diamictons by local glaciers (Davies et al. Reference Davies, Glasser, Carrivick, Hambrey, Smellie and Nývlt2013), but all studies concerned with deglaciation of JRI are based on the assumption that the erratics were deposited in the last glacial cycle by the Antarctic Peninsula Ice Sheet (Johnson et al. Reference Johnson, Bentley, Roberts, Binnie and Freeman2011; Glasser et al. Reference Glasser, Davies, Carrivick, Rodés, Hambrey, Smellie and Domack2014; Nývlt et al. Reference Nývlt, Braucher, Engel and Mlčoch2014), even though deposition during the previous glacial cycles cannot be ruled out (Davies et al. Reference Davies, Glasser, Carrivick, Hambrey, Smellie and Nývlt2013). The origin of type 1 lakes is connected with this last deglaciation of CWM. However, the precise timing of this event has not yet been determined radiometrically, and we can only speculate about its timing during the Pleistocene–Holocene transition or the early Holocene based on deglaciation chronologies available from the James Ross Archipelago, where the ages range from 13 to 5 ka bp (Björck et al. Reference Björck, Olsson, Ellis-Evans, Håkansson, Humlum and Lirio1996, Johnson et al. Reference Johnson, Bentley, Roberts, Binnie and Freeman2011, Glasser et al. Reference Glasser, Davies, Carrivick, Rodés, Hambrey, Smellie and Domack2014, Nývlt et al. Reference Nývlt, Braucher, Engel and Mlčoch2014). In further work, we intend to use samples of granite erratic boulders from the mesa for terrestrial in situ cosmogenic dating, supplemented by Schmidt hammer measurements, in order to determine the pattern and timing of the CWM deglaciation.
Focusing on more recent changes, a series of horizontal strandlines above the present-day lake levels is an indicator of past lake-level fluctuations (Fig. 2d). In the case of Lake Florencia, the strandlines occur up to 60 m above the present lake level and must have been formed during the palaeolake high stand, when the lake was wedged between the valley slope and the correspondingly thicker Blancmange Glacier. Significant retreat and lowering of the ice surface (by > 60 m) must have occurred since the glacier was able to impound such a waterbody. Davies et al. (Reference Davies, Carrivick, Glasser, Hambrey and Smellie2012) indeed document the loss of ~1.5 km2 in the floating tongue area of Blancmange Glacier ('GIJR67' in their inventory) between 1988 and 1997, which may have been accompanied, or preceded, by surface lowering. Similarly, for two land-terminating glaciers on Ulu Peninsula (to the north-west of CWM), Engel et al. (Reference Engel, Nývlt and Láska2012) reported surface lowering of 8.5–10.1 m over 27 years between 1979 and 2006. Most other glacigenic and paraglacial landforms, and related lakes of types 2, 3 and 4, along the ice cap margins in the CWM foreland also seem to have resulted from relatively recent ice retreat, and might be correlated with post-Neoglacial/Little Ice Age glacier recession following the warming or precipitation deficit over recent centuries (Carrivick et al. Reference Carrivick, Davies, Glasser, Nývlt and Hambrey2012, Sterken et al. Reference Sterken, Roberts, Hodgson, Vyverman, Balbo and Sabbe2012, Nedbalová et al. Reference Nedbalová, Nývlt, Kopáček, Šobr and Elster2013), with significant intensification in the second half of the twentieth century (Engel et al. Reference Engel, Nývlt and Láska2012, Turner et al. Reference Turner, Lu, White, King, Phillips and Hosking2016). All of the above points to a significant response of the landscape to recent climatic changes (Carrivick et al. Reference Carrivick, Davies, Glasser, Nývlt and Hambrey2012, Davies et al. Reference Davies, Carrivick, Glasser, Hambrey and Smellie2012). Due to predicted warming and glacier recession in the twenty-first century (ATCM 2015), abundant volcanic mesas of the James Ross Archipelago, the majority of which are at least partially covered by local ice caps, are expected to experience glacier shrinkage and the formation of new lakes. Clearwater Mesa could thus offer a model of limnological and landscape evolution in a more mature stage of development for comparison with other, currently deglaciating volcanic mesas of the archipelago.
Lake types and physical and chemical limnology
Previous investigations of lakes from other ice-free areas of the Antarctic Peninsula have reported a wide diversity of lake types (Vinocur & Unrein Reference Vinocur and Unrein2000, Nedbalová et al. Reference Nedbalová, Nývlt, Kopáček, Šobr and Elster2013, Lecomte et al. Reference Lecomte, Vignoni, Córdoba, Chaparro, Chaparro and Kopalová2016). Nedbalová et al. (Reference Nedbalová, Nývlt, Kopáček, Šobr and Elster2013) divided the waterbodies studied on the Ulu Peninsula into six lake types, based upon their age, stability and physicochemical properties. A similar classification scheme may be applied to CWM lakes, although the vast majority of lakes here (all lakes on the plateau itself) belong to type 1 (i.e. stable, shallow lakes on high-lying volcanic surfaces) that presumably originated after the last deglaciation in the Late Pleistocene or Early Holocene. While these lakes are more uniform in depth, altitude and age, they are still highly divergent in water chemistry. Sudden changes in conductivity and ionic concentrations were observed across small distances, often between hydrologically connected waterbodies. The PCA of the CWM dataset (Fig. 8) also revealed great diversity of chemical characteristics, although it was not able to differentiate between the main catchment systems located on the plateau. Such hydrochemical variability is unusual for lakes located on the volcanic mesas of JRI. For example, conductivity measured for the lakes of Lagoons Mesa (across the Croft Bay to the west of CWM) were all in the range of 50–170 μS cm−1, although pH varied from 7.2 to 9.8 (Nedbalová et al. Reference Nedbalová, Nývlt, Kopáček, Šobr and Elster2013, Lecomte et al. Reference Lecomte, Vignoni, Córdoba, Chaparro, Chaparro and Kopalová2016). By comparison, CWM lakes exhibit a much greater conductivity gradient, not only spatially, but also temporally between the field campaigns.
The major ion composition of CWM lakes suggests that sea spray is the dominant source of ions, followed by the weathering of bedrock. The input of ions from the marine environment to lakes is largely determined by the distance from the sea shore (Borghini & Bargagli Reference Borghini and Bargagli2004). Traditionally, a strong marine influence was assumed only for coastal sites with much lower elevations (Vinocur & Unrein Reference Vinocur and Unrein2000, Toro et al. Reference Toro, Camacho, Rochera, Rico, Bañón and Fernández-Valiente2007, Roberts et al. Reference Roberts, Hodgson, Sterken, Whitehouse, Verleyen and Vyverman2011, Nedbalová et al. Reference Nedbalová, Nývlt, Kopáček, Šobr and Elster2013), but long-distance transport of marine aerosols should not be overlooked, as reported from the McMurdo Dry Valleys in East Antarctica (Lyons et al. Reference Lyons, Welch, Gardner, Jaros, Moorhead, Knoepfle and Doran2012, Sakaeva et al. Reference Sakaeva, Sokol, Kohler, Stanish, Spaulding and Howkins2016). The effect of strong barrier winds on the chemical composition of CWM lakes via sea spray is apparently important despite the relatively high altitude. During spells of strong south-westerly windstorms, the air subsides and is funnelled from the JRI plateau to sea level in the constricted southern part of Croft Bay, where it may be enriched with marine aerosols, before it is forced to rise up upon encountering the cliffs of CWM. This can be demonstrated within the lakes of the Tatana–Trinidad catchment and other lakes with high conductivity close to the vertical cliffs of CWM, which are exposed to these south-westerly winds (Fig. 6). Strong winds also contribute to desiccation even in near-freezing temperatures, and may maintain a low or negative precipitation–evaporation balance. Moreover, persistent winds encourage the formation of snow banks on north-eastern lee slopes (van Lipzig et al. Reference van Lipzig, King, Lachlan-Cope and van den Broeke2004, Carrivick et al. Reference Carrivick, Davies, Glasser, Nývlt and Hambrey2012, Engel et al. Reference Engel, Láska, Nývlt and Stachoň2018), which then provide meltwater to the streams and lakes. By contrast, strong winds tend to remove snow from flat and convex landforms. Subtle differences in the geomorphology of lake catchments promote a variable distribution of snowpacks on the slopes surrounding the lakes, which then receive various quantities of meltwater (Hodgson et al. Reference Hodgson, Vyverman and Sabbe2001, Van Hove et al. Reference Van Hove, Belzile, Gibson and Vincent2006). Simultaneously, however, the marine aerosols tend to accumulate in snow cover more readily than on bare ground, so the lakes with greater catchment areas and more favourable geomorphology (i.e. enough downwind-orientated slopes or depressions, but near the exposed cliffs of CWM) may receive relatively more salt-enriched meltwater. Consequently, small-scale changes in sea spray influx, snow accumulation and redistribution between years, induced by the differing mean wind direction and intensity of the major windstorms, may then lead to nonlinear, or even opposing, inter-annual differences in ionic concentrations.
Current meteorological conditions are crucial not only for marine aerosol and snow distributions, but also for evaporative processes (Verleyen et al. Reference Verleyen, Hodgson, Vyverman, Roberts, McMinn, Vanhoutte and Sabbe2003, Váczi et al. Reference Váczi, Barták, Nedbalová and Elster2011). However, the periods of warm weather responsible for concentration by evaporation can also intensify the melting of snowpacks and glaciers, leading to lake water dilution (Lyons et al. Reference Lyons, Welch, Gardner, Jaros, Moorhead, Knoepfle and Doran2012, Verleyen et al. Reference Verleyen, Hodgson, Gibson, Imura, Kaup and Kudoh2012). Since 2016 was the warmest year on record at J.G. Mendel Station (Ambrožová et al. Reference Ambrožová, Láska, Hrbáček, Kavan and Ondruch2019), the conductivity in most lakes of type 1 on CWM generally increased between 2015 and 2016 due to evaporative concentration, whereas a decrease was observed in several snow bank-fed and glacier-fed lakes from enhanced melt (Fig. 7). However, a decrease was also observed in a few closed-basin lakes without any perennial snow banks or glaciers present in their catchments, which again points to other factors influencing conductivity, such as the aforementioned sea spray delivery and snow redistribution.
The alkaline lavas of the CWM bedrock provide ions that leach into surface waters as a result of long-term, low-rate weathering processes (as opposed to high-rate processes of sea spray delivery and precipitation; Lecomte et al. Reference Lecomte, Vignoni, Córdoba, Chaparro, Chaparro and Kopalová2016). As deduced from ionic ratios, substantial amounts of Mg2+, Ca2+, Si and HCO3− in CWM lakes are derived from the weathering of aluminosilicate and alkaline earth-rich minerals (Lyons et al. Reference Lyons, Welch, Gardner, Jaros, Moorhead, Knoepfle and Doran2012). The efficiency of weathering might be facilitated in this cold environment by fragmented bedrock and the relatively long residence time of water percolating through the active layer and permafrost, particularly in closed basins (Kopáček et al. Reference Kopáček, Kaňa, Bičárová, Fernandez, Hejzlar and Kahounová2017). Variable chemical compositions or structural properties of individual lava flow ‘levels’ and breccias might then be called to explain part of the observed hydrochemical diversity on CWM. However, the chemical composition of the bedrock should be consistent for the whole tuya, given that it formed in a single volcanic eruption sourced by magma of uniform, stable composition (Smellie et al. Reference Smellie, Johnson, McIntosh, Esser, Gudmundsson, Hambrey and van Wyk de Vries2008). In addition, the entire mesa is covered by homogeneous blockfield, so the specific surface area of rock fragments should be approximately the same, which does not allow for differences in the weathering rate (which is generally higher on fragmented, rather than massive surfaces; Kopáček et al. Reference Kopáček, Kaňa, Bičárová, Fernandez, Hejzlar and Kahounová2017). Therefore, structural and lithological properties probably do not explain the observed hydrochemical variability. In contrast, the variable bedrock types (correlated with lake types) found across the Ulu Peninsula, including volcanic rocks similar to CWM and Cretaceous marine sediments, significantly contributed to the diversity of lake water chemistry in the area (Nedbalová et al. Reference Nedbalová, Nývlt, Kopáček, Šobr and Elster2013; Fig. 8b).
Efflorescent salt crusts and strandlines of higher lake levels were observed along the shores of many closed-basin lakes such as Adriana, Rosario or Erminda. This suggests that the long-term accumulation of salts derived from sea spray, weathering and precipitation, when coupled with desiccation and loss of hydrologic connectivity, might have led to the observed elevated solute levels and mineral supersaturation and precipitation along the lake margins (Hodgson et al. Reference Hodgson, Vyverman and Sabbe2001, Borghini & Bargagli Reference Borghini and Bargagli2004, Lecomte et al. Reference Lecomte, Vignoni, Córdoba, Chaparro, Chaparro and Kopalová2016). Similar explanations of solute concentration have been suggested for other regions, such as the elevated DOC of Picture Pond in the McMurdo Dry Valleys (Sakaeva et al. Reference Sakaeva, Sokol, Kohler, Stanish, Spaulding and Howkins2016). The absence of lakes with such high solute concentrations explains the lower variability in conductivity on the nearby Ulu Peninsula (Nedbalová et al. Reference Nedbalová, Nývlt, Kopáček, Šobr and Elster2013).
Where hydrochemistry is similar between the lakes, but no apparent surficial conduit is observed, subsurface seepage in the active layer might also help to explain apparent linkages in water chemistry. Subsurface flow in the active layer (i.e. on top of the permafrost table) was found to be an important pathway for solutes on Cape Lamb, Vega Island (Silva-Busso et al. Reference Silva-Busso, Moreno, Ermolin, López-Martínez, Durán, Martínez-Navarrete and Cuchí2013), or in Taylor Valley (Lyons et al. Reference Lyons, Welch, Gardner, Jaros, Moorhead, Knoepfle and Doran2012) and elsewhere in Victoria Land (Borghini & Bargagli Reference Borghini and Bargagli2004). The efficiency of subsurface solute transport strongly depends on bedrock permeability (Silva-Busso et al. Reference Silva-Busso, Moreno, Ermolin, López-Martínez, Durán, Martínez-Navarrete and Cuchí2013), active layer depth (Hrbáček et al. Reference Hrbáček, Kňažková, Nývlt, Láska, Mueller and Ondruch2017) and fluctuations in the lake levels (Váczi et al. Reference Váczi, Barták, Nedbalová and Elster2011) to be able to overflow the sills, either topographic or formed by the permafrost table (Lyons et al. Reference Lyons, Welch, Gardner, Jaros, Moorhead, Knoepfle and Doran2012). The two latter factors are then substantially controlled by summer meteorological conditions. Here, we highlight the role of meteorology (Verleyen et al. Reference Verleyen, Hodgson, Vyverman, Roberts, McMinn, Vanhoutte and Sabbe2003, Váczi et al. Reference Váczi, Barták, Nedbalová and Elster2011) that acts as an overarching factor influencing the hydrochemical variability of the lakes through a combination of effects of temperature, precipitation and wind on melt, snow drift and sea spray delivery, thus making CWM lakes sensitive indicators of climate changes (Verleyen et al. Reference Verleyen, Hodgson, Gibson, Imura, Kaup and Kudoh2012).
In addition to their ionic composition, CWM lakes exhibit large variability in nutrient chemistry. Similarly to the Ulu Peninsula, generally lower nitrogen and DOC and higher phosphorus concentrations were found in young lakes (Fig. 8b). We hypothesize that these differences and proportions of individual nutrient forms might be largely influenced by the metabolic activity and decay of the cyanobacterial mats (Laybourn-Parry & Wadham Reference Laybourn-Parry and Wadham2014) that are present in the old lakes situated mainly on the plateau. However, more data are required in order to analyse these differences in detail. Our results further suggest that primary production in CWM lakes with prominent mats is P limited, which can be related to landscape age (Barrett et al. Reference Barrett, Virginia, Lyons, McKnight, Priscu and Doran2007). The higher P concentrations in the Ulu Peninsula lakes reflect a larger proportion of young lakes with sources of P in their catchments (Nedbalová et al. Reference Nedbalová, Nývlt, Kopáček, Šobr and Elster2013). The influence of sea birds and mammals on nutrient import from the marine ecosystems into lakes should be negligible thanks to the inaccessibility of the mesa, and the influence is only marginal near the scarce avian rookeries (Vinocur & Unreien Reference Vinocur and Unrein2000, Toro et al. Reference Toro, Camacho, Rochera, Rico, Bañón and Fernández-Valiente2007).
Ecology and biodiversity of CWM lakes
Due to large gradients in the chemical characteristics of lakes, along with the intersection of the north-east and north-west Antarctic Peninsula bioregions (Terauds & Lee Reference Terauds and Lee2016), CWM potentially represents a biodiversity hotspot. Conductivity in particular has been found to exert a major influence on the structure of lentic diatom communities in the Antarctic (e.g. Kopalová et al. Reference Kopalová, Nedbalová, Nývlt, Elster and Van de Vijver2013). Our preliminary results suggest diverse diatom communities are present in CWM lakes, and are primarily composed of the genera Nitzschia, Pinnularia, Achnanthes, Planothidium and Stauroneis. Several new species of diatoms (Neidium nyvltii, Denticula jamesrossensis, Nitzschia australocommutata and Nitzschia wilmotteana) have already been described from CWM lakes based on samples collected in 2009 (Hamilton et al. Reference Hamilton, De Haan, Kopalová, Zidarova and Van De Vijver2014, Van de Vijver et al. Reference Van de Vijver, Kopalová, Kociolek and Ector2015, Hamsher et al. Reference Hamsher, Kopalová, Kociolek, Zidarova and Van de Vijver2016). The fairy shrimp Branchinecta gaini, the largest Antarctic freshwater invertebrate, is a useful biological proxy in palaeoenvironmental reconstructions, and was originally found only in lake sediment cores from JRI by Björck et al. (Reference Björck, Olsson, Ellis-Evans, Håkansson, Humlum and Lirio1996). Subsequent surveys in recent years have shown that this species is present in the majority of lakes and ponds studied here, as well as in the Ulu Peninsula and Vega Island lakes (Nedbalová et al. Reference Nedbalová, Nývlt, Lirio, Kavan and Elster2017). Finally, the presence of photoautotrophic mats dominated by filamentous cyanobacteria is a conspicuous feature of the older, stable, shallow CWM lakes, and of Antarctic lakes in general (Laybourn-Parry & Wadham Reference Laybourn-Parry and Wadham2014). More detailed investigations into these mats should be conducted in order to evaluate the magnitude of their influence on lake water chemistry and biogeochemical cycling (e.g. the importance of photosynthetic activity and its dependence on weather conditions for pH variations). To conclude, there is great potential for these lacustrine systems to be used as natural laboratories for the study of resident biological communities with regard to their structures, ecological relationships and responses to ongoing climatic changes (Quayle et al. Reference Quayle, Peck, Peat, Ellis-Evans and Harrigan2002, Lee et al. Reference Lee, Raymond, Bracegirdle, Chadès, Fuller, Shaw and Terauds2017).
Conclusions
In this study, multidisciplinary results are provided from a survey conducted over three summers on a previously unexplored region at the intersection of the maritime and continental Antarctic: CWM on JRI. It was found that this region hosts an exceptionally high density of lakes, which also boast a great diversity of chemical characteristics. The basins and catchments of CWM waterbodies are directly linked to the formation of the mesa and its landscape evolution. The mesa formed in an Early Pleistocene glaciovolcanic eruption and the lake basins occupy depressions resulting from the inflation of lava flows. Conservation of the primary relief suggests that CWM has not been extensively overridden by warm-based erosive ice, although the abundance of granite erratic boulders indicates that they were carried here by the Antarctic Peninsula Ice Sheet. The geomorphological relationships between sediment–landform assemblages point to the relatively recent (post-Neoglacial) formation of young, unstable lakes in the peripheral area of the CWM foreland following the retreat of the Haddington Ice Cap. These young lakes, including moraine-dammed lakes, terminoglacial lakes and kettle lakes, greatly differ in their chemical composition from older, stable, shallow lakes. However, considerable hydrochemical heterogeneity exists among older, stable, shallow lakes – the prevailing lake type on the mesa – and this cannot be explained by differences in underlying lithology, timing of the lake formation following the deglaciation, nor hydrological connectivity within the individual catchments. The chemical composition of the lake water in CWM lakes is primarily influenced by marine aerosols, followed by weathering of the bedrock and precipitation. Much of the variability in the ionic concentration seems to stem from different exposure to the prevailing south-westerly winds, which transport sea spray to relatively high altitudes (~250 m a.s.l.), as well as contributing to the evaporation and concentrating of lake solutes, a process that is especially important in closed-basin lakes. Subtle differences in lake catchment geomorphology furthermore imply a varied distribution of snow banks that provide lakes with meltwater. Small-scale changes in snow accumulation between years, induced by aeolian redistribution of snow and due to the varying mean direction and strength of the major windstorms, may then lead to the observed inter-annual differences in ionic concentration. The diversity of the physical and chemical conditions of CWM lakes therefore offers an opportunity to study lentic freshwater ecosystems in the rapidly changing environment of the Antarctic Peninsula.
Acknowledgements
The authors would like to acknowledge the logistical support of the Dirección Nacional del Antártico, Instituto Antártico Argentino and Marambio and J.G. Mendel stations. This contribution was supported by the Czech Science Foundation project no. 16-17346Y, the Agencia Nacional de Promoción Científica y Tecnológica project PICTO-2010-0096, Grant Agency of Masaryk University project MUNI/A/1251/2017 and the Ministry of Education, Youth and Sports of the Czech Republic projects no. LM2015078 and CZ.02.1.01/0.0/0.0/16_013/0001708. The first author's participation on the field campaign was made possible by the generous travel scholarships of the ‘Nadace Nadání Josefa, Marie a Zdeňky Hlávkových’ Foundation, Charles University Mobility Fund and Charles University Grant Agency (GAUK) grant no. 126715. TJK and KK were further supported by Charles University Research Centre program no. 204069. We thank Brad Harried for providing a pre-official release version of REMA for the studied area (DEMs provided by the Byrd Polar and Climate Research Center and the Polar Geospatial Center under NSF-OPP awards 1543501, 1810976, 1542736, 1559691, 1043681, 1541332, 0753663, 1548562, 1238993 and NASA award NNX10AN61G; computer time provided through a Blue Waters Innovation Initiative; DEMs produced using data from DigitalGlobe, Inc.). We would like to thank Marcos Kitaura, Eduardo Ale Monserrat, Emmanuel C. Portalez Carnovai and Agustín Cúparo for their great help in the field, Natacha Lopéz for help with mapping, Jan Kavan for Minikin temperature logger data and Neil F. Glasser and two anonymous reviewers for constructive comments on the manuscript.
Author contributions
MR, LN, TJK, JML, SHC, PAV and JE performed the fieldwork. MR, JML and DN conducted mapping and created the GIS database and maps. LN, JK, PAV and KLL carried out hydrochemical analyses. LN, TJK and JK performed statistical analyses and interpreted limnological data. JML and DN led the study at the Argentinian and Czech sides, respectively. MR, LN, TJK and KK co-wrote the manuscript with significant input and editing from all authors.
Supplemental material
One supplemental table and three figures will be found at https://doi.org/10.1017/S0954102019000178