


Introduction
Animal body size can be related to latitude, with larger bodies present at higher latitudes (McNab Reference McNab1971, Partridge & Coyne Reference Partridge and Coyne1997). This is a result of natural selection acting over the individual’s ability to cope with lower temperatures, i.e. larger and heavier individuals are positively selected at higher latitudes (Meiri & Dayan Reference Meiri and Dayan2003, Olson et al. Reference Olson, Davies, Orme, Thomas, Meiri, Blackburn, Gaston, Owens and Bennett2009). The general explanation for the phenomenon is attributed to the importance of the surface area to volume ratio, with warm-blooded animals in colder climates having an advantage in the reduction of this ratio, reducing heat loss (Searcy Reference Searcy1980, Salewski & Watt Reference Salewski and Watt2017). This has been found to be true for birds at the species and population levels (Olson et al. Reference Olson, Davies, Orme, Thomas, Meiri, Blackburn, Gaston, Owens and Bennett2009), meaning that species of the same group, or populations of the same species with a broader range differ in body size and mass following a latitudinal and temperature gradient. However, links between sea surface temperature and the higher trophic levels may be difficult to ascertain, given the uncertainties of prey choice and the wide range of niches explored by predators (Grémillet et al. Reference Grémillet, Lewis, Drapeau, van Der Lingen, Huggett, Coetzee, Verheye, Daunt, Wanless and Ryan2008, Hill et al. Reference Hill, Keeble, Atkinson and Murphy2012). Other factors may therefore be responsible for such size-based spatial organization, such as food availability or productivity gradients (Geist Reference Geist1987, Nunes et al. Reference Nunes, Mancini and Bugoni2017, Salewski & Watt Reference Salewski and Watt2017), which can be organized longitudinally as well (Salomon & Voisin Reference Salomon and Voisin2010, Wojczulanis-Jakubas et al. Reference Wojczulanis-Jakubas, Jakubas, Welcker, Harding, Karnovsky, Kidawa, Steen, Stempniewicz and Camphuysen2011).
At the individual level, body size can influence intra-sexual competition (Barbraud Reference Barbraud2000, Hahn & Peter Reference Hahn and Peter2003) and spatial distribution (Cronin et al. Reference Cronin, Pomeroy and Jessopp2012). These can be linked to the dominance of larger individuals in aggressive interactions (Cain & Ketterson Reference Cain and Ketterson2013), phenotypical variability in physiological constraints related to environmental and climate conditions (Porter & Kearney Reference Porter and Kearney2009, Ohlberger Reference Ohlberger2013), and the flow of energy through trophic webs associated with the mass of food items that individuals of different sizes can handle (Layman et al. Reference Layman, Winemiller, Arrington and Jepsen2005). Body size can therefore influence individual resource and habitat use by competition mechanisms, whereby larger individuals have a fitness advantage over smaller ones by exploiting better quality food sources (Bolnick Reference Bolnick2004).
Sexual size dimorphism (SSD) is an important factor explaining ecological and behavioural differences between sexes for several seabird species (Shaffer et al. Reference Shaffer, Weimerskirch and Costa2001, Serrano-Meneses & Székely Reference Serrano-Meneses and Székely2006). Such differences may lead to differential habitat use between sexes. For instance, in several seabird species the smaller sex usually has a more pelagic behaviour and travels further than the larger sex, usually to lower and warmer latitudes than the larger sex (Phillips et al. Reference Phillips, Silk, Phalan, Catry and Croxall2004a, González-Solís et al. Reference González-Solís, Croxall and Afanasyev2008).
In the Southern Ocean, the southern giant petrel Macronectes giganteus (Gmelin) is the seabird species with the highest SSD, with practically no size-overlap between the sexes, which is a consequence of their different roles in reproduction and different foraging strategies (Hunter Reference Hunter1984, González-Solís et al. Reference González-Solís, Croxall and Wood2000a). Given its characteristics, this species is a good model for understanding the effects of both sex and body size on seabird distribution. It was hypothesized that size influences how individuals are able to deal with environmental conditions, reflecting on individual differences in spatial distribution at both sex and intra-sex levels. Sex-level spatial segregation for the studied population was already known, with females using slightly lower latitudes than males (Krüger et al. Reference Krüger, Paiva, Petry and Ramos2017), but the role of body size influencing habitat use and spatial distribution at the intra-sex level was unknown. It was expected that body size would influence distribution, resulting in smaller individuals within a population moving towards lower latitudes than larger individuals during the non-breeding period.
Materials and methods
Tagging procedure
Fifty southern giant petrels were tagged with British Antarctic Survey MK19 geolocators (16×14×6 mm, 2.5 g, 10 min. light resolution) at Stinker Point, Elephant Island, South Shetland Islands (61.17°S 55.35°W) during the incubation periods (January) of 2011 (n=20) and 2014 (n=30). All individuals selected were confirmed breeders. Twelve devices were recovered in December 2011 (5 females and 7 males), and 19 in December 2014 (11 females and 8 males). Some individuals appeared to be stressed when handled, and therefore, to avoid possible breeding desertion by those individuals, no body measurements were taken (see below). Thus, only 23 of the 31 individuals recovered were measured.
Each of the tagging devices had a maximum total weight of 6.0 g, with the rings (2.2 g), the 3 M Super Weatherstrip Adhesive (to glue the tag to the ring) and the plastic belts. The mean body mass of the tagged individuals was 4275 g (3000–5400 g), so the total weight of the equipment was<1% of the weight of each individual (Phillips et al. Reference Phillips, Xavier and Croxall2003), even for the smaller individuals. Culmen length was measured (using callipers) for sex determination, as male culmens are>96 mm in length (Hunter Reference Hunter1984). The assigned sex was confirmed by observation of the pair at the nest. The mass of each individual was recorded to the nearest 100 g, and total length and wing length were measured (with millimetre aluminium rulers). A proxy for wing load was calculated by dividing the wing length by the body mass.
Spatial data processing
Geographical data were processed using the BASTrack package. Daily light curves were cleaned according to interruptions in the sunrise/sunset sequence. Data points were excluded when the estimated velocity over the ground to that point from the previous location exceeded 60 km h−1 (22.5% of 8418 points). Data from the 15 days before and after the equinoxes were also excluded (corresponding to 8.2% of 183 tracked days for each individual). Smoothing was applied over the tracking data to reduce geolocation position error, as suggested by Phillips et al. (Reference Phillips, Silk, Croxall, Afanasyev and Briggs2004b).
Individual foraging areas (IFA; 25% and 50% kernel usage density) and home ranges (HR; 75% and 90% kernel usage density) during the non-breeding period were calculated using the KernelUD function of the ‘adehabitat’ package in R (Calenge Reference Calenge2006). A smoothing bandwidth (h) equal to one degree was applied, according to the average error of global location sensor positions (Phillips et al. Reference Phillips, Silk, Croxall, Afanasyev and Briggs2004b). The egg laying period for this population was estimated to be from mid-November to mid-December. Usually, birds arrive at the colony and start nest selection c. one month before egg-laying (http://www.acap.aq/en/acap-species/288-southern-giant-petrel/file, accessed 12 May 2016). Therefore, October was assumed to be the start of the breeding season. No data were available regarding the period when adults stop provisioning their chicks in the Stinker Point population, but observations suggest that most fledglings start moulting to adult plumage by March.
Environmental variables
Environmental variables relevant for seabird species were used, as they are the usual proxies for suitable habitat considered in spatial studies of seabirds, and can represent a proxy for presence of food (Wakefield et al. Reference Wakefield, Phillips and Matthiopoulos2009, Santora Reference Santora2014): chlorophyll a concentration (CHL), sea surface temperature (SST), sea surface temperature gradients (SSTg; a proxy for oceanic fronts), sea ice cover (SIC), surface wind speed (WS), sea bed depth (SBD), and depth of the mixed layer (MLD). Dynamic variables (CHL, SST, SIC, WS, MLD) for April–September (non-breeding period of southern giant petrels) 2011 and 2014 were downloaded from the Giovanni browser (giovanni.sci.gsfc.nasa.gov). The spatio-temporal links between environmental factors, seabird distribution and habitat use are not straightforward (Grémillet et al. Reference Grémillet, Lewis, Drapeau, van Der Lingen, Huggett, Coetzee, Verheye, Daunt, Wanless and Ryan2008, Hill et al. Reference Hill, Keeble, Atkinson and Murphy2012); therefore, the diffuse nature of the links explored in this study must be acknowledged, i.e. the lack of direct links between environmental factors, body size and distribution. The variability of those variables between the years was minimal, as verified using Spearman rank correlation (CHL R=0.915, SST R=0.995, SIC R=0.965, WS R=0.945, MLD R=0.923), thus the mean values of both years were used in the analysis. Sea surface temperature gradients were calculated as the standard deviation of SST in a 3° x 3° moving filter, and used as an indication of front presence. Sea bed depth was downloaded from the ETOPO1 global relief model. Mean values of each environmental variable within the IFA of each individual were extracted using the ‘extract’ function of the ‘raster’ package in R (Hijmans Reference Hijmans2013). All variables were resampled to a 0.2° x 0.2° spatial grid (Fig. 1a–g).
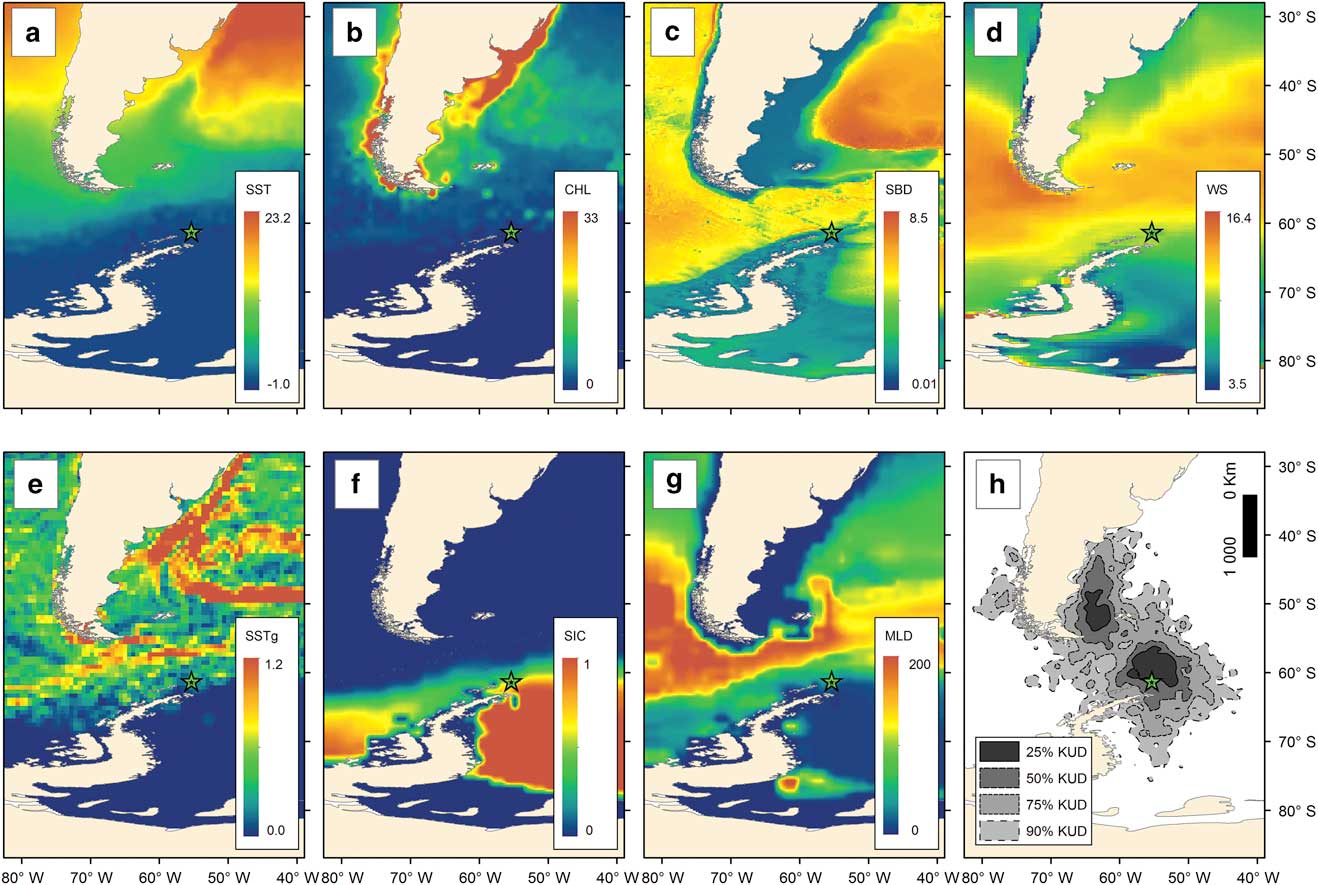
Fig. 1 Environmental variables used in this study. a. Sea surface temperature, SST (°C). b. Chlorophyll a concentration, CHL (mg m−3). c. Sea bed depth, SBD (km). d. Surface wind speed, WS (m s−1). e. Sea surface temperature gradient, SSTg (°C). f. Sea ice cover, SIC (proportion). g. Mixed layer depth, MLD (m). Non-breeding distribution (h) of all the tracked southern giant petrels breeding at Stinker Point, Elephant Island (star) measured as kernel usage density (KUD); for sex-level KUD see Krüger et al. (Reference Krüger, Paiva, Petry and Ramos2017).
Statistical analysis
All environmental variables and body measures were rescaled to the maximum value to standardize them within the range 0–1. Body measures were standardized according to sex, as there was no overlap between females and males for several body measures. An arcsine transformation was applied to normalize all the individual environmental variables within IFA and body measures.
A canonical correspondence analysis (CCA) was applied using the ‘vegan’ package in R (Oksanen et al. Reference Oksanen, Blanchet, Kindt, Legendre, Minchin, O’Hara, Simpson, Solymos, Stevens and Wagner2013) to test whether the environmental variables within IFAs are related to individuals’ body measures. Canonical correspondence analysis is immune to distortions caused by multicollinearity and nonorthogonality (Palmer Reference Palmer1993) and is therefore a robust multivariate analysis. Sex was used to constrain the analysis (Environment ~ Body Measures * Sex). The significance of the relation was tested through an analysis of variance using a permutation procedure (999 permutations) and P was calculated as the number of times simulated F was higher than the observed F, with P<0.05.
The scores of CCA axis 1 (CCA1) were extracted and used to test whether an individual’s variability in habitat use explained by body size also influences the latitudinal distribution of its IFA. As the centred latitude of the IFA had a normal distribution and homogeneous variances between sexes (see results), a simple linear regression was used to test the association between latitude of the IFA and the CCA1.
Results
Population distribution
Overall, southern giant petrels used waters off the tip of the Antarctic Peninsula to north of Argentina, concentrating their foraging areas north of Elephant Island and in waters off the Falkland Islands and Patagonia, and to a lesser extent, the Pacific coast of Chile (Figs 1h & 2).
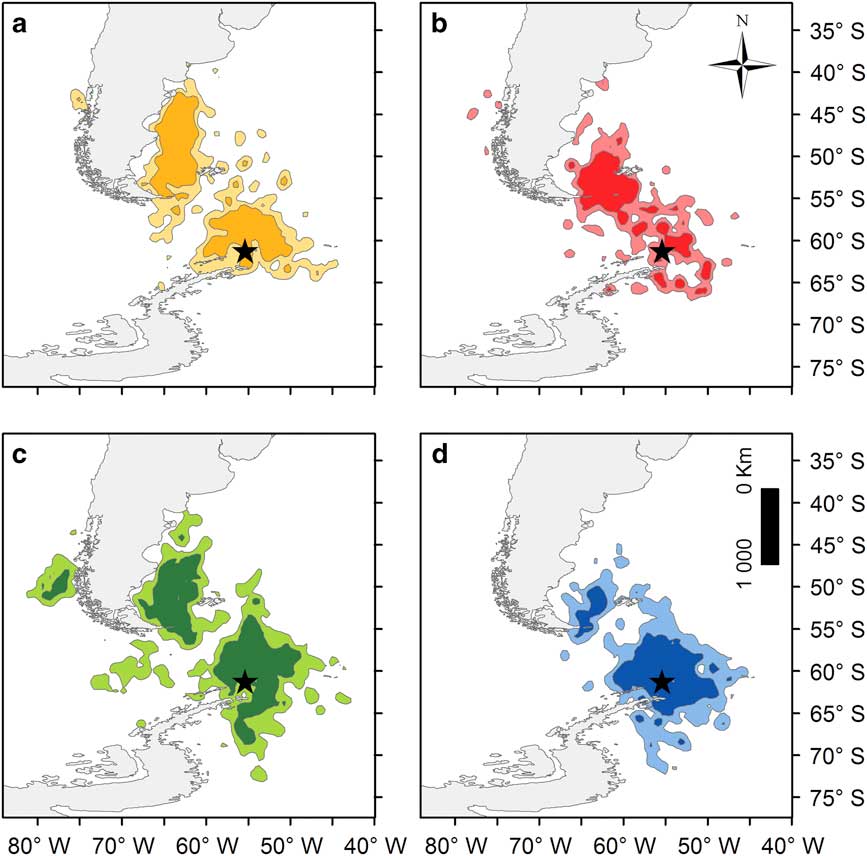
Fig. 2 Southern giant petrel kernel usage density (KUD) for a. small females, b. large females, c. small males and d. large males. Dark colours represent 50% KUD and light colours represent 95% KUD. The location of Elephant Island, where the birds were tagged, is indicated by a star. Birds were categorized according to whether their position on axis 1 of the canonical correspondence analysis (see methods and results) was below (small) or above (large) the mean value for each sex independently.
Body size and habitat use
The environmental variables within an IFA were related to body measures constrained by sex (F 9,13=2.73, P=0.025). The first and second CCA axes together explained 57.36% of data variability. The first axis (CCA1) clearly captured the sexual differences regarding habitat use, and determined which body sizes are related to a given set of environmental variables (Fig. 3). Positive values of the CCA1 captured IFA within colder habitats more associated with sea ice, whereas negative values captured IFA within warmer and more productive waters (Fig. 3). Furthermore, CCA1 was positively associated with body size: smaller males and females used warmer waters and larger males used colder waters (Fig. 3).

Fig. 3 Biplot for the canonical correspondence analysis (CCA) testing the influence of body size (body mass, culmen length, total body length, wing length and wing load, in bold) over the environmental variables sea surface temperature (SST), chlorophyll a concentration (CHL), sea surface temperature gradient (SSTg), surface wind speed (WS), mixed layer depth (MLD), sea bed depth (SBD) and sea ice cover (SIC) used by southern giant petrels during their non-breeding period. Variance was constrained by sex (F: female, M: male). Each point corresponds to an individual bird, and labels represent the rescaled correlation of variables with CCA axes.
The centre latitude of each IFA (Fig. 4a) presented normal distribution (Shapiro–Wilk’s W=0.964, P=0.540), with homogeneity of variance between the sexes (Bartlett’s K 2 =1.32, P=0.250). The latitudinal segregation was significantly related to CCA1 (F 1,21=20.87, P=0.0002): birds positioned in the higher values of CCA1 (larger males off colder waters) had more southerly IFAs than those positioned in the lower values of CCA1 (smaller males and females off warmer waters, Fig. 4b).

Fig. 4 a. Normality tests and homogeneity of variance tests between sexes and b. the latitudinal distribution of southern giant petrel foraging areas (50% kernel usage density) in relation to environmental and body size gradients calculated through a canonical correspondence analysis (CCA).
Discussion
The findings indicate that body size at the individual level is associated with the overall habitat use of southern giant petrels during the non-breeding period, and the variability in size seems to influence how individual birds respond to environmental variability. Larger males used higher latitude areas overlapping more of their distribution with the sea ice, whereas smaller males and females tended to be distributed over lower latitudes, using warmer zones off coastal waters.
The level of sexual segregation observed is in line with findings of other studies of size-dimorphic large seabird species from the Southern Ocean: females tend to forage in slightly warmer pelagic waters at lower latitudes and over broader ranges compared with males (Phillips et al. Reference Phillips, Silk, Phalan, Catry and Croxall2004a, González-Solís et al. Reference González-Solís, Croxall and Afanasyev2008, Thiers et al. Reference Thiers, Delord, Barbraud, Phillips, Pinaud and Weimerskirch2014). These differences are explained by physiological and morphological differences between the sexes, as males (larger and heavier than females) are better at dealing with lower temperatures than females, and smaller wing loading (less mass per wing area) allows females to travel longer distances than males (Shaffer et al. Reference Shaffer, Weimerskirch and Costa2001, González-Solís Reference González-Solís2004, Phillips et al. Reference Phillips, Silk, Phalan, Catry and Croxall2004a). Such differences could also be a by-product of competition displacing females from areas heavily used by larger males (González-Solís et al. Reference González-Solís, Croxall and Wood2000a, Reference González-Solís, Croxall and Wood2000b, Grémillet et al. Reference Grémillet, Dell’Omo, Ryan, Peters, Ropert-Coudert and Weeks2004). However, such variability can also be found at the intra-sex level.
Furthermore, the role of body size in the ecology of giant petrels (González-Solís et al. Reference González-Solís, Croxall and Wood2000a, Reference González-Solís, Croxall and Wood2000b, Thiers et al. Reference Thiers, Delord, Barbraud, Phillips, Pinaud and Weimerskirch2014) probably has more impact on individual differences than for other seabird species. Small males had more similar distribution to the females, using lower latitudes and warmer waters. Larger males may be less affected by cold, thus remaining at higher latitudes during winter. Such explanations are supported both at the individual and sexual levels. The possibility that such size-based spatial segregation and habitat use could have impacts on demography may have even more relevance under current scenarios of environmental stochasticity, which may be favouring individuals with smaller body size (Gardner et al. Reference Gardner, Peters, Kearney, Joseph and Heinsohn2011). Two mechanisms explaining the favouring of smaller body sizes under warming global temperatures have been proposed (Gardner et al. Reference Gardner, Peters, Kearney, Joseph and Heinsohn2011): given lower metabolic rates and heat exchange, larger body sizes are favoured under cooler conditions, and therefore a warmer planet would mean smaller animals; on the other hand, changes in nutrition (decreasing food sources) as a consequence of rapid environmental changes could favour animals with less energetic requirements, i.e. smaller animals.
In contrast to differences at the individual level, there is no evidence for strong inter-population organization of colonies following a body size and latitude gradient (Salomon & Voisin Reference Salomon and Voisin2010). Several studies advocate that population level organization by body size and mass may be a by-product of adaptation to local ecological factors (i.e. food availability) rather than to temperature alone (Cardini et al. Reference Cardini, Jansson and Elton2007, Mullen & Hoekstra Reference Mullen and Hoekstra2008, Nunes et al. Reference Nunes, Mancini and Bugoni2017). The distribution of southern giant petrel breeding colonies seems to be spatially organized according to longitudinal gradients in resources (Salomon & Voisin Reference Salomon and Voisin2010). Considering the support for latitudinal/thermal organization of individuals’ distribution during the non-breeding season, it makes sense to assume that factors other than temperature are more important in explaining body size/mass and distribution of colonies. It can be hypothesized that once individuals are released from ‘breeding duties’, and therefore are less anchored to the breeding grounds, they can move freely and match their distribution with preferred environmental conditions. Considering the low temperatures near the Antarctic Peninsula during winter, it is probable that a portion of the population moves towards lower latitudes during the non-breeding season (as suggested by Forero et al. Reference Forero, González-Solís, Hobson, Donázar, Bertellotti, Blanco and Bortolotti2005, Rey et al. Reference Rey, Polito, Archuby and Coria2012) and it is possible that body size may influence the degree of distributional shift of individuals.
Conclusion
A size-mediated latitudinal segregation was identified at both sex and individual levels. Smaller individuals spent their non-breeding season at lower latitudes and in warmer conditions, whereas larger individuals spent their non-breeding period at higher latitudes near the edge of the sea ice in the Antarctic Peninsula. Taking into account the importance of body size for the ecology and behaviour of giant petrels, further studies should aim to understand how individual variability in body size affects the overall ecology of populations, such as demographic rates and population dynamics.
Acknowledgements
LK acknowledges CNPq for his PhD scholarship (245540/2012-1). VHP and JCX acknowledge Fundação para a Ciência e Tecnologia (SFRH/BPD/85024/2012, IF/00616/2013). The authors acknowledge the Brazilian Navy for field research support in Antarctica, INCT-APA, CNPq (574018/2008-5) and FAPERJ (E-16/170.023/2008). The authors also acknowledge the support of the Brazilian Ministries MCTI, MMA and CIRM. This study benefited from the strategic programme of MARE, financed by FCT (MARE - UID/MAR/04292/2013). We thank colleagues from LOAM for helping with field sampling, and Andrew Clarke and two anonymous reviewers for the useful suggestions and comments. This study was conducted at a time of great political and economic difficulty in Brazil. Besides substantial cuts in research budgets, we also would like to express our dissatisfaction with the government’s use of environmental agencies as a political bargaining instrument. The authors declare that there are no conflicts of interest arising from this study.
Author contributions
LK designed the study with support from JAR, VHP, JCX, MVP and EP. LK, EP and JVGF collected the data. LK conducted the analysis with support from JAR, VHP and JCX. LK led the writing, with input from all the authors.


