


Introduction
Bothrometopus huntleyi (Grobler et al. Reference Grobler, Bastos, Treasure and Chown2011) (Curculionidae: Coleoptera: Hexapoda) belongs to the Ectemnorhinus group of genera (Kuschel & Chown Reference Kuschel and Chown1995), also known as the tribe Ectemnorhinini (Alonso-Zarazaga & Lyal Reference Alonso-Zarazaga and Lyal1999), which is restricted to islands of the sub-Antarctic South Indian Ocean Province (SIP). This group of weevils comprises eight genera and 37 flightless species (Kuschel & Chown Reference Kuschel and Chown1995, Grobler et al. Reference Grobler, van Rensburg, Bastos, Chimimba and Chown2006, Reference Grobler, Bastos, Treasure and Chown2011), of which seven occur on the Prince Edward Islands. Of these seven species, five, including B. huntleyi, are endemic to the archipelago, with Bothrometopus randi (Jeannel Reference Jeannel1953) also being found on the Iles Crozet to the east, and Palirhoeus eatoni (C.O. Waterhouse Reference Waterhouse1876) occurring on all SIP islands (Kuschel & Chown Reference Kuschel and Chown1995). Recent molecular studies both of this group of weevils (Grobler et al. Reference Grobler, van Rensburg, Bastos, Chimimba and Chown2006) and of other taxa in the region (e.g. Stevens et al. Reference Stevens, Greenslade, Hogg and Sunnucks2006, Myburgh et al. Reference Myburgh, Chown, Daniels and van Vuuren2007) have suggested that relationships among species, within and among islands and archipelagos (including the Prince Edward Island archipelago) may be much more complex than suggested by morphological analyses. In consequence, it may be argued that the status of B. huntleyi on the Prince Edward Island archipelago has not been fully resolved, and that it might be expected to show substantial phylogeographic structure associated with the different histories of the two islands which lie only 19 km apart. Perhaps most significantly, Marion Island, the larger of the two Prince Edward Islands, was extensively glaciated whilst the smaller Prince Edward Island shows no evidence of glaciation (Boelhouwers et al. Reference Boelhouwers, Meiklejohn, Holness and Hedding2008). McDougall et al. (Reference McDougall, Verwoerd and Chevallier2001) suggested that Marion Island had five distinct cold periods and eight volcanic ages, with two of these accompanying major glaciations (Fig. 1). Although the exact sequence and spatial extent of volcanic and glacial events is currently the subject of revision, this overall scenario appears to be robust (Boelhouwers et al. Reference Boelhouwers, Meiklejohn, Holness and Hedding2008).
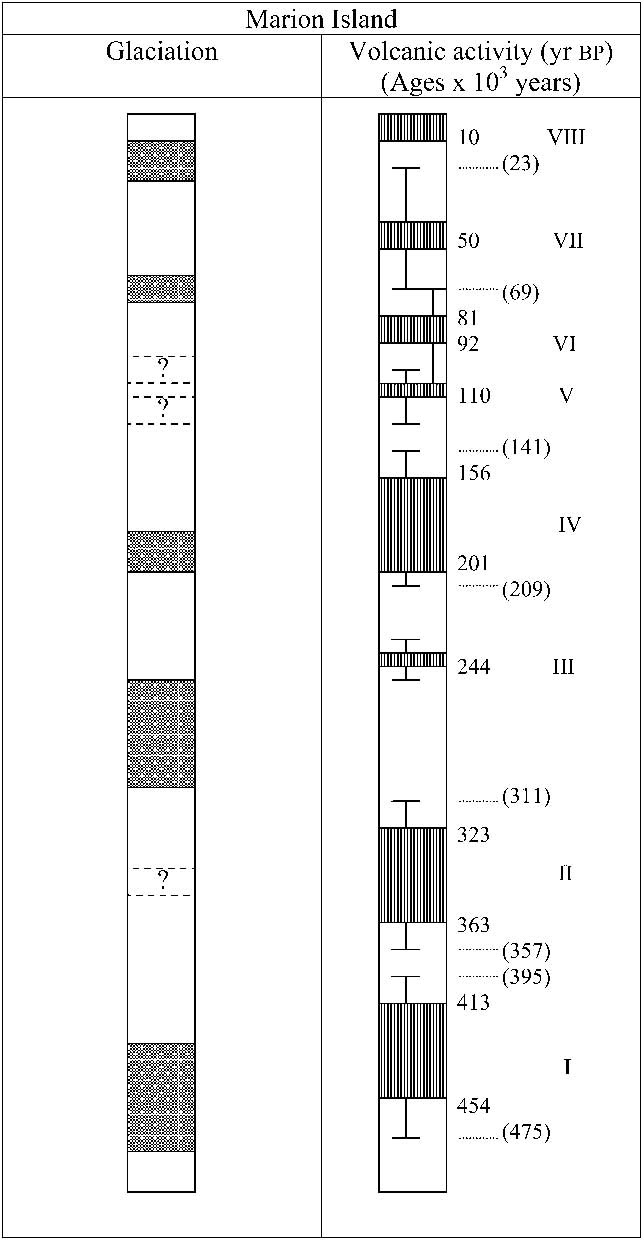
Fig. 1 Correlation of volcanic activity and glaciation on Marion Island. The shaded bars represent periods of glaciation or volcanic activity with the older events at the bottom of the figure and the most recent events at the top. This diagram is presented with the permission of the Geological Magazine and Professor McDougall (McDougall et al. 2001).
In consequence, substantial differences among populations of B. huntleyi on the two islands might be expected. Such differences would not only be of biogeographic significance (see e.g. Chown Reference Chown1992), but would also have substantial conservation implications given the differences in invasive alien species on the islands, especially the absence of house mice on Prince Edward Island, which have a dietary preference for weevils on Marion Island (Chown & Smith Reference Chown and Smith1993). Here we set out to examine the evolutionary dynamics shaping the population structure of B. huntleyi, which occurs on both islands, is widely distributed across Marion Island, and has until recently been confounded with B. parvulus (Grobler et al. Reference Grobler, Bastos, Treasure and Chown2011).
Materials and methods
Systematics and biology
Although the genus Bothrometopus has previously been separated into two distinct groups, the fasciatus- and gracilipes-groups, which are distinguished by, respectively, the absence and presence of vaginal spicules (see Dreux & Voisin Reference Dreux and Voisin1984, Reference Dreux and Voisin1986, Kuschel & Chown Reference Kuschel and Chown1995 for earlier work on the genus and its now synonymous allies), Grobler et al. (Reference Grobler, Bastos, Treasure and Chown2011) have called for the re-evaluation of these groups.
Because B. huntleyi was previously not distinguished from the very similar B. parvulus, and because it is now clear that B. parvulus is restricted to coastal areas of both islands (Grobler et al. Reference Grobler, Bastos, Treasure and Chown2011), it can be reasonably assumed, from the previous literature on habitat use in the group (e.g. Chown Reference Chown1989), that B. huntleyi predominantly occurs in epilithic moss cushions from coastal rock faces to high-altitude fellfield and polar desert. The larvae and adults feed on algae, lichens, and bryophytes (Chown Reference Chown1989, Reference Chown1992). Individuals may occur occasionally on Azorella selago, but feed on epiphytic algae and bryophytes, rather than on the plant itself (Chown Reference Chown1989, Reference Chown1992). On both Marion Island and Prince Edward Island, B. huntleyi shows distinct variation in size, associated both with elevation and habitat type, although differences among the two islands are not pronounced (Chown Reference Chown1992, Chown & Smith Reference Chown and Smith1993, Chown & Klok Reference Chown and Klok2003).
Study sites and sampling
Specimens of B. huntleyi were collected during three consecutive years (April 2001–April 2003) from 14 localities from the eastern side of Marion Island (Fig. 2). Due to restricted access to Prince Edward Island, weevils were only sampled from five localities on one occasion in April 2003 (Fig. 2). For each island, the specimens were collected from a range of altitudes, and individuals selected for genetic characterization were chosen to ensure the broadest possible size and colour variation representation, for each sampling locality. The geographic coordinates, altitude and weevil size range recorded for each sampling locality are summarized in Table I. All specimens were collected by hand and preserved in absolute ethanol. Bothrometopus brevis (C.O. Waterhouse) from Heard Island was selected as an outgroup, since it is the closest known sister taxon of B. huntleyi (Grobler et al. Reference Grobler, Bastos, Treasure and Chown2011, Table I).
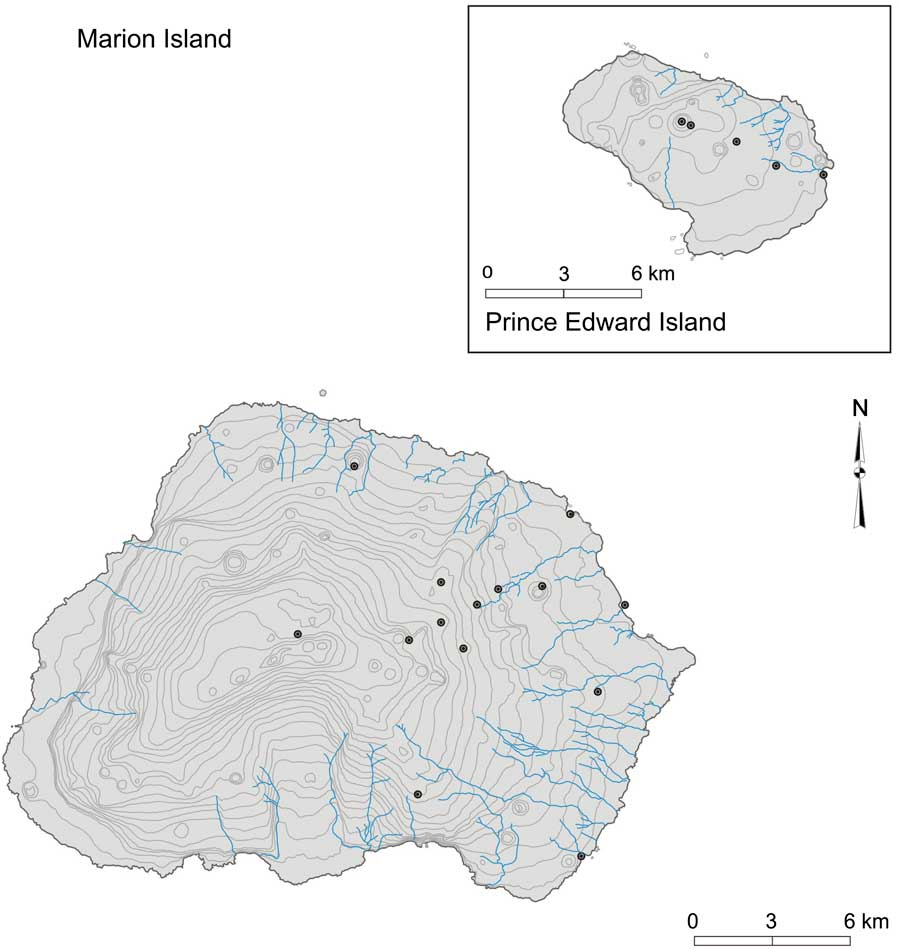
Fig. 2 Map indicating flightless weevil (Bothrometopus huntleyi) sampling localities on the Prince Edward Island archipelago and that correspond to the geographic coordinates summarized in Table I.
Table I Summary of the 19 sampling localities on Marion Island (MI) and Prince Edward Island (PEI) from which the genetically characterized Bothrometopus huntleyi specimens included in this study were collected.

a.s.l. = above sea level, TvZB = samples collected at the top of Van Zinderen Bakker.
Genetic characterization
DNA from each individual was extracted from a single leg which, following removal from ethanol was washed and rehydrated in distilled water for 10 minutes, prior to being frozen in liquid nitrogen and ground using an Eppendorf micro pestle (Merck, South Africa). DNA was extracted using the High Pure PCR Template Preparation Kit (Roche Applied Science) using the supplier's procedure for the isolation of nucleic acids from mammalian tissue with modification to the proteinase K tissue lysis incubation step, which was performed for 48 hr instead of the recommended 1 hr for mammalian tissue.
COI primers, GF-1858 and GR1-2938 which are specific for weevils from Marion Island (Grobler et al. Reference Grobler, van Rensburg, Bastos, Chimimba and Chown2006) were used to amplify a 1059 bp PCR product under previously described reaction conditions (Grobler et al. Reference Grobler, van Rensburg, Bastos, Chimimba and Chown2006) using a thermal cycling profile that consisted of an initial denaturation step at 94°C for 90 s, followed by 40 cycles of 94°C for 22 s, 46°C for 30 s and 72°C for 1 min and concluding with a final extension step of 1 min at 72°C. PCR products of the correct size were purified directly from the tube using a Roche High Pure PCR Product Purification Kit (Roche Applied Science). Automated cycle sequencing with the ABI PRISM Big Dye™ Terminator version 3.0 (Applied Biosystems) and two internal primers, GF5-1940 and GR5-2935 (Grobler et al. Reference Grobler, van Rensburg, Bastos, Chimimba and Chown2006), in separate reactions, was performed at an annealing temperature of 46°C. Sequences were viewed, edited and aligned in MEGA4 (Tamura et al. Reference Tamura, Dudley, Nei and Kumar2007), resulting in a homologous dataset 885 bp in length.
Phylogenetic analyses
Neighbor-Joining (NJ) and Minimum Evolution (ME) algorithms were used to construct distance trees in MEGA4 (Tamura et al. Reference Tamura, Dudley, Nei and Kumar2007) and maximum likelihood analyses were performed in PhyML (Guindon & Gascuel Reference Guindon and Gascuel2003) using the model of sequence evolution identified as the best-fit model under the Akaike Information Criterion (AIC) in ModelTest version 3.06 (Posada & Crandall Reference Posada and Crandall1998). Nodal support was assessed by 100 000 and 5000 bootstrap replications, respectively. Maximum parsimony (MP) analyses were performed in PAUP* v4.0b10 (Swofford Reference Swofford2003). Characters had equal weights in the initial analysis and were subsequently reweighted using the rescaled consistency index (RCI). Starting trees were obtained by random stepwise addition of sequences and branch swapping was performed using the tree-bisection-reconnection (TBR) algorithm. Bayesian Inference (BI) using MrBayes version 3.1 (Huelsenbeck & Ronquist Reference Huelsenbeck and Ronquist2001) was performed using priors guided by the best-fit model and parameters in ModelTest (Posada & Crandall Reference Posada and Crandall1998), namely the HKY85 model (Hasegawa et al. Reference Hasegawa, Kishino and Yano1985) with the proportion of invariable sites (I) and gamma distribution shape parameter (Γ) being 0.791 and 1.6671, respectively. The analysis was initiated with random starting trees and run for 10 000 000 generations with Markov chains sampled every 2000 generations. Of the 5000 trees obtained, 1250 were discarded as “burn-in”. Tracer plots were visually inspected and tracer diagnostics (standard deviation of split frequencies, effective sample size), as implemented in MrBayes and Tracer v1.4 (Drummond & Rambaut Reference Drummond and Rambaut2007) were inspected to ensure that stationarity had been reached.
The equality of evolutionary rates between lineages was evaluated using the relative rate test (Li & Bousquet Reference Li and Bousquet1992) in PHYLTEST version 2.0 (Kumar Reference Kumar1996). The likelihood ratio test (Felsenstein Reference Felsenstein1981, Reference Felsenstein1988) was also performed by calculating and comparing the log likelihood scores with and without the molecular clock enforced. Divergence times were estimated using the 2.3% nucleotide sequence divergence per million years, estimated from an arthropod mtDNA survey (Brower Reference Brower1994) and the appropriate parameter-rich model of evolution (Papadopoulou et al. Reference Papadopoulou, Anastasiou and Vogler2010) selected under the AIC in ModelTest (Posada & Crandall Reference Posada and Crandall1998). BEAST 1.5.3 (Drummond & Rambaut Reference Drummond and Rambaut2007) was used to obtain an ultrametric tree using Bayesian MCMC analysis orientated towards rooted, time-measured phylogenetics. Well supported nodes identified following NJ, ML and BI analyses were constrained to be monophyletic and the HKY+I+Γ model was enforced using a strict molecular clock model. The results of two independent runs were merged and analysed with Tracer v1.4 and TreeAnnotator v1.4.7 (Drummond & Rambaut Reference Drummond and Rambaut2007).
The program TCS version 1.21 (Clement et al. Reference Clement, Posada and Crandall2000) was used to generate a haplotype cladogram displaying the number of base pair differences between haplotypes. TCS version 1.21 (Clement et al. Reference Clement, Posada and Crandall2000) incorporates the cladogram estimation algorithm described by Templeton et al. (Reference Templeton, Crandall and Sing1992) and provides 95% parsimoniously plausible branch connections between the different haplotypes.
Mismatch analyses, population expansion and diversity estimates
Pairwise mismatch distributions, where the observed pairwise mismatch distributions were fitted to a stepwise expansion model by a generalized least square procedure following Schneider & Excoffier (Reference Schneider and Excoffier1999), as implemented in Arlequin version 2.0 (Schneider et al. Reference Schneider, Roessli and Excoffier2000), were generated. A constant size population is expected to show a ragged, multimodal distribution, while an expanding population is consistent with a smooth unimodal distribution. In each case, the raggedness index assesses the match of the real data to the model while the overall validity of the estimated expansion model was tested by comparing the distribution of the test statistic, SSD (sum of squared differences) between the observed and the estimated mismatch distribution using a bootstrap approach. Evidence for departure from the estimated expansion model is given by significant SSD values (Excoffier & Schneider Reference Excoffier and Schneider1999).
The validity of a stepwise expansion model for the data was tested by Monte Carlo Markov chain simulations (1000 steps) in Arlequin version 2.0 (Schneider et al. Reference Schneider, Roessli and Excoffier2000). The time of the main expansion in generations (t) was estimated from the equation τ = 2 μt using the moment estimator of time to the expansion (τ) computed in Arlequin version 2.0 (Schneider et al. Reference Schneider, Roessli and Excoffier2000) and a mutation rate (μ) of 2.3% nucleotide sequence divergence per million years for arthropod mtDNA (Brower Reference Brower1994). As the weevils complete one generation in one-year (Chown & Scholtz Reference Chown and Scholtz1989), t could also be used as the time of the main expansion in years. Arlequin version 2.0 (Schneider et al. Reference Schneider, Roessli and Excoffier2000) was utilized to estimate the essential population parameter θ using Watterson's (Reference Watterson1975) estimate, which is based on the number of segregating sites among the sequences, and Tajima's (Reference Tajima1983) estimate, which is based on the calculation of the mean number of pairwise differences of the sequences. Tajima's estimate of θ puts more weight on ancient mutations and therefore reflects ancient population events (Fu Reference Fu1997).
Fu's (Reference Fu1997) FS test of neutrality, as estimated in Arlequin version 2.0 (Schneider et al. Reference Schneider, Roessli and Excoffier2000), and the R2 test of neutrality (Ramos-Onsins & Rozas Reference Ramos-Onsins and Rozas2002), as estimated in DNASP version 5 (Librado & Rozas Reference Librado and Rozas2009), were shown to be powerful tests for detecting recent population expansions under assumptions of neutrality with R2 showing better results for small sample sizes and FS for large sample sizes. The R2 statistic is based on the difference between the number of singleton mutations and the average number of nucleotide differences among sequences within a population sample (Ramos-Onsins & Rozas Reference Ramos-Onsins and Rozas2002). The haplotype diversity (h) and nucleotide diversity (π) were estimated in DNASP version 5 (Librado & Rozas Reference Librado and Rozas2009).
Results
A homologous region of 885 bp corresponding to the 5′ end of the COI gene was generated for 73 B. huntleyi individuals and two B. brevis outgroup specimens. All sequences have been deposited in the Genbank database under accession numbers GQ131940–GQ132014. Of the 885 sites characterized, 768 were conserved across all 75 sequences and 82 of the 117 variable sites were parsimony informative. Under the HKY+I+Γ model of sequence evolution, a transition (ti)/transversion (tv) ratio of 14.5 and base frequencies of A = 0.3069, C = 0.1590, G = 0.1497 and T = 0.3844 (% AT = 70.2%) were recovered. Third base position substitutions accounted for 88.03% of the variation with 11.11% and 0.85% being due to first and second base substitutions, respectively. Mutations at the nucleotide level gave rise to five non-synonymous amino acid substitutions at codons 4, 191, 219, 238, and 289. Of the 73 B. huntleyi individuals sequenced, 62 had unique haplotypes corresponding to a haplotype diversity (h) of 0.995 and a nucleotide diversity (π) of 0.01278 for the Prince Edward Islands archipelago. When considering each island individually, 43 unique haplotypes were recovered from the 51 Marion Island specimens sequenced (h = 0.992 and π = 0.01130), whilst for Prince Edward Island, 19 unique haplotypes were identified from 22 individuals (h = 0.987 and π = 0.00890).
MP analysis recovered 76125 equally parsimonious trees with homoplasy indices of: CI = 0.520, RI = 0.827 and RCI = 0.430 when characters were assigned equal weights. Successive weighting with the RCI recovered the same number of equally parsimonious trees and homoplasy indices of CI = 0.699, RI = 0.889 and RCI = 0.621. All methods of phylogenetic inference (Fig. 3) revealed the presence of two distinct clades. Clade 1 (99–100% support) comprised three individuals from Marion Island collected from 1000 m a.s.l. that were basal to the second and larger clade comprising individuals from Marion Island and Prince Edward Island, suggesting that B. huntleyi originally colonized Marion Island at high altitude. For the remaining individuals that grouped within clade 2, two major lineages could be discerned albeit with low levels of support. The first lineage (labelled ‘a’ in Fig. 3) contains individuals collected from Prince Edward Island alone, whilst lineage ‘b’ consists solely of individuals collected from Marion Island, the only exception being individual 317-19. Clade 2 is characterized by low bootstrap support for the internal nodes and by shallow divergences, with high support values occurring primarily at the terminal nodes. The haplotype network (Fig. 4) indicates that clade 1, the high altitude, relict population present on Marion Island, is separated from clade 2 by more than 12 steps. The two major lineages within clade 2, namely ‘a’ and ‘b’, which correspond to Prince Edward Island and Marion Island, respectively are separated from each other by more than seven steps.

Fig. 3 Neighbour-Joining (NJ) tree of Bothrometopus huntleyi from Marion Island (MI) and Prince Edward Island (PEI) and B. brevis outgroup from Heard Island, based on 885 nucleotides of the mitochondrial cytochrome oxidase I (COI) gene inferred using the HKY85 model of sequence evolution. The taxon name contains the species designation, sample number, body length measurement, altitude and/or sampling locality, sex and island of origin. Nodal support values ≥ 60 obtained from NJ and ML (100 000 and 5000 bootstrap replications, respectively) and ≥ 90 from Bayesian Inference (BI) and expressed as a percentage, are indicated NJ/ML/BI. ‘--’ denotes bootstrap support values below 60 (NJ and ML) and below 90 (BI).
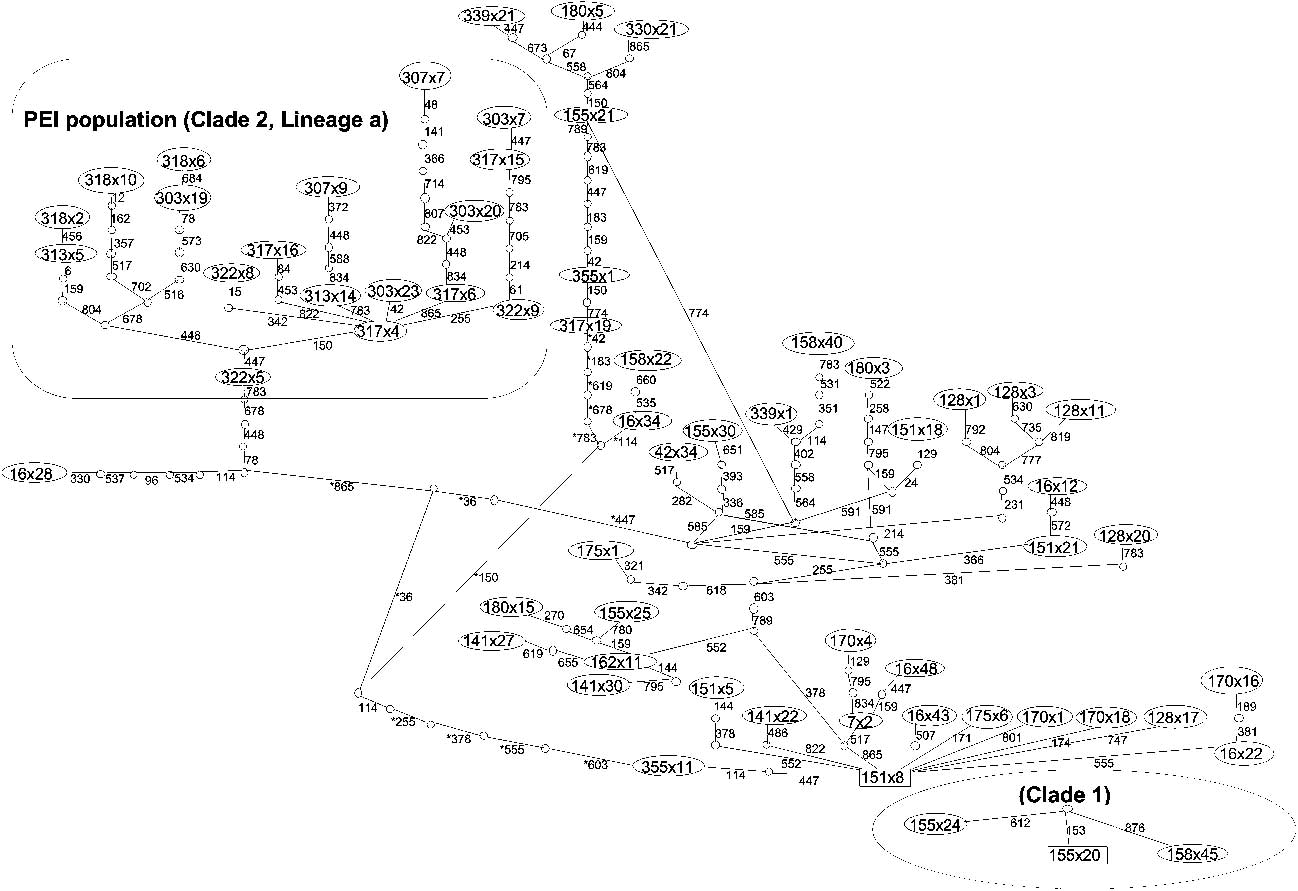
Fig. 4 Haplotype network of 73 Bothrometopus huntleyi individuals from Marion Island (MI) and Prince Edward Island (PEI) as estimated with TCS 1.21 (Clement et al. Reference Clement, Posada and Crandall2000).
Tests for rate heterogeneity revealed that B. huntleyi lineages from the Prince Edward Islands archipelago do not evolve at significantly different rates. The estimated time to coalescence of B. huntleyi is c. 0.723 m.y.a., predating the oldest dated rocks, but possibly not island emergence. The first major inter-island dispersal event, is estimated to have occurred c. 0.216 million years (m.y.) later, at which time the islands were fully formed, following which B. huntleyi dispersed to the remainder of Marion Island during predominantly glaciations-free periods. The results indicate that subsequent to this range expansion, the populations on the two islands have remained largely isolated with the only evidence of inter-island gene flow being detected for a single haplotype (317-19). This individual, sampled from Prince Edward Island shares recent common ancestry with individual 355-1 from Long Ridge South (Fig. 3) on Marion Island, and an estimated time to coalescence of c. 0.02 m.y.a. (Fig. 3).
The mismatch distributions for individuals collected on each island are presented in Fig. 5. Neither the SSD nor the raggedness index values (Table II) showed any significant deviation from the expansion model, indicating a population expansion for both Marion Island and Prince Edward Island. The time of the main expansion events calculated using τ = 2 μt (Table II) corresponds to c. 0.2 m.y. before present (bp).
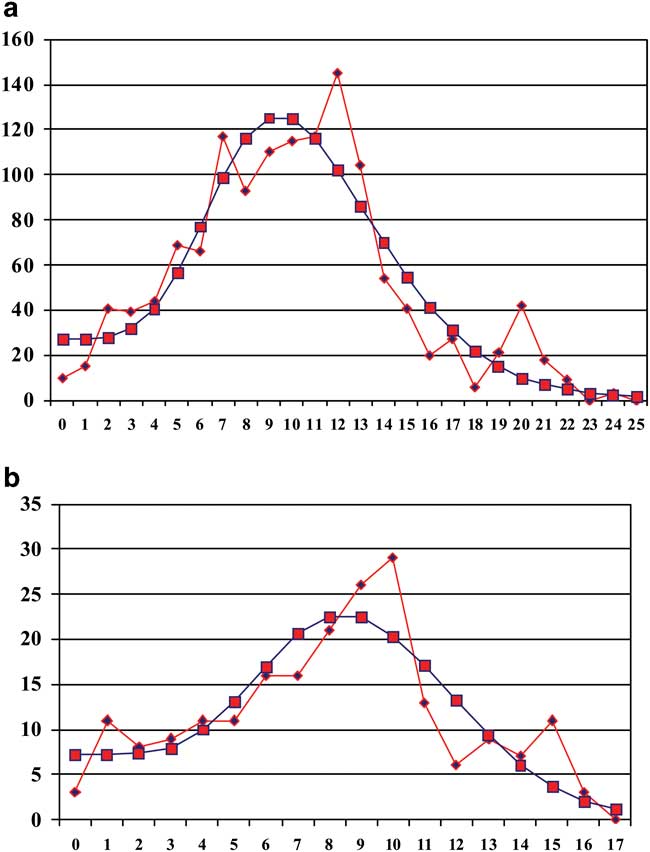
Fig. 5 Mismatch distribution for Bothrometopus huntleyi individuals from a. Marion Island (MI), and b. Prince Edward Island (PEI). Circles represent the simulated stepwise expansion model and the squares represent the observed data.
Table II Mismatch parameters for Bothrometopus huntleyi from Marion Island (MI) and Prince Edward Island (PEI): τ is the expansion parameter or date of the growth or decline measured in units of mutational time with τ = 2 μt where μ is the mutation rate, ant t is the time in generations. θ0 and θ1 are the substitution rates before and after expansion. SSD is the test of the validity of a stepwise expansion model based on the sum of the square deviations between the observed and the expected mismatch. The raggedness index quantifies the smoothness of the observed pairwise differences distribution. The statistical significance of both SSD and the raggedness index are estimated with a parametric bootstrap approach (probability values: * = P < 0.05, ** = P < 0.01, *** = P < 0.001). The timing of the most important expansion in each group (t divergence) was calculated on the basis of the equation τ = 2 μt.

Fu's Fs statistic (Table III) showed statistically significant and large negative values for both islands that are indicative of a population expansion (Fu Reference Fu1997). The R2 statistic (Table III) of Ramos-Onsins & Rozas (Reference Ramos-Onsins and Rozas2002) also indicates population expansion. The different estimations for θ are presented in Table III.
Table III Summary statistics for Bothrometopus huntleyi from Marion Island (MI) and Prince Edward Island (PEI) showing Fu's (Reference Fu1997) Fs values, Tajima's (Reference Tajima1983) D as well as estimations for θ (probability values: * = P < 0.05, ** = P < 0.01, *** = P < 0.001).

Discussion
Time to B. huntleyi haplotype coalescence on the Prince Edward Islands archipelago is estimated to have occurred c. 0.723 m.y.a. This date is older than that of the oldest dated rocks (0.45 m.y.a.), but remains within the estimated emergence time of the islands of less than 1 m.y.a. (McDougall et al. Reference McDougall, Verwoerd and Chevallier2001, Boelhouwers et al. Reference Boelhouwers, Meiklejohn, Holness and Hedding2008). It is probable that the founder population was restricted to high elevation areas of Marion Island for a period of c. 0.216 m.y. High elevation refugia in the form of nunataks have been identified for Marion Island both on geomorphological and molecular grounds (Boelhouwers et al. Reference Boelhouwers, Meiklejohn, Holness and Hedding2008, Mortimer et al. Reference Mortimer, Jansen van Vuuren, Lee, Marshall, Convey and Chown2010). Moreover, recent studies from Antarctica are also providing evidence of refugia for invertebrate taxa that initially appear to be at odds with the geological evidence (Convey et al. Reference Convey, Gibson, Hillenbrand, Hodgson, Pugh, Smellie and Stevens2008).
Bothrometopus huntleyi is estimated to have then dispersed to the remainder of Marion Island and on to Prince Edward Island, approximately 0.507 m.y.a. This occurrence coincides with the oldest dated rocks on the island (Boelhouwers et al. Reference Boelhouwers, Meiklejohn, Holness and Hedding2008). Individual 317-19 from Prince Edward Island groups with individuals (92% bootstrap support; Fig. 3) in the Marion Island-associated lineage b in clade 2, and represents a lineage that became established on Prince Edward Island much later at c. 0.02 m.y.a. When comparing the dates estimated in Fig. 3 with the estimated times of glaciations and volcanic activity on Marion Island (Fig. 1) it can be seen that, while numerous divergence events coincide with times of volcanic activity, very few divergence events occurred during the first and third glaciations periods. Thus, it appears that genetic divergence of B. huntleyi is linked to volcanic activity on Marion Island, especially at those times when the island was not glaciated. Quite what mechanism of transport was involved is difficult to determine, but complex associations between volcanism and population structure are well known for animals from other island systems (e.g. Vandergast et al. Reference Vandergast, Gillespie and Roderick2004, Emerson et al. Reference Emerson, Forgie, Goodacre and Oromi2006, Moya et al. Reference Moya, Contreras-Diaz, Oromi and Juan2007).
It should be noted that for B. huntleyi only one instance of migration from Marion Island to Prince Edward Island occurred after Prince Edward Island was originally colonized (Fig. 1). This contrasts markedly with the multiple migration events noted for Ectemnorhinus weevils from Marion Island to Prince Edward Island (Grobler et al. Reference Grobler, van Rensburg, Bastos, Chimimba and Chown2006). The difference between B. huntleyi and Ectemnorhinus weevils could be explained by habitat preference. Ectemnorhinus weevils occur mainly on vegetation (Chown Reference Chown1989, Reference Chown1992), and are thus more likely to be transported by birds than B. huntleyi which mainly occurs on rock surfaces and hides in crevices in the rocks. Bothrometopus huntleyi individuals also have adhesive brushes on the tarsomeres 1–3 (Kuschel & Chown Reference Kuschel and Chown1995) that prevent the weevils from being easily lifted by the frequent, strong south-westerly winds.
The results of the mismatch distribution analyses are consistent with that of the phylogeny as they indicate that the major expansion event occurred on Marion Island c. 0.192 m.y.a., with lower and upper bounds of ± 0.145 to ± 0.337 m.y.a., respectively. Most divergence times calculated for Marion Island (Fig. 3) fall within the upper bound estimates of the mismatch analyses. Similarly, most Prince Edward Island divergence estimates (Fig. 3) also fall within the lower and upper bounds of ± 0.125 to ± 0.273 m.y.a., respectively as estimated by the mismatch distribution analyses which revealed that a major expansion event occurred on Prince Edward Island c. 0.206 m.y.a..
At present, the high elevation Marion Island founder population is intact (clade 1) and two island-discrete population complexes occur which are separated by an ocean barrier of 19 km. Historical inter-island migration has been minimal and uni-directional (from Marion Island to Prince Edward Island only) compared to other endemic Ectemnorhinus weevils studied to date. The isolation of the population on Prince Edward Island from the population on Marion Island probably resulted from a combination of factors, including a lack of both volcanic activity and of bird and/or wind-assisted dispersal between the islands. The genetic data are thus consistent with the lack of morphological differences between the individuals found on the islands, and the assumption of a shared species. Whilst the phylogeny did not recover highly-supported island-specific clades, the haplotype network (Fig. 3) revealed that B. huntleyi individuals from Prince Edward Island are genetically more similar to each other than to individuals from Marion Island. It is therefore likely that these allopatric populations will continue to diverge as long as the natural inter-island isolation is maintained.
An important conservation biogeographic insight from our work is that anthropogenic gene flow between populations on Marion Island and Prince Edward Island should be prevented. Thus, the current practise of limiting visits to Prince Edward Island to a minimum, and the strict quarantine provisions for such visits (e.g. Davies et al. Reference Davies, Chown and Joubert2007) should be maintained. Moreover, the genetic distinctiveness of the B. huntleyi population on Marion Island, which is under threat via increased size-selective predation by the house mouse, Mus musculus domesticus (Chown & Smith Reference Chown and Smith1993), also underscores the need to control mice on Marion Island to ensure that both the unique genetic variation on Marion Island, and the evolutionary dynamics of the archipelago are conserved.
Acknowledgements
The authors thank I. McDougall and the Geological Magazine for the permission to use Fig. 1, taken from McDougall et al. (Reference McDougall, Verwoerd and Chevallier2001), and the referees for their helpful comments on a previous version of the ms. The Directorate Antarctica and Islands of the South African Department of Environmental Affairs and Tourism provided logistic support at Marion Island via the South African National Antarctic Programme (SANAP). This work was funded by a SANAP NRF grant (GUN2068301).


