


Introduction
In recent decades, concerns have escalated around the response of the Antarctic ice sheet to future climate change due to reports detailing increasing mass loss (Rignot et al. Reference Rignot, Velicogna, van den Broeke, Monaghan and Lenaerts2011, Reference Rignot, Mouginot, Scheuchl, van den Broeke, van Wessem and Morlighem2019, Velicogna et al. Reference Velicogna, Sutterley and van den Broeke2014), which contributes to global sea-level rise. Robust relationships have been drawn between warming and the retreat of ice shelves on the Antarctic Peninsula (e.g. the Larsen Ice Shelf) (Scambos et al. Reference Scambos, Bohlander, Shuman and Skvarca2004 and references therein, Etourneau et al. Reference Etourneau, Sgubin, Crosta, Swingedouw, Willmott and Barbara2019). High ice-shelf melt rates have also been observed in East Antarctica, particularly in Wilkes Land, where the increased mass loss is related to ocean heat flux influencing ice dynamics in the marine-based sector of the East Antarctic Ice Sheet (EAIS) (Shen et al. Reference Shen, Wang, Shum, Jiang, Hou and Dong2018, Rignot et al. Reference Rignot, Mouginot, Scheuchl, van den Broeke, van Wessem and Morlighem2019). Controversy surrounds the past behaviour of the EAIS throughout the Cenozoic. In fact, uncertainties on parameters such as eustatic sea-level changes (Raymo et al. Reference Raymo, Mitrovica, O'Leary, DeConto and Hearty2011), the interactions between the ocean and buttressing ice shelves (DeConto & Pollard Reference DeConto and Pollard2016) and partitioning of oxygen isotope records from benthic foraminifera into changes in deep-sea temperatures and terrestrial ice-sheet volume (Winnick & Caves Reference Winnick and Caves2015) remain and need to be resolved. A particularly intriguing question regards the complex relationship between ice volume in East Antarctica, global temperature and sea-level rise during the mid-Pliocene warm periods, when some sectors of the ice sheet retreated into the continent interior (i.e. Cook et al. Reference Cook, van de Flierdt, Williams, Hemming, Iwai and Kobayashi2013, Escutia & Brinkhuis Reference Escutia and Brinkhuis2014). The Mid-Pliocene warm periods, when the atmospheric concentration of CO2 ranged between 350 and 450 ppm, global temperatures were 2–3°C higher than today (Lisiecki & Raymo Reference Lisiecki and Raymo2005) and the global mean sea level was > 6 m higher than today (Dutton et al. Reference Dutton, Carlson, Long, Milne, Clark and deConto2015), represents a potential analogue for future climate in a high-CO2 world. The reported highstand in Pliocene sea level is not simulated by most coupled ice-sheet and climate models, which suggests that some mechanisms for ice-sheet retreat have not been included (DeConto & Pollard Reference DeConto and Pollard2016).
In order to improve predictions of future EAIS behaviour, ice-proximal geological and geophysical data are crucial, especially in glacier catchments with a potentially large sea-level rise contribution, as these data record the response of the ice sheet to past warm periods. One of these key areas is the Aurora Subglacial Basin, which drains ice to the Sabrina Coast via Totten Glacier, one of the primary outlets of the EAIS (Fig. 1); it has the fastest current thinning rate in East Antarctica (Greenbaum et al. Reference Greenbaum, Blankenship, Young, Richter, Roberts and Aitken2015, Shen et al. Reference Shen, Wang, Shum, Jiang, Hou and Dong2018). The Aurora Subglacial Basin today also hosts an active subglacial hydrological system that drains basal meltwater to the ocean (Wright et al. Reference Wright, Young, Roberts, Schroeder, Bamber and Dowdeswell2012). The contemporary change in this region is considered to be in response to the intrusion of warm (> 0°C) Modified Circumpolar Deep Water (MCDW) to the entrance of the Totten Ice Shelf cavity (Khazendar et al. Reference Khazendar, Schodlok, Fenty, Ligtenberg, Rignot and van den Broeke2013, Gwyther et al. Reference Gwyther, Galton-Fenzi, Hunter and Roberts2014, Nitsche et al. Reference Nitsche, Porter, Williams, Cougnon, Fraser, Correia and Guerrero2017), as recorded 40 km south of the continental shelf break north-east of Totten Glacier (Williams et al. Reference Williams, Meijers, Poole, Mathiot, Tamura and Klocker2011). The effect of MCDW intrusion on the shelf and under Totten Glacier has the potential to cause ice-shelf melting (Rignot et al. Reference Rignot, Mouginot, Scheuchl, van den Broeke, van Wessem and Morlighem2019) and, in turn, mass loss of the glacier itself (Khazendar et al. Reference Khazendar, Schodlok, Fenty, Ligtenberg, Rignot and van den Broeke2013). The spreading of the MCDW across the Sabrina Coast continental shelf impedes the formation of cool and dense shelf waters, referred to as high-salinity shelf water, despite the presence of a strong polynya (i.e. the Dalton polynya), where high volumes of sea ice form each year (Silvano et al. Reference Silvano, Rintoul, Pena-Molino, Hobbs, van Wijk and Aoki2018 and references therein).
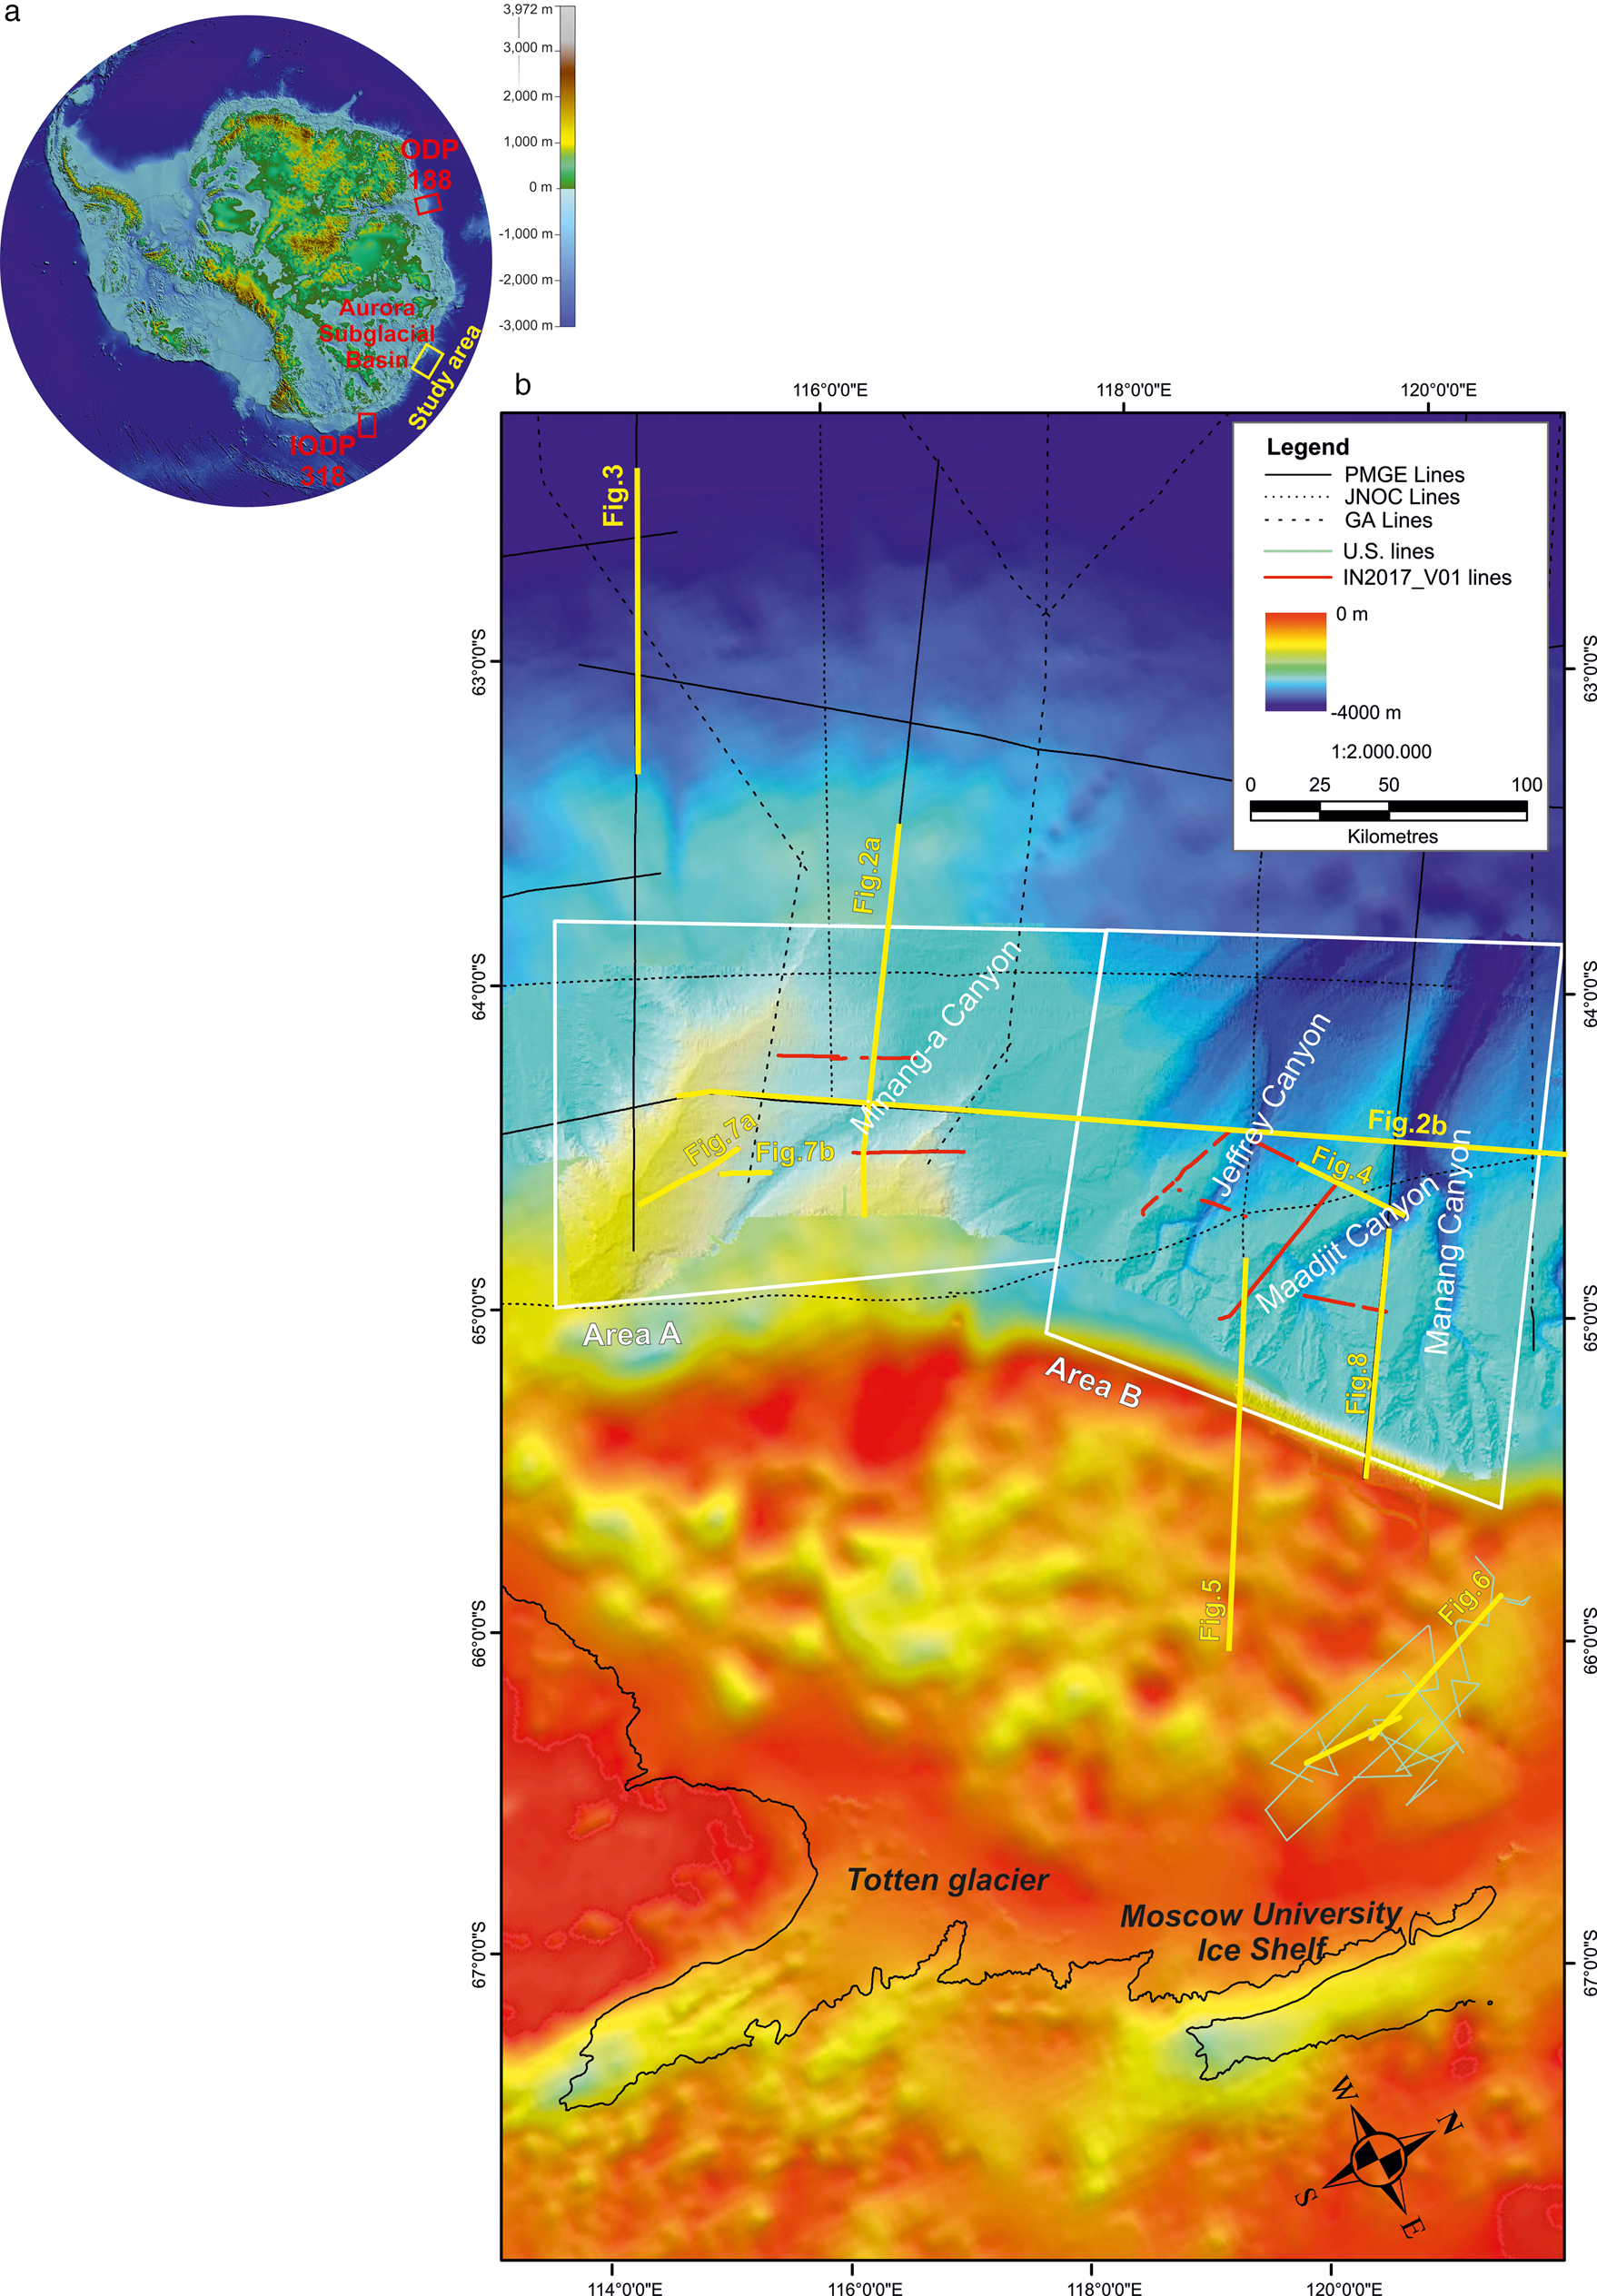
Fig. 1. a. Location map of the study area and position of the International Ocean Discovery Program Legs 318 and 188 (Bedmap2 bed elevation) (Fretwell et al. Reference Fretwell, Pritchard, Vaughan, Bamber, Barrand and Bell2013). b. Position map of the multichannel seismic lines analysed in this study; General Bathymetric Chart of the Oceans (GEBCO, 2008); bathymetry and multi-beam bathymetry based on data collected during the IN2017-V01 survey (O'Brien et al., unpublished data).
Models indicate that Antarctica's ice sheet nucleated in the higher elevations of the Gamburtsev Mountains and first reached the ocean near the Sabrina Coast and Prydz Bay (Huybrechts Reference Huybrechts1993, DeConto & Pollard Reference DeConto and Pollard2003). Marine-terminating glaciers have been reported to exist at the Sabrina Coast by the early-middle Eocene, implying the occurrence of ice caps before the emplacement of continental-scale ice sheets at c. 34 Ma (Gulick et al. Reference Gulick, Shevenell, Montelli, Fernandez, Smith and Warny2017). Offshore sedimentary sequences indicate that between c. 34 and 14 Ma, the ice masses on East Antarctica were warm-based and dynamic (De Santis et al. Reference De Santis, Brancolini and Donda2003, Cooper & O'Brien, Reference Cooper and O'Brien2004, Donda et al. Reference Donda, O'Brien, de Santis, Rebesco and Brancolini2008, Escutia & Brinkhuis Reference Escutia and Brinkhuis2014, Salabarnada et al. Reference Salabarnada, Escutia, Röhl, Nelson, McKay and Jiménez-Espejo2018). As a consequence, glacial erosion and meltwater transport were considered the dominant agents of landscape modification, until a further decline in temperatures at c. 14 Ma (Shevenell et al. Reference Shevenell, Kennett and Lea2004, Lewis et al. Reference Lewis, Marchant, Ashworth, Hedenäs, Hemming and Johnson2008). At this time, a more stable continental-scale ice sheet was established and caused a switch from largely warm-based glaciation to a polythermal system (Anderson et al. Reference Anderson, Warny, Askin, Wellner, Bohaty and Kirschner2011).
Geological records from distal margin areas around East Antarctica are geographically sparse, making regional comparisons difficult. Previous studies performed along the Sabrina Coast, however, have revealed how sediments deposited seaward of Totten Glacier, i.e. on the continental slope and rise, where the deposits are not influenced by erosion related to repeated glacier expansions and retreats have provided a continuous record of the variations in the glacial regime (Leitchenkov et al. Reference Leitchenkov, Guseva, Gandyukhin, Cooper and Raymond2007), and thereby show great potential for data to be collected in the distal margin areas. A recent marine geological and geophysical survey offshore from Totten Glacier (IN2017-V01, RV Investigator) has been conducted in order to assist with constraining the impact of the ice-sheet evolution on the continental rise processes and, for the first time, to collect high-resolution multichannel seismic profiles in this region of the continental margin.
This study presents the results of the seismostratigraphic analyses performed on the whole geophysical dataset collected off the Sabrina Coast between 114° and 122°E, comprising Russian, Australian and Japanese multichannel seismic profiles (MCS), available through the Scientific Committee on Antarctic Research (SCAR) Seismic Data Library System (SDLS), and the newly acquired high-resolution MCS data collected by the Istituto Nazionale di Oceanografia e di Geofisica Sperimentale (OGS) in 2017 (Fig. 1).
We have identified seven seismic units, called WL-S4 to WL-S10, in accordance with previous studies performed in the area (Leitchenkov et al. Reference Leitchenkov, Guseva, Gandyukhin, Cooper and Raymond2007, Reference Leitchenkov, Guseva, Gandyukhin and Ivanov2015). These sequences are bounded by major, regional-scale horizons named WL3 to WL9 (Fig. 2a & b). On the basis of tentative correlations with Ocean Drilling Program (ODP) Leg 188 and International Ocean Discovery Program (IODP) Expedition 318 performed by Leitchenkov et al. (Reference Leitchenkov, Guseva, Gandyukhin, Cooper and Raymond2007, Reference Leitchenkov, Guseva, Gandyukhin and Ivanov2015), these units probably range from Eocene to present and record the evolution of the glacial history of this part of the continental margin.

Fig. 2. a. Part of the multichannel seismic line RAE 5101, where the major glacial sequence boundaries are indicated. Features highlighted in yellow indicate the progressive upward and upslope channel migration (left) and debris flow deposits (right). b. Part of the multichannel seismic line RAE 5108, where debris flows are recognizable at the easternmost channel axis. Arrows indicate possible fluid-escape structures. Canyon names from O'Brien et al. (unpublished data).
This analysis enabled the identification of key acoustic features indicative of changes in the depositional setting related to the emplacement and subsequent major evolutionary steps of the EAIS. This study also highlights the role of glacial meltwater in shaping the margin architecture from the EAIS's emplacement through to its present configuration. Moreover, the high resolution of the OGS multichannel seismic data has led to the identification of well-imaged and well-preserved sedimentary successions, which could represent priority targets for future IODP deep drilling in the study area.
Methods
We have analysed multichannel seismic profiles collected between ~114° and 122°E by Geoscience Australia as part of the Australian Antarctica and Southern Ocean Profiling Project in 2001–03 (AASOPP; ‘GA’ seismic lines), by the Russian Polar Marine Geosurvey Expedition (PMGE; ‘RAE’ seismic lines) and by the Japan National Oil Corporation (JNOC; ‘TH’ seismic lines). These MCS datasets are available through the SCAR SDLS, and they have been integrated with more recently acquired high-resolution multichannel seismic profiles, collected in January–March 2017 by the OGS on the continental rise off the Sabrina Coast (East Antarctica). The data were acquired as part of the Italian Program of Antarctic Research (PNRA) ‘TYTAN’ (Totten Glacier dynamics and Southern Ocean circulation impact on depositional processes since the Mid- to Late Cenozoic) project during the Australian Marine National Facility survey IN2017-V01 on board the RV Investigator. TYTAN is embedded in to the Australian project ‘Interactions of the Totten Glacier with the Southern Ocean through multiple glacial cycles’ that aims to understand the interaction of Totten Glacier and its ice drainage basin with the Southern Ocean during periods of warming and ice-sheet retreat in the Pleistocene and Holocene; it will provide context for the present-day glacial retreat and sensitivity constraints for the coupled ice sheet and climate change models that will be used to predict future ice-sheet change.
In order to achieve these scientific objectives, three areas were identified for the geophysical and oceanographic survey: two on the continental slope and rise off Sabrina Coast (so-called ‘area A’ and ‘area B’) (Fig. 1) and one on the continental shelf, which was not investigated because it remained covered by sea ice throughout the season. Table I summarizes the main parameters of the data acquisition. Information regarding the SDLS geophysical datasets are available through the following link: https://sdls.ogs.trieste.it/cache/index.jsp.
Table I. Main acquisition parameters of the high-resolution seismic data collected by the Istituto Nazionale di Oceanografia e di Geofisica Sperimentale (OGS) during the IN2017-V01 survey.

The new data acquisition was stopped several times due to proximity with marine mammals, as stated by the Australian Government environmental regulations (i.e. Australian Environment Protection and Biodiversity Conservation (EPBC) Act Policy Statement 2.1, Department of the Environment, Water, Heritage and the Arts, 2008), so that the length of almost all of the seismic lines was less than initially planned, and some of them contain gaps.
The data-processing sequence includes: frequency filtering and amplitude recovery (application of a Butterworth bandpass filter 4–8 150–250 Hz, notch filter 50 Hz, amplitude scaling); velocity analysis, as accurate as possible, due to the short streamer length (creation of semblance files, offset sort/stack records and constant-velocity stack); automatic gain control (window 500 ms); normal moveout correction and common-midpoint stack; migration (2D downward continuation-finite difference migration); and mute and SEGY export (bottom picking, mute data traces and SEGY output).
Seismostratigraphic analysis
Below, we provide a description of the main seismostratigraphic characteristics of the sedimentary succession deposited above WL3, which is the most representative seismic horizon identified along a wide portion of the East Antarctic margin (i.e. between 80° and 140°E), and is interpreted as marking the inception of the ice-house era in East Antarctica (see next paragraph).
On the continental rise off the Sabrina Coast, WL3 marks a notable change in the seismic facies: below WL3, seismic horizons show high amplitude and lateral continuity, while above of it, the unit WL-S4 is composed of low-amplitude and less continuous, commonly seaward-dipping reflectors (Fig. 2a). They become progressively more discontinuous with an irregular trend in the upper portion of WL-S4, where small-scale channel-levee systems are identifiable.
We suggest that the seismic facies change across WL3 records a progressive increase in the downslope sedimentary processes.
The unconformity WL4 represents a prominent erosional unconformity in both areas A and B. The most peculiar feature of sequences WL-S5, WL-S6 and WL-S7 lying above WL4 is the emplacement of a deep water turbidity system, with turbidity flow channels cutting the slope and rise, mass wastings, channel-levee and overbank deposits (Fig. 2b). In particular, just above WL4 (i.e. within the seismic unit WL-S5), the emplacement of the major channel axes and channel-levee systems took place on the upper rise (Fig. 2a & b). This suggests that a consistent sediment input from the continent, with a higher energy of the depositional environment compared to sequence WL-S4, occurred during WL-S5 deposition.
Sequence WL-S5 onlaps the unconformity WL4. It comprises discontinuous, irregular reflectors with low amplitude in area A, while more continuous reflectors are recognizable in the most distal sector of area A (Fig. 3) and in area B (Fig. 2b). The easternmost part of area B is dominated by a thick, opaque lens sharply truncating the stratified package. It is truncated on top by the unconformity WL5, a high-amplitude reflector showing an irregular character, and merges with the younger sequence boundary WL6 in area B (Fig. 2b).

Fig. 3. Part of the multichannel seismic line RAE 5006, where channel formation just above WL4 and channel axis migration are highlighted. In this area, overbank sediment waves form, starting from WL5.
Sequence WL-S6 develops above WL5, which is locally (in area B) truncated by the unconformity WL6 (e.g. Fig. 2b). The sequence WL-S6 is characterized by a widespread channel development (Figs 2a & b & 3). In area A, WL5 marks the beginning of development of sediment waves probably deposited on the channel-levees as a consequence of sediment overflow and/or of along-slope bottom currents; the sediment waves appear to progressively grow up from ~5.6 s two-way travel time to the sea floor (Fig. 3).
WL6 is the oldest regional-scale unconformity identifiable on the high-resolution OGS data (Fig. 4). In area B, the seismic unit WL-S7 is characterized by sudden vertical and horizontal changes in the reflector's geometry, including semi-transparent units with mound-like features and sharp boundaries that we interpret as debris flows. Vertical to sub-vertical columnar zones with reduced reflection continuity, interpreted as fluid-escape structures, are also recognizable in places (Fig. 2b).

Fig. 4. High-resolution multichannel seismic line OGS 10b, showing a well-layered levee formed within seismic sequence WL-S7. Red arrows indicate sediment compaction-related faults.
In area B, WL6 has been traced up to the slope and speculatively onto the shelf (Fig. 5). Here, rough reflector configurations and U-shaped channels ~1 km wide and ~100 m deep are recognized above what we interpret as WL6 (Fig. 5).

Fig. 5. Multichannel seismic line TH13A, which represents the only profiles crossing the continental margin from the shelf to the upper rise. A tentative shelf-to-rise correlation of some key sequence boundaries is indicated.
WL7 marks an increase in the acoustic impedance contrast between WL-S7 and WL-S8 (Fig. 2a & b), the latter being characterized by high-frequency alternation between low- and high-amplitude sub-parallel reflectors that probably reflect rapid and frequent changes in sediment supply. On the high-resolution data, faulting is locally recognizable above and below WL7 (Fig. 4), and possibly occurs as a consequence of sediment compaction.
In both areas A and B, channels cutting the stratified section are observed; however, in area A, alternation of channel erosion and infill occur, while in area B, erosion seems to dominate, as revealed by the occurrence of deeper channels, with steeper flanks, truncating the entire stratified section of WL-S8 up to the present (e.g. Figs 2b & 4). WL7 is also the downlap surface for the prograding complex with eroded topset building the present-day continental slope (Fig. 6).

Fig. 6. Tentative shelf-to-rise correlation of seismic horizons WL3 and WL7, which correspond to the boundaries of Megasequences II and III of Gulick et al. (Reference Gulick, Shevenell, Montelli, Fernandez, Smith and Warny2017).
WL8 marks a drastic change in the seismic facies. Deposits belonging to WL-S9, which consists of a semi-transparent, well-layered unit, in fact generally fill the channel systems and drape the mass-wasting deposits (Figs 2a & b & 7a). On the high-resolution data, small-scale opaque lenses, interpreted as mass-wasting deposits, are recognizable within the layered unit (Fig. 7b). In places, WL-S9 appears to be cut by channels, which are here largely asymmetric, with the western side more developed that the eastern side. WL-S9 occurs only in area A, while it pinches out towards the east (e.g. Fig. 2b).

Fig. 7. a. High-resolution multichannel seismic line OGS 06, where the uppermost seismic sequences WL-S9 and WL-S10 clearly show remarkable reductions of the seismic reflector amplitude. b. High-resolution multichannel seismic line OGS 02, where debris flow occur as multiple events, affecting the seismic sequences WL-S7 and WL-S9.
Sequence WL-S10 overlies the shallowest unconformity (i.e. WL9) and occurs only in the westernmost portion of area A. It consists of a well-layered unit, mostly composed of low-amplitude, sub-parallel reflectors (e.g. Fig. 7a).
The uppermost stratigraphic levels show that, in area A, alternation of channel erosion and infill occurs, while in area B, erosion seems to dominate, as revealed by the occurrence of deeper channels, with steeper flanks, truncating the entire stratified section from the deposition of WL-S7 up to the present (e.g. Fig. 4).
The East Antarctic Ice Sheet evolution in the Sabrina Coast in a continent-wide perspective
Many attempts to decipher the Antarctic ice-sheet history based on geophysical and geological data have been made in the last 30 years (e.g. Cooper et al. Reference Cooper, Brancolini, Escutia, Kristoffersen, Larter, Leitchenkov, Florindo and Siegert2009 and references therein). All of these studies emphasize the role of these data in reconstructing the climate evolution of the Antarctic continent from the pre-glacial era to the present time, which comprises three main key periods: 1) pre-glacial conditions (Phase 1 of Donda et al. Reference Donda, Brancolini, O'Brien, de Santis and Escutia2007), 2) growth and development of the ice sheet (Phases 2 and 3 of Donda et al. Reference Donda, Brancolini, O'Brien, de Santis and Escutia2007) and 3) transition to polar conditions (Phase 4 of Donda et al. Reference Donda, Brancolini, O'Brien, de Santis and Escutia2007). During Phases 2 and 3, a temperate and/or polythermal, highly dynamic ice sheet, reaching the continental margin and calving at sea, grew on the continent. Glacial meltwater played a crucial role in eroding and transporting sediments to the shelf edge and on the rise, where channel-levees, debris flows and sediment drifts formed, as evidenced on several portions of the Antarctic margin, such as in Prydz Bay (Cooper & O'Brien Reference Cooper and O'Brien2004 and references therein), Weddell Sea (Kuvaas & Kristoffersen Reference Kuvaas and Kristoffersen1991) and Wilkes Land (De Santis et al. Reference De Santis, Brancolini and Donda2003, Donda et al. Reference Donda, Brancolini, O'Brien, de Santis and Escutia2007, Reference Donda, O'Brien, de Santis, Rebesco and Brancolini2008, Leitchenkov et al. Reference Leitchenkov, Guseva, Gandyukhin, Cooper and Raymond2007, Escutia et al. Reference Escutia, Brinkhuis and Klaus2011).
The transition to polar, almost cold, dry ice-sheet conditions has been recorded all along the Antarctic margin by a remarkable change in the continental shelf architecture, from a predominantly aggrading to a mostly prograding geometry of the seismic units, and by the shelf overdeepening (e.g. Cooper et al. Reference Cooper, Brancolini, Escutia, Kristoffersen, Larter, Leitchenkov, Florindo and Siegert2009 and references therein). Due to the reduced or even absent occurrence of meltwater, significant amounts of sediments were deposited within the prograding wedge, interpreted as glacial deposits produced by erosion at the inner portions of the continental shelf and deposited at the grounding line during maximum advances of the ice sheet.
This overall picture is quite well supported by several Antarctic and sub-Antarctic stratigraphic records, e.g. Deep Sea Drilling Program (DSDP) Leg 28, Cape Roberts Drilling Project, ODP Legs 119, 188 and 189 and IODP Leg 318.
Based on the seismostratigraphic analysis of the main seismic units previously described, we speculate that off the Sabrina Coast, these three key periods are represented by the following units: 1) pre-glacial (Phase 1), seismic units below WL3, 2) growth and development of the ice sheet (Phases 2 and 3), WL-S4 to WL-S7, and 3) transition to polar conditions (Phase 4), WL-S8, WL-S9 and WL-S10. Figure 8 shows the overall architecture of the Sabrina Coast continental slope and rise, following Leitchenkov et al. (Reference Leitchenkov, Guseva, Gandyukhin, Cooper and Raymond2007, Reference Leitchenkov, Guseva, Gandyukhin and Ivanov2015), where the four main evolutionary phases are highlighted.

Fig. 8. Interpreted seismic line RAE 5103 (see Fig. 1 for location), which shows the overall architecture of the Sabrina Coast continental slope and rise, following Leitchenkov et al. (Reference Leitchenkov, Guseva, Gandyukhin, Cooper and Raymond2007, Reference Leitchenkov, Guseva, Gandyukhin and Ivanov2015). The four main evolutionary phases are highlighted.
Discussion
The overall seismostratigraphic characteristics of the sedimentary sequences deposited on the continental rise seaward of the Sabrina Coast show remarkable differences between areas A and B that are also highlighted by the present-day bathymetry: area A is shallower, dominated by large sediment ridges and bounded by deep channels, whereas area B is instead characterized by a complex network of erosional channels (O'Brien et al., unpublished data).
Based on tentative correlations of the main, regional-scale seismic horizons all along the Wilkes Land margin (Donda et al. Reference Donda, Brancolini, O'Brien, de Santis and Escutia2007, Leitchenkov et al. Reference Leitchenkov, Guseva, Gandyukhin, Cooper and Raymond2007, Reference Leitchenkov, Guseva, Gandyukhin and Ivanov2015), WL3 should correspond to WL-U3 of De Santis et al. (Reference De Santis, Brancolini and Donda2003) and Donda et al. (Reference Donda, Brancolini, O'Brien, de Santis and Escutia2007). The recent drilling and dating of WL3 on the continental rise (IODP site 1356) (Escutia et al. Reference Escutia, Brinkhuis and Klaus2011) established that it represents a major erosion related to the onset of glaciation at c. 34 Ma (early Oligocene), thus marking the transition from the greenhouse to the ice-house era in East Antarctica. In the study area, there is evidence that WL3 is Late Eocene in age (Leitchenkov et al. Reference Leitchenkov, Guseva, Gandyukhin and Ivanov2015). A recent study of the continental shelf off the Sabrina Coast (Gulick et al. Reference Gulick, Shevenell, Montelli, Fernandez, Smith and Warny2017) recognized prominent seismic unconformities separating three main Megasequences (MS). Based on a tentative shelf-rise correlation (Fig. 6), we suggest that WL3 should correlate to the boundary between MS-I and MS-II, which has been interpreted as providing the first preserved evidence of grounded ice on the Sabrina Coast shelf in the Late Eocene (c. 38 Ma) (Gulick et al. Reference Gulick, Shevenell, Montelli, Fernandez, Smith and Warny2017).
The progressive increase of the sediment input from the continent recorded by the seismic unit WL-S4 (Phase 2) would be consistent with the existence of a fluvial-like drainage system possibly related to the nucleation of the EAIS in the Gamburtsev Mountains (DeConto & Pollard Reference DeConto and Pollard2003) and the arrival of marine-terminating glaciers near the Sabrina Coast by the Mid-Eocene (Gulick et al. Reference Gulick, Shevenell, Montelli, Fernandez, Smith and Warny2017). This high-energy fluvial system would have fed turbidity currents, which led to the first emplacement of the channel-levee systems (Fig. 9b) (Leitchenkov et al. Reference Leitchenkov, Guseva, Gandyukhin, Cooper and Raymond2007).

Fig. 9. Conceptual model of the evolution of the Sabrina Coast continental margin. a. Greenhouse conditions (not discussed in this paper). b. A fluvial-like drainage system related to the nucleation of the East Antarctic Ice Sheet (EAIS) fed turbidity currents, which led to the first emplacement of channel-levee systems on the continental rise. c. The predominance of downslope processes related to the expansion of the ice sheet led to the growth of channel-levees and to the deposition of debris flows on the continental rise. d. An expanded polar ice sheet led to the formation of a prograding wedge on the continental shelf and slope. However, glacial fluctuations with abundant meltwater release still occurred during Phase 4. MCDW = Modified Circumpolar Deep Water.
Unconformity WL4 marks the beginning of Phase 3, which records the widespread occurrence of gravity-driven processes and, in general, the dominance of downslope processes. We suggest this change to be related to the growth of a continental-scale ice sheet as first proposed by Kennett (Reference Kennett1977) based on the oxygen isotopic record, by Coxall et al. (Reference Coxall, Wilson, Pälike, Lear and Backman2005) based on deepening of the calcite compensation depth and modelled by DeConto & Pollard (Reference DeConto and Pollard2003).
Seismic units WL-S4 to WL-S7 (Phases 2 and 3) would record a progressive increase of sediment input from the continent, similarly to Prydz Bay and western Wilkes Land, where high sedimentation rates of between 100 and 130 m My-1 have been recorded at IODP site 1356 and ODP site 1165 for the Late Oligocene and the Early Miocene (O'Brien et al. Reference O'Brien, Cooper, Florindo, Handwerger, Lavelle and Passchier2004, Escutia et al. Reference Escutia, Brinkhuis and Klaus2011). We interpret this enhanced sediment transport to the rise area as the product of hyperpycnal flows of sediment-laden subglacial meltwater released from beneath the ice sheet grounded at the continental shelf edge during glacial maxima, leading to turbidite flows across the continental slope (Fig. 9c) (e.g. Gales et al. Reference Gales, Larter, Mitchell and Dowdeswell2013, Fernandez et al. Reference Fernandez, Gulick, Domack, Montelli, Leventer and Shevenell2018). In fact, it is known that the subglacial drainage systems had an important influence on the dynamics of the ice sheet (Wright et al. Reference Wright, Young, Roberts, Schroeder, Bamber and Dowdeswell2012). The erosion rate depends primarily on the basal velocity of the ice sheet, and because there is the potential for high velocities at the ice-sheet margin, so there is also the potential for enhanced erosion rates in that area (Aitken et al. Reference Aitken, Roberts, van Ommen, Young, Golledge and Greenbaum2016). We then suggest that sequence WL-S5 indicates the appearance of large continental ice sheets on Antarctica, also known as Oi-1 Glaciation (Zachos et al. Reference Zachos, Pagani, Sloan, Thomas and Billups2001 and references therein). The occurrence of highly fluctuating, warm-based outlet glaciers dynamically responding to climate change (Levy et al. Reference Levy, Meyers, Naish, Golledge, McKay and Crampton2019) would have led to sediment delivery from the continent interior to the shelf edge, leading to the formation of turbidity flows down to the slope and rise area (Fig. 9c). This statement would be sustained by the tentative correlation with the findings from Gulick et al. (Reference Gulick, Shevenell, Montelli, Fernandez, Smith and Warny2017), based upon which our sequences WL-S5 and WL-S6 should be included in the MS-II Megasequence (Fig. 6), Oligocene–Miocene in age and interpreted as recording 11 glacial advances and retreats from the Aurora Subglacial Basin. In fact, the U-shaped channels we have identified on the continental shelf (Fig. 5) appear to be very similar to the features described by Gulick et al. (Reference Gulick, Shevenell, Montelli, Fernandez, Smith and Warny2017) for MS-II, represented by > 600 m-thick deposits that exhibit a rough morphology and the occurrence of channels interpreted by those authors as representing subglacial tunnel valleys related to meltwater-rich subpolar glacial systems.
An important expansion of the ice sheet, known as Mi-1 Glaciation, took place during a brief, but intense glacial maximum (Naish et al. Reference Naish, Woolfe, Barrett, Wilson, Atkins and Bohaty2001, Zachos et al. Reference Zachos, Pagani, Sloan, Thomas and Billups2001) at the Oligocene–Miocene boundary (i.e. the inferred age of unconformity WL5). During this glacial expansion, ice volume and palaeo-sea-level estimates suggest a significant but transient growth in the Antarctic ice sheet to 25% larger than present (Wilson et al. Reference Wilson, Pekar, Naish, Passchier, DeConto, Florindo and Siegert2008). Unconformity WL5 also represents an important step in the evolution of this part of the continental margin because it would indicate that the bottom contour currents were capable of shaping the observed morphologies (e.g. Lodolo et al. Reference Lodolo, Donda and Tassone2006, Escutia et al. Reference Escutia, Brinkhuis and Klaus2011).
The general change in the depositional style above unconformity WL7 on both the continental shelf and rise marks the transition to Phase 4, which is well imaged on the OGS high-resolution data (Figs 4 & 7a & b). The most remarkable change in the seismic unit architecture is represented by a steep prograding wedge formed on the continental shelf and slope above WL7 and produced during maximum advances of the ice sheet (Fig. 9d) (Donda et al. Reference Donda, Brancolini, O'Brien, de Santis and Escutia2007).
Based on a tentative slope-to-rise correlation, we speculate that WL7 corresponds the landward-dipping angular unconformity identified by Gulick et al. (Reference Gulick, Shevenell, Montelli, Fernandez, Smith and Warny2017). This horizon truncates seaward-dipping strata and marks the boundary between their MS-II and MS-III megasequences, the latter being considered the expression of an expanded polar ice sheet that has occupied the Sabrina Coast continental shelf since the late Miocene (c. 7.0–5.5 Myr ago). We speculate that the transition from temperate to polar settings of the EAIS occurred over a relatively long period between the Late Miocene and Early Pliocene. During this transition, polar conditions with reduced meltwater and sediment supply to the rise became progressively dominant, although large-scale glacial fluctuations with abundant meltwater release still occurred (Fig. 9d). This hypothesis is supported by some recent studies on the Wilkes Subglacial Basin that describe a highly dynamic ice sheet, with a glacial margin that is thought to have migrated hundreds of kilometres inland during the Pliocene warm periods (Cook et al. Reference Cook, van de Flierdt, Williams, Hemming, Iwai and Kobayashi2013, Patterson et al. Reference Patterson, McKay, Naish, Escutia, Jimenez-Espejo and Raymo2014). In addition, palaeoclimate evidence from remarkable fossil vegetation from the Transantarctic Mountains shows that, during the Mid- to Late Neogene, Antarctica was perhaps 30°C warmer than today (Rees-Owen et al. Reference Rees-Owen, Gill, Newton, IvanoviĆ, Francis and Riding2018). Mass-wasting deposits (e.g. Fig. 7b) would represent the distal record of glacial advance and collapse and slope failures, suggesting the occurrence of a dynamic ice sheet with a well-organized subglacial drainage system, with possible recurrent outburst flooding events even under polar conditions (Gales et al. Reference Gales, Larter, Mitchell and Dowdeswell2013, Fernandez et al. Reference Fernandez, Gulick, Domack, Montelli, Leventer and Shevenell2018). The origin of such subglacial water could be connected to the complex subglacial hydrological system identified inland, together with numerous subglacial lakes (Siegert et al. Reference Siegert, Carter, Tabacco, Popov and Blankenship2005, Wright et al. Reference Wright, Young, Roberts, Schroeder, Bamber and Dowdeswell2012, Aitken et al. Reference Aitken, Roberts, van Ommen, Young, Golledge and Greenbaum2016). Sediment-laden flows were possibly more active beneath ice streams flowing rapidly within cross-shelf troughs (Fernandez et al. Reference Fernandez, Gulick, Domack, Montelli, Leventer and Shevenell2018), thus leading to the drainage of large volumes of ice and delivering sediment to the ice-stream terminus during glacial periods (Gales et al. Reference Gales, Larter, Mitchell and Dowdeswell2013 and references therein). Indeed, it has been shown that ice-shelf meltwater production is a key ablation process, with basal melting being strongest near the grounding zones of major glaciers (Rignot et al. Reference Rignot, Mouginot, Scheuchl, van den Broeke, van Wessem and Morlighem2019 and references therein). High meltwater rates have been recorded at Totten Glacier, with a basal meltwater production of ~63 Gt yr-1, which corresponds to basal melt rates of ~10 m of water per year (Rignot et al. Reference Rignot, Mouginot, Scheuchl, van den Broeke, van Wessem and Morlighem2019). Increased melting in the Totten sub-ice-shelf cavity is interpreted as being a consequence of the reduction or absence of cold water mass formation, triggering increased mass loss from the ice sheet (Khazendar et al. Reference Khazendar, Schodlok, Fenty, Ligtenberg, Rignot and van den Broeke2013, Silvano et al. Reference Silvano, Rintoul, Pena-Molino, Hobbs, van Wijk and Aoki2018).
Figure 9 shows a conceptual model of the evolution of Sabrina Coast since the early emplacement of the EAIS.
Conclusions
Compared to other sectors of the Wilkes Land margin, the characteristics of the main sequences in the whole study area suggest that downslope processes were dominant since the early development of the EAIS. They still contribute to shaping the distal margin architecture even during its latest development stages (i.e. Phase 4), when glacial meltwater-related fluxes were able to erode and deliver sediments to the rise area, which, in the distal areas, were entrained by along-slope currents. We suggest that these canyons formed and were fed by the downslope fluxes of the Totten Glacier meltwater, which would be particularly abundant beneath ice streams flowing rapidly within cross-shelf troughs, delivering sediments to the shelf edge and then flowing along the slope to the rise area.
We would like to emphasize that both the unit age attribution and the rise-to-slope correlation are very speculative. All of our inferences need to be validated by deep sampling (i.e. IODP-type techniques), which would provide a complete record of the history of glaciation in this margin. In fact, expanded and well-preserved sedimentary successions imaged on the IN2017-V01 seismic data (e.g. Fig. 6) have potentially preserved good palaeoclimate and palaeooceanographic records and are worthy of future priority targeting for IODP scientific drilling expeditions. Transects of drill cores spanning ice-proximal to ice-distal environments across the continental margin within this climate-responsive region would allow for a better understanding of temporal and spatial ice-volume changes and could provide significant improvement to the knowledge of the sensitivity of the EAIS to climate change.
Acknowledgements
We thank the RV Investigator captain and crew and the technical and scientific staff aboard as part of the Marine National Facility Survey IN2017-V01. We also acknowledge HIS Markit Global Sàrl for providing an academic license for Kingdom-Seismic & Geological Interpretation Software and the Antarctic Seismic Data Library System (SDLS) for providing open access to the multichannel seismic data. We are grateful to the editor, Dr R. Timmermann, to Dr R.D. Larter and to an anonymous reviewer for their insightful reviews that greatly improved this manuscript.
Author contributions
FD: conception, design, data interpretation and writing. GL: data analysis and interpretation, discussion and comments on the paper draft. GB: discussion and comments on the paper draft. RR: acquisition and processing of the seismic data and graphic editing. LDS: comments on the paper draft and seismic survey planning. CE: discussion and comments on the paper draft. PO'B: discussion and comments on the paper draft. LA: comments on the paper draft and principal investigator of the Australian project. AC: reference person for the acquisition of the seismic data and preliminary interpretation onboard. DC: acquisition of the seismic data and graphic editing.
Financial support
This study is funded by Italian Programma Nazionale di Ricerche in Antartide (PNRA) under the TYTAN Project. The Marine National Facility Survey IN2017-V01 survey was supported by the Australian Government through Australian Antarctic Science grant AAS#4333 and Australian Research Council grant DP170100557. G. Leitchenkov acknowledges the Russian Science Foundation grant 16-17-10139.


