


Introduction
The geographical situation and the particular geomorphological and climatic characteristics of the northern Antarctic Peninsula region, make this an ideal area to study environmental changes. As a result, these changes can be used as sensitive indicators of climate warming (King et al. Reference King, Turner, Marshall, Connolley and Lachlan-Cope2004, Turner et al. Reference Turner, Colwell, Marshall, Lachlan-Cope, Carleton, Jones, Lagun, Reid and Lagovkina2005). Although climatological evidence shows that the main increase in average temperature in the northern Antarctic Peninsula has been in winter (Turner et al. Reference Turner, Colwell, Marshall, Lachlan-Cope, Carleton, Jones, Lagun, Reid and Lagovkina2005), the system still remains frozen during that season. However, similarly to what is happening to the Northern Hemisphere permafrost (Michel & Van Everdingen Reference Michel and van Everdingen1994), temperature rises during summer are leading to noticeable effects such as an activation of the hydrological cycle and a marked increase in water flow from inland to the ocean. Many studies of both the flow mechanisms and the chemical composition of inland waters have covered several Northern Hemisphere zones (e.g. Kane & Yang Reference Kane and Yang2004, Woo et al. Reference Woo, Kane, Carey and Yang2008). Similar investigations in Antarctica have focused in areas far away from the Antarctic Peninsula such as the Dry Valleys (Caulkett & Ellis-Evans Reference Caulkett and Ellis-Evans1997).
Studies that take into account groundwater are fewer than those on streams, rivers or lakes and are mostly focused within the Antarctic continental areas (Hofstee et al. Reference Hofstee, Dave, Campbell and Aislabie2006), although spring and groundwater contribution to streamflow have been studied (Woo et al. Reference Woo, Kane, Carey and Yang2008). Groundwater is usually investigated as a means of transport or sink of pollutants (Snape et al. Reference Snape, Riddle, Stark, Cole, King, Duquesne and Gore2001) or nutrients (Kaup & Burgess Reference Kaup and Burgess2002). Its characterization as a component of the hydrological cycle tends to be a secondary objective, so it is difficult to find works that present an integrated study of the interaction between rivers, lakes and groundwater. There is Arctic research (e.g. Woo et al. Reference Woo, Kane, Carey and Yang2008) focusing on geochemical characterization of river water to identify groundwater contributions. However, most is related to either sub-permafrost flow or thermal and saline springs. These Northern Hemisphere hydrological systems are much more complex than the studied system in Vega Island and their nature and genesis are also very different. In Vega Island groundwater flow seems to be limited to the active layer during summer and ceases in winter.
There are other reasons for studying the composition and interrelation of different surface waters in the Antarctic Peninsula region: i) waters of the Antarctic Peninsula are located far from inhabited or industrial areas, generally taken to be in pristine condition and can be used as a baseline for natural composition not influenced by man (Bargagli Reference Bargagli2000), ii) taking into account that liquid water is critical in the development of biological activity and soil formation, in Antarctic coastal regions, such as the area of Cape Lamb, liquid water can exist during a part of the year, so there exists a potential for flora and fauna development, as well as for the existence of relatively developed soils (Rudolph Reference Rudolph1963, Hofstee et al. Reference Hofstee, Dave, Campbell and Aislabie2006), and iii) it is expected that waters in the northern Antarctic Peninsula region will show different characteristics than waters of more southern latitudes.
The climate of the north-east region of the Antarctic Peninsula is subpolar semiarid, with mean annual temperatures ranging between -5°C and -10°C depending on the zone. Mean summer temperatures are usually between 2°C and -2.5°C, whereas mean winter temperatures range between -12°C and -17°C (Reynolds Reference Reynolds1981). Data collected at Esperanza meteorological station (63°23′54′′S, 56°59′46′′W) show a rate of temperature rise of 0.41°C per decade (Turner et al. Reference Turner, Colwell, Marshall, Lachlan-Cope, Carleton, Jones, Lagun, Reid and Lagovkina2005). Prevailing winds are from the south and the south-west, although at times strong katabatic winds, which are dry and less cold, are reported from the WNW sector. There are differences of up to 5°C in the mean annual temperatures of the western and eastern sectors of the Antarctic Peninsula, with the coldest in the west (Reynolds Reference Reynolds1981). Mean annual precipitation is about 250 mm (c. 80% snow and 20% rain). The climate of the surrounding islands is warmer than in the Antarctic Peninsula. It is characterized by a relatively warm summer, which lasts between one and four months, with daily mean temperatures exceeding 0°C (Smith Reference Smith1984) and snowfall and rain that can exceed 400 mm y-1 (Greenfield Reference Greenfield1992). This allows surface and underground drainage systems to develop to a greater or lesser degree, causing an intense movement of solutes and sediments towards the sea. In Cape Lamb, as happens elsewhere in the Maritime Antarctic, a significant amount of snow accumulates during winter. This gives rise to high discharges in streams when snow melts during the first weeks of summer. When the snow cover has completely disappeared, the flow from the active layer and the melting of the upper ice-rich permafrost are the only sources that feed the rivers through the saturated zone.
Linked to the development of the active layer, a subsurface (active layer) flow system develops that can be more or less connected to the surface flow system (streams) (French Reference French2007). During summer the active layer stores liquid water that can join the general flow. This is particularly evident in areas where permafrost constitutes an impermeable layer, as demonstrated in other polar areas (Woo & Carey Reference Woo and Carey1998). In relatively warm years, the depth of the active layer increases so much that springs cease flowing and surface water flow disappears. A notable feature of the stream flow in the study area is the daily and even hourly flow variability. This variability is conditioned by the following main factors: air temperature, amount of insolation and rainfall. The discharges become much more stable once the snow cover has disappeared.
In sub-Arctic regions three types of aquifers can be distinguished (French Reference French2007), which depend on their position relative to the permafrost: supra-permafrost aquifers which are developed with permafrost as the impermeable base, intra-permafrost aquifers that are developed in the frozen soil, and infra-permafrost aquifers below the frozen layer, usually at great depth, where water remains unfrozen due to the geothermal gradient or high salinity. Supra-permafrost aquifers in Antarctic environments can be considered seasonal systems, because they are inactive most of the year when water is frozen and does not flow. The structure of aquifers developed above the permafrost depends on climatic conditions, contrary to what happens in temperate zones, because the location of the top or bottom of the aquifer depends on the thickness of the active layer. The main objective of this paper is to study the summer hydrological regime in a continuous permafrost region (Cape Lamb) through interpretation of geochemical and isotopic data.
Study area
The study area (Figs 1 & 2) is the western sector of Cape Lamb (63°52′15′′S, 57°34′37′′W) on Vega Island, northern Antarctic Peninsula. With a surface of c. 25 km2, this is the largest ice-free area on Vega Island, which is the second largest island of the James Ross archipelago. The island has an elongated shape and is oriented east–west (Fig. 3), with 80% of the surface covered with ice. It has steep relief with a maximum elevation of 630 m above sea level (a.s.l.). Cape Lamb is located in the south-west of the island and its maximum elevation is 482 m a.s.l. The north–south oriented ‘Cape Lamb Crest’ (unofficial name) is the main water divide, with east or south-west oriented drainage basins and overall elongate geometry (Fig. 3). Streams at Cape Lamb are shallow, rarely reaching a water depth of 0.25 m and carrying large amounts of sediments (clay and silt). Floods, and changes of course and catchments due to fluvial erosion during summer are very common.

Fig. 1 Location of the study area. a. Antarctica. b. Northern Antarctic Peninsula region. c. Cape Lamb, Vega Island and James Ross archipelago.
Drainage networks at Cape Lamb are the product of a very young landscape dominated by the action of glacial erosion and processes related to the permafrost dynamics. The area is characterized by the presence of continuous ice-cemented permafrost (Ermolin et al. Reference Ermolin, De Angelis and Skvarca2002). According to observations in dragged pits, the thickness of the active layer is from 50 cm to more than 100 cm. No data about permafrost thickness are available. Periglacial processes and related features are common on ice-free areas of the James Ross archipelago. A wide range of periglacial landforms have been identified (e.g. Ermolin et al. Reference Ermolin, De Angelis and Skvarca2002). Freeze-thaw weathering is an active process due to the temperature range and the water availability in summer. Patterned ground forms are common, with the presence of sorted circles and polygons on flat areas and sorted stripes on slopes, and where solifluction is an active process (Mori et al. Reference Mori, Fukui, Sone, Strelin and Torielli2007).
Cape Lamb streams are characterized by being active only during summer, draining to the Weddell Sea. Additionally water flow, depending on weather conditions, varies significantly during the season and even during the same day. Discharge measured varies between 1 and 5 l s-1, some streams being dry in late summer. Streams with mixed contribution from combined permafrost and glacial ablation have higher flow rates (30–40 l s-1). During summer the active layer develops a supra-permafrost aquifer that is widely connected with the superficial system. Thus, at the beginning of summer the superficial system is fed by accumulated winter snow melting. As the warm season progresses the superficial system is also fed by water from the melting of the active layer. By the end of summer these latter water sources are the most important and often the only ones. Nine ponds and lakes of different origin and typology have been sampled in the study area. Three types of lakes can be differentiated: those associated with thermokarst on lateral moraines (L8, L7, L9), those developed on older moraines separate from the glacier (L4, L5, L6) and those associated with Holocene deposits located at higher altitude and surrounded by aeolian deposits (L1, L2, L3) (Fig. 3).
The outcrops at Cape Lamb consist of Cretaceous–Miocene sediments and volcanic rocks (Rinaldi Reference Rinaldi1982, Pirrie et al. Reference Pirrie, Crame and Riding1991). There are large Quaternary deposits of glacial origin corresponding to middle to distal deltaic facies, with proximal facies that also exist to the east (Lirio et al. unpublished data). In general the glacial deposits (drumlins and lateral moraines disconnected from glaciers) have essentially a fine silty–sandy texture and may be interspersed with some poorly sorted thicker gravel deposits. Glacial deposits mainly consist of reworked material from the Cretaceous outcrops with a proportion of Cenozoic volcanic elements. Recent lateral moraines to the east and west of Cape Lamb consist of coarse material, generally poorly sorted gravel, with sandy–silty matrix and of volcanic origin. The fluvio-glacial deposits, subglacial deposits, and even the alluvial deposits generated by the runoff of the watercourses are mainly composed of fine sands interspersed with medium sands and with a large share of clayey silt material. In Cape Lamb the first two mentioned deposits seem to be interdigitated laterally with the terminal moraine. The alluvial deposits are similar to those described above but are genetically fluvial and show clearly visible filling channels.
Materials and methods
A total of 51 water samples from groundwater, rivers, lakes, snow and ice representing eight surface watersheds were collected during January and February 2007. Sampling localities and their nomenclature are shown in Fig. 3. Although 24 basins are represented on the map, water circulation was observed only in eight of them (Fig. 3). Sampling was focused on the western Cape Lamb slope, although two samples were taken on the east slope. Whenever possible, representative samples from the upper, middle and lower reaches of each basin were taken. The sampling campaign was aimed to collect water and ice samples that represent all possible sources of water. All the streams in the study area were systematically explored on foot from the mouth to the source. Electrical conductivity of water was monitored along the stream and water samples were collected when changes over 20% in electrical conductivity were measured. Additionally, all the accessible lakes were sampled.
Groundwater samples were obtained through manual digging of pits to reach the bottom of the active layer (Fig. 2). Groundwater samples were taken after waiting long enough, c. 5–10 min, for the water to reach the phreatic level. All groundwater samples were taken at similar depths: between 45 and 55 cm below the soil surface. It was observed that the thickness of the saturated zone was always very similar, between 5 and 10 cm, which is in the same range of thickness as observed by Hofstee et al. (Reference Hofstee, Dave, Campbell and Aislabie2006) at Cape Hallett (72°19′S, 170°16′E).

Fig. 2 Geomorphological and soil features in Cape Lamb. a. General view. b. L5 lake and surrounding area. c. Dredged pit in the active layer for soil and water sampling, the top of permafrost is visible in the pit bottom. d. Buried ice. e. Aeolian sand deposit.
Five ice samples were taken: IB, IC, ID, IE and IF (Fig. 3). Sample IB was taken on the base of a snowfield and seemed to come from snow turned into ice. Sample IC represents the masses of buried ice (ice formed or deposited on the ground surface and later incorporated into the ground through burial processes) mixed with sediments frequently found in the study area, especially on steep slopes (Fig. 2). These ice masses seemed to be glacier remains. In many cases buried ice was not seen but its presence was detected due to the appearance on the soil surface, especially on slopes, or the presence of melting water. Sample ID is infiltration ice and was collected on a slope close to sample IC. Sample IE, collected from the ceiling of a small cavity on the upper reach of B5 basin, appeared to be condensation ice. Sample IF was taken on an ice cave on the upper reach of stream B3. All ice samples were collected by cutting chunks from the ice masses either directly or after digging a pit.
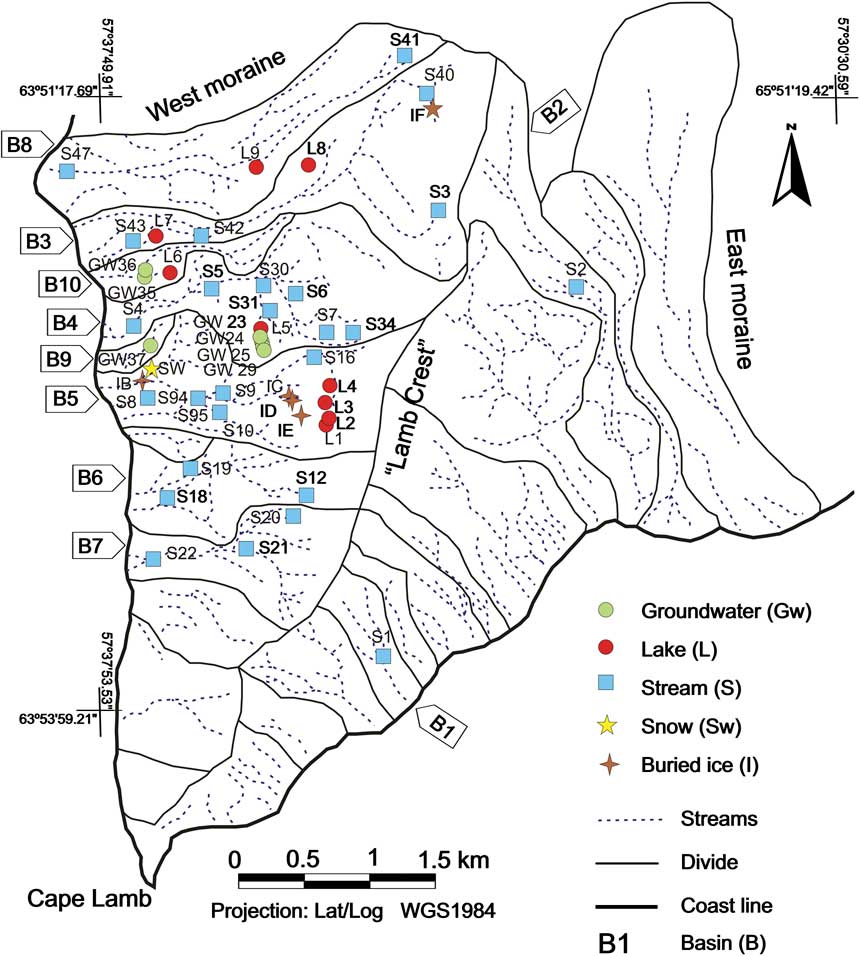
Fig. 3 Cape Lamb drainage basins and sample localities.
Water samples were collected in polyethylene bottles prewashed three times with the same sampling water before filling up to the brim. In the case of streams special care was taken to decant the abundant sediment occasionally dragged up by the current. The samples of ice and snow were left to defrost in a closed container to prevent evaporation, and thereafter, they were homogenized and bottled. No chemical conservatives were added to the samples. The samples were stored under controlled conditions kept at temperatures of 4°C ± 2°C until the analysis was carried out, making sure that they did not freeze.
Measurement of electrical conductivity (E.C.), temperature, pH and alkalinity of water were performed in situ. Determinations were carried out directly on liquid samples (surface water and groundwater), whereas solid samples (ice and snow) were previously allowed to thaw in a closed container. The E.C. was determined by a WTW conductivity meter with glass cell, the pH with a WTW 320 pH-meter and alkalinity with a Hach titrator kit (Test Kit model AL-DT). Due to the presence of suspended sediments many of the samples from rivers, and even some from the ice, were filtered through a Millipore nitrocellulose filter of 0.45 μm prior to chemical analysis. Analysis procedures for the laboratory determinations were: pH by electrometry, anions and cations by absorption spectrophotometry, heavy metals were determined by mass spectrometry with inductively coupled plasma, and with the exception of iron, which was determined by inductively coupled plasma atomic emission spectroscopy.
Sampling conditions (lack of snow and relatively high temperatures) were suitable to ensure good representation of groundwater dynamics, and therefore the relation between surface water and groundwater. In addition, sampling at the end of summer made it possible to establish the characteristics of the maximum flow of nutrients (Kaup & Burgess Reference Kaup and Burgess2002). The nutrient content of groundwater is greatest at this time for three reasons: the active layer is at its maximum thaw, trapped brines are released, and the contribution of water from snow melting is minimal (Kaup & Burgess Reference Kaup and Burgess2002). All waters sampled at Cape Lamb come from surface flow or from a supra-permafrost aquifer. Deep flow only appears at the surface (icing) and produces mixed waters in the case of an open talik (French Reference French2007), but the permafrost generally prevents such phenomena acting as an impermeable layer. However, connection is possible between deep water and open taliks resulting from the presence of large liquid surface water bodies such as lakes or the sea. Chemical and mineralogical analyses were performed at the Geological Survey of Spain (IGME), and stable isotopic analyses were carried out in the laboratories of the Universidad Autonoma de Madrid. Simultaneously with the sampling of water, 12 samples of the solid matrix of the soil (active layer) were taken and two of saline-looking materials that were commonly observed in the vicinity of many of the streams. Solid samples were taken in order to characterize the material which the water was in contact with. The following parameters were determined in the solid matrix: mineralogy of sands and clays, carbonate content, organic matter (OM), cation exchange capacity (CEC), exchangeable cations (Ca2+, Mg2+, Na+ and K+), CaCO3, E.C. and pH. All the analyses were performed following the analytical methods recommended by ISRIC (International Soil Reference and Information Centre) (Van Reeuwijk Reference Van Reeuwijk2002). Samples from ANT7–ANT19 (Table I) correspond to the sediments collected in the vicinity of L5 lake (Fig. 3) when groundwater sampling wells were excavated. Two samples were taken in each well, one at 0–5 cm depth and one at the bottom of the well (about 50 cm depth). The rest of the samples correspond to sediment taken in the area between 0 and 5 cm depth.
Table I Chemical characteristics of the soil solid matrix for Cape Lamb.

%OM = % organic matter, CEC = cation exchange capacity, E.C. = electrical conductivity soil water 1:1 suspension (μS cm-1).
The basin boundaries as well as the course of the streams and watersheds were established using the topographic map of the area (Marenssi et al. Reference Marenssi, Salani and Santillana2001) together with a satellite image (Landsat 7 ETM+ 02/21/2000 georeferenced in UTM zone 21 WGS1984) and the use of a GPS in the field.
To facilitate the interpretation of the analytical results, the SO4/Cl ratio and the sulfate enrichment factor EFSO4 were calculated according to the expression (De Mora et al. Reference De Mora, Whitehead and Gregory1991): EFSO4 = (SO4/Cl)sample/(SO4/Cl)seawater.
Analytical results
The results for parameters related to the solid matrix of soil (%OM, CEC, exchangeable cations, %HCO3, E.C. and pH) are shown in Table I. Table II shows the results of the mineralogical and textural analyses. The results from water analyses expressed in mg l-1 are presented in Tables III & IV. Tables and figures include the number and type of sample: stream (S), lake (L), snow (SW), ice (I) or groundwater (GW). Basins are represented with the letter B and a number (see Fig. 3).
Table II Mineralogical analysis of the clay fraction of the soil solid matrix for Cape Lamb.
Q = quartz, Ab = albite, Or = orthoclase feldspar, Mc = microcline, Sa = sanidine, An = anorthoclase feldspar, Gy = gypsum, Ja = jarosite, Hu = huelandite, Ri = riebeckite, Es = smectite, Ms = muscovite, Bt = biotite, CMM = clay main mineral, CSM = clay secondary mineral.
Table III Chemical composition of water from Cape Lamb's lakes, ice, groundwater and snow.

L5 studied at different depths. L = lake, I = ice, GW = groundwater, SW = snow, bdl = below the detection limit.
Table IV Chemical composition of water from Cape Lamb's streams.

S = stream, bdl = below the detection limit.
Solid matrix characteristics
The solid matrix at Cape Lamb is composed of clay loam or sandy loam sediments, as is shown by the results of textural analyses (Fig. 4). Samples’ texture is relatively homogeneous, as the proportions of the different size fractions are within a narrow range as shown on Fig. 4. In general the fine fraction silt and clay is dominant. However, there was a high content of sand in some samples, which reaches 61.4% in ANT19 (Fig. 4). The analysed sediments contain between 38% and 57% of quartz as well as varying amounts of albite, orthoclase and microcline, generally between 10% and 15%. Samples taken in the vicinity of streams S6 and S4 (a grey material is relatively abundant) show a gypsum content of 2% and 5% respectively. Two samples confirmed the presence of jarosite (4%), heulandite (4%), and riebeckite (3%). In the clay fraction, the most abundant minerals are smectite and muscovite. Biotite was found in only one sample, although as an accessory mineral.

Fig. 4 Diagram showing the results of the active layer textural analysis.
It is noteworthy that 11 out of the 14 sediment samples analysed have strongly acidic pH with most of them in the range between 4.00 and 4.60 units. The pH values of the samples that are not acidic (ANT19 and ANT20) are 7.51 and 7.84 respectively. The carbonate contents are very low, between a minimum of 0.5% corresponding to samples ANT1 and ANT2 and a maximum of 3.8% in sample ANT19. Organic matter contents were mostly less than 0.25%. In one isolated sample (ANT13) more than 1% content in OM was observed. Cation exchange capacity was low and fairly constant in all samples, varying between 31 and 53 meq (100 g)-1. The exchange complex was mostly occupied by Ca2+ and Mg2+.
Chemical characteristics of the snow
Snow samples were taken following the first snowfall (12 February 2007) at the end of the surface water and groundwater sampling campaign. Three samples were collected (Fig. 3), the first one (SWG) the snow at the beginning of the snowfall and the other two samples (SW38 and SW39) corresponding to fallen snow at the end of the snowfall the next day. Snow samples are notable in having relatively high E.C. values (6 μS cm-1, 47 μS cm-1 and 84 μS cm-1 respectively) and pH variability (pH 7.9 for sample SWG and between 6.31 and 6.10 for samples SW38 and SW39 respectively). The ionic composition shows a clear predominance of Na+ among cations and Cl- among anions. Contents in all the major species are high, for example, there are SO42+ contents of 5 mg l-1 and 11 mg l-1 in samples SW38 and SW39 respectively, and Ca2+ concentrations of 3 mg l-1 in both samples. On the other hand, very high concentrations of iron and manganese (1700 μg l-1 and 29.3 μg l-1 respectively) were found in the sample SW38. Nitrate and phosphorus were below the detection limit in all the snow samples.
Groundwater
Groundwater was classified into four groups depending on sampling site. The first group comprises of four samples (GW23, GW24, GW25 and GW29) collected in the vicinity of L5 lake. These samples were taken along a perpendicular transect to the lake oriented east–west at 1, 12, 18 and 26 m away from the lake shore. The altitude difference between the three sampling points was small, in the order of decimetres. Samples of this first group are characterized by the absence of HCO3- in their composition. These are also the most acidic samples collected at Cape Lamb, with a pH between 3.7 and 4.25 that is higher when the sample is located closer to the lake. Their electrical conductivity is very high, between 4804 μS cm-1 in sample GW29 and 7134 μS cm-1 in sample GW23 (also increasing towards the lake). There was also a notable increase in the SO42-/Cl- ratio where the sampling location is further away from the lake, changing from 0.33 on the edge to 11.17 at a distance of only 26 m. The cationic content varies in a similar way to that of the anionic content, sodium content is greater closer to the lake, whereas calcium content increases at a greater distance from it. Small amounts of nitrate, 1–2 mg l-1 NO3-, were detected in all samples. Phosphorus concentrations, between 0.13 and 0.15 mg l-1, as P2O5, were found in samples further away. The sample GW23, the closest to the lake, shows the highest contents of dissolved salts and is also the most chlorinated.
A second group of samples collected in the B10 basin (GW35 and GW36) were taken in a depression seasonally fed by water from snow melt, and occasionally by the overflow of L6 lake. Samples were separated a distance of 15 m. There are two features that distinguish them from the rest of the waters: their high HCO3- contents with respect to the typical values in the work area (160 and 73 mg l-1 respectively) and the high NO3- concentration in GW36 (19 mg l-1). Both samples have similar chemical facies, sodium-magnesium chlorides and calcium magnesium chlorides (Fig. 5). Their pH values were also similar, 6.57 and 6.55 respectively, but while sample GW35 has an E.C. of 1392 μS cm-1, the E.C. of the sample GW36 was much higher: 4458 μS cm-1. The SO42-/Cl- ratio was below 1, 0.46 and 0.26 respectively.

Fig. 5 Piper diagram showing the chemical composition of the water samples.
The third group consists of sample GW37, which was taken in the basin of the S9 stream. This sample has a very low SO42-/Cl- ratio: 0.15, in addition its content in HCO3- is 55 mg l-1 and the E.C. 2864 μS cm-1. It has a sodium chloride chemical facies and differs from others by its high K+ content: 29 mg l-1.
Interestingly, there is a clear difference in SO42- content between groups: samples of the first group have very high contents with a range between 680 and 2570 mg l-1, whereas those of the second group are much lower with a range between 125 and 328 mg l-1. The SO42-/Cl- ratio was always below 0.5 in the second group whereas in the first group it is well above the unit in all but one of the samples (GW23). Differences are also observed in pH, group 1 is more acidic than group 2. Dissolved phosphorus was found in three groundwater samples (GW25, GW29 and GW37) with concentrations between 0.07 and 0.14 mg l-1. In relation to nitrate contents, very low concentrations were measured, generally around 1 or 2 mg l-1, except for sample GW37, featuring 7 mg l-1, and above all of them sample GW36 with the highest NO3- content of 19 mg l-1.
Finally, GW30 and GW31 samples are a special case. They were taken from two springs located in the upper B4 basin. Although they were not sampled by digging a pit, they are included in the groundwater group rather than the surface group as they were springs sampled directly from groundwater drainage. Chemically they are acidic waters, with pH of 4.71 and 4.56 respectively: sodium-calcium sulfated chemical facies, and low but appreciable HCO3- content (33 and 25 mg l-1). The SO42-/Cl- ratio was high at 3.38 and 1.80 respectively. They had low NO3- contents (2 and 3 mg l-1) and phosphorus content was below the detection limit.
Streams
A total of 25 water samples were collected from eight streams. Table IV shows the analytical results and the enrichment factor (EF) in SO42- (EFSO4). Samples from the streams present a high variability in their chemical composition and show significant differences from one stream to another, and even along the course of the same stream. In general, dominant anionic chemical facies are sulfate or chloride sulfate and cationic chemical facies are sodium or calcium sodium (see Fig. 5). All streams, except for S47 with a pH of 7.15, had acidic or very acidic pH. S20 was the most acidic of all, showing a pH of 3.97 (upper B7 basin). The most common pH values were between 6.0 and 6.9 units (Table IV).
Electrical conductivities were high and with a clear tendency to increase towards the mouth of the rivers. The maximum E.C. was 6414 μS cm-1 in the S18 stream and the minimum 441 μS cm-1 in the S47 stream. There was a clear correlation between E.C. and SO42- content (r 2 = 0.96). However, a correlation does not occur with the Cl- content (r 2 = 0.39). The HCO3- content was very low. None of the samples exceeded 75 mg of HCO3-, and in the four more acidic samples (S3, S20, S21 and S22) the HCO3- content is below the detection limit. Generally, SO42- was the most abundant anion in stream water. It dominates over Cl- in 20 of the 25 samples. The SO42- was also the anion which presented the greatest range of variation between 41 mg l-1 in sample S2 and 2.680 mg l-1 in S18, corresponding respectively to the middle upper B2 basin and the lower B6 basin. In general, SO42- content increases in streams as they approach the sea. However, there are exceptions and in the same basin, high contents can be found in the upper reaches of streams. This is the case of S3 (1350 mg l-1), S20 (2240 mg l-1), and S19 (2550 mg l-1) samples. The Cl- was much less abundant than SO42-, and its concentration was also less variable, between 97 mg l-1 and 540 mg l-1, although in most of the samples, 18 out of 25, Cl- concentrations are between 100 and 300 mg l-1. Like the SO42-, the Cl- tendency was to increase towards the river mouth. Surprisingly, a low correlation (r 2 = 0.29) was found between the Cl- content and Na+ content. Values of EFSO4 were very high in all the streams, and no relation was observed between EFSO4 and the stretch of the river in which the sample was taken. The NO3 content was very low and no sample exceeds 4 mg l-1. Phosphorus contents were always below the detection limit except in one sample (S47, 0.21 mg l-1).
Lakes
Lake water samples were classified into three groups based on dissolved salt content. The first group correspond to three lakes with a low content in dissolved salts: L2 (129 μS cm-1), L8 (183 μS cm-1) and L9 (211 μS cm-1). In this group there is also a clear difference between the three mentioned lakes. On one hand, lakes L8 and L9 are the only surface water samples with pH values above neutrality (7.41 and 7.23 respectively). Also, their chlorinated bicarbonate chemical facies (Fig. 5) is rare at Cape Lamb. The SO4/Cl- ionic ratio in L8 and L9 is below 1 (0.59 and 0.63 respectively). These values are among the lowest in surface waters. On the other hand, L2 had a very low salt content but its sodium chloride chemical facies resembled lakes with higher dissolved salt contents. The pH was acidic (6.01) and it had significant contents of nitrate (4 mg l-1) and phosphorus (0.17 mg l-1). All samples from lakes of this group share the cationic sodium chemical facies and low Ca2+ and Mg2+ content.
A second group includes two lakes with a medium dissolved salt content, with E.C. varying between 610 μS cm-1 in L6 lake and 776 μS cm-1 in L7 lake. This group has a slightly acid pH, between 6.35 and 6.44, sodium chloride chemical facies and low SO42-/Cl- ion ratios (0.09 and 0.14 respectively). Waters in L6 and L7 are the only ones in Cape Lamb with EFSO4 values that do not exceed 1 (1.0 and 0.6 respectively). They contain small amounts of NO3- (1–2 mg l-1), and phosphorus (0.10–0.11 mg l-1) was detected.
Finally, the third group includes samples from lakes that show a high dissolved salt content (L4, L1, L5 and L3). The E.C. of these lakes was between 1030 and 1518 μS cm-1. They share either chloride or chloride sulfated chemical facies with respect to the anions and sodium chemical facies with respect to cations. Their SO42-/Cl- ratios range between 0.86 and 2.08 and their pH are acid, especially in the L5 lake with a pH of 4.8. Although this group is characterized by high dissolved salt contents, phosphorus determinations were below the detection limit. The EFSO4 value was very high in these samples, between 6.1 in L1 and 15.5 in L2. In L5 lake (maximum depth of 6.1 m) samples were taken at the surface (0–5 cm) and at 2.7 m and 5.8 m depth. The lake water composition was constant at all depths (Table III).
Ground ice
The importance of the chemical characterization of ground ice lies in the contribution of melting ice to the streams base flow in summer once all snow is gone. The different types of ice collected are described in the Materials and methods section. All samples of ice, except for IB sample, show higher dissolved salt contents than the typical values for snow samples. The sample IB, the least saline (36 μS cm-1), shows a predominance of HCO3- anion and a slightly acid pH (6.12 units) as expected for snow. However, the EFSO4 value of 11.9 was higher than those corresponding to direct precipitation samples that range between 2.8 and 7.2. The ID sample is at the other extreme, as it showed quite unusual characteristics for a sample of ice such as a very high E.C. (2384 μS cm-1). The SO42-/Cl- ratio was also very high (12.40) and its low pH (4.4 units) was related to the absence of HCO3. Furthermore, the SO42- (906 mg l-1) and Fe (40 mg l-1) contents were also remarkably high. The IE sample also presented a very particular composition. It had a low E.C. of only 264 μS cm-1 and its dissolved salt content was almost entirely due to the presence of SO42- (82 mg l-1) among anions and Na+ and Ca2+ (24 mg l-1 and 14 mg l-1 respectively) among cations. The EFSO4 value of 117.5 was the highest of all the Cape Lamb samples. The IC and IF samples display typical features of surface waters in the area (see Table IV) such as the sodium calcium sulfated chemical facies (Fig. 5), although their E.C. (201 μS cm-1 and 95 μS cm-1 respectively) was lower than the average value. The EFSO4 of IC sample was high (32.6), whereas in the IF sample the EFSO4 was 4.6. The NO3- content in ice samples is between 0 and 2 mg l-1. On the other hand, the phosphorus content is below the limit of detection in all cases except for IC sample (0.17 mg l-1 of P2O4).
Ratio D/O18
In 16 representative water samples, with diverse origins, the concentration of deuterium and oxygen 18 was determined (Fig. 6), as well as the deuterium excess value dex (dex = δD - 8 * δ18O). The set of analysed samples was distributed along two straight lines: RA and RB. The RA line represents all waters with a value of dex > 3.3 and corresponds to the local meteoric water line (LMWL). The RB line is drawn with data from the waters that have a value of dex < 3.3. The RB slope is 4.81 and corresponds to a situation of evaporation. The eight points which form the RB line are waters that come from lakes (L2, L3, L5 and L7 lakes), groundwater taken in the vicinity of L5 lake (GW23 and GW25 samples), the upper area of the B4 basin (S30 sample) and the upper B5 basin (S16 sample). All samples analysed in Cape Lamb show very negative δD values, between -64‰ and -182.1‰, with most of them between -90‰ and -120‰. The δO18 values are also strongly negative, between -8.43 and -23.20‰. In summary, it can be said that dex is always positive in the ice and precipitation, in groundwater dex is always negative or close to zero and in streams any value can be found, from clearly positive (S41 dex = 4.4) to strongly negative (S16 dex = -7.8). Finally, the points at the ends of the LMWL are the snow samples taken at the beginning of the first snowfall of February (SWG sample) and at the end of it (SW39 sample). The differences in the value of δO18‰ and δD‰ between the two samples is 14.05 δO18‰ and 117.3 δD‰ respectively.

Fig. 6 Oxygen and hydrogen isotopic data of Cape Lamb waters.
Interpretation and discussion of results
For a proper understanding of the results it is necessary to take into account that throughout the sampling period (between 25 January and 10 February 2007) there was no precipitation, neither rain nor snow. In fact, on reaching the study area on 7 January 2007 it was found that practically all the winter snow had melted, except for small portions on the headlands. Therefore the basins were free of snow cover that could bring water to the system by direct melting. The temperature during the sampling period was high, with a maximum of 11°C.
Solid matrix of the soil
The two most important characteristics of the composition of the solid matrix of the soil are: the strongly acidic pH that is transferred to the water when is in contact with it and its low carbonate content. Both characteristics are related. The parent rock which has produced the sediments in Cape Lamb has a low content of carbonates. The high acidity of the soil and water made it difficult to bring about the dissolution of atmospheric CO2 and its reaction with the soil minerals to form carbonates (Appello & Postma Reference Appello and Postma2005). In turn, high acidity of water and sediment samples can be explained by the volcanic origin of the sediments and the oxidation of contained sulfides (Ward Reference Ward2004). The oxidation of sulfides is a process that generates a strong level of acidity. The abundant presence of jarosite in sediments in the study area, as shown above, seems to confirm these claims, where jarosite is an iron and potassium sulfate characteristic of the oxidation of sulfides. When the soil becomes acid enough and there is no limit on the availability of oxygen, the oxidation of sulfides is accelerated. The shortage of CaCO3 has the same effect (Ward Reference Ward2004). Both conditions occur in Cape Lamb.
However, gypsum was found in two of the 14 studied samples. Although SO42- was the dominant anion both in groundwater and surface water, the dominant cation was not Ca2+ but Na+. The second most abundant mineral in the solid matrix after quartz was albite. This is the most sodic member of the plagioclase series and during its weathering in acid environments Na+ is released, so that the predominance of Na+ among cations even in water without marine influence is justified. Thus, all the generated sulfate is practically in dissolution. The expected evolution of the system is the draining of the groundwater followed by replacement with new water from precipitation and snowmelt. This process will produce a decrease in the content of dissolved salts of streams and aquifers. This should be checked with successive sampling campaigns, although it seems to be a process that is already taking place in the B9 stream where groundwater has less mineralization.
The relatively high OM content in some samples is related to the presence in large parts of the study area of well developed communities of moss (Polytrichum sp.), as in other parts of Antarctica the moss communities are coincident with slight ground depressions where liquid water accumulates in summer (Broady & Weinstein Reference Broady and Weinstein1998).
Snow
Some authors consider that in Antarctica most of the solutes deposited by snowfall come from sea aerosol (e.g. Benassai et al. Reference Benassai, Becagli, Gragnani, Magand, Proposito, Fattori, Traversi and Udsi2005) and this contribution is proportional to the proximity to the sea and lower altitude. Comparing data from Cape Lamb with those of Bertler et al. (Reference Bertler, Mayewski and Aristarain2005) for a large dataset in Antarctica, in Cape Lamb the major ions content in the snow is clearly among the highest. This happens particularly in the case of SO42- that according to Bertler et al. (Reference Bertler, Mayewski and Aristarain2005) does not exceed 3800 ppb in Antarctic samples, but in Cape Lamb reaches 5000 ppb in sample SW38 and 11 000 ppb in sample SW39. The same applies to Ca2+ that according to Bertler's data has a maximum of 740 ppb but in Cape Lamb two of the samples reach 3000 ppb. Our data show that the influence of marine aerosol in the composition of Cape Lamb snow is limited, contrary to expectations (Bertler et al. Reference Bertler, Mayewski and Aristarain2005), and that the chemical composition of introduced dust, either from nearby James Ross Island or from Vega Island itself predominates. This also explains anomalous concentrations of SO42- and Ca2+, and why the ratio SO42-/Cl- (1.00 and 0.39 for samples SW38 and SW39 respectively) is much higher than the typical values of seawater (around 0.1). In a similar way, although with an opposite sense, the Cl-/Na+ ratio takes a value close to 1.8 in seawater (Warneck Reference Warneck1991) whereas in the Cape Lamb samples it is 1.1 and 1.44. The observed pH was below pH equilibrium with atmospheric CO2 (Appelo & Postma 2005) and, as discussed in the previous section, this acidity was not neutralized when water is in contact with soil. The only consistent explanation for the high iron and manganese contents observed in SW38 and SWG samples is to attribute these values to pollution by wind-blown dust. The high values of EFSO4 found for snow, 7.2 and 2.8 units, supports this interpretation, as snowfall affected by marine aerosols should maintain a sulfate ratio similar to seawater (Aristarain & Delmas Reference Aristarain and Delmas2002). A similar rationalization (De Mora et al. Reference De Mora, Whitehead and Gregory1991) was postulated by other authors to explain composition deviations from that expected in waters of the Antarctic environment.
According to the literature (Kreutz & Mayewski Reference Kreutz and Mayewski1999, Bertler et al. Reference Bertler, Mayewski and Aristarain2005), snow composition in the Antarctic environment depends primarily on three factors: distance to the sea, topographic altitude and rate of accumulation. The snow samples taken at Cape Lamb were very close to the coast, about 300 m, and at a low altitude (15 m a.s.l.) and no snow had accumulated. In this area it is necessary to introduce a new variable which is the amount of dust deposited on the snow along with the snowfall itself. Sometimes, particularly in summer, strong winds can sweep snow cover away leaving almost all Cape Lamb area free of snow. It is noteworthy to mention that in Cape Lamb wind action is evident and accumulations of sand as present-day aeolian deposits were observed (see Fig. 2).
Groundwater
Sampling took place during a “hot” summer under which conditions, the lake water, the water contained in the associated talik and water from the saturated zone of the active layer near the lake formed a continuum. Depending on the relative levels of the lake and the phreatic surface of the supra-permafrost aquifer, the aquifer can be fed or drained: fed when the lake level is high and drained when it is low. Groundwater samples taken near L5 lake have a strong concentration gradient decreasing when moving away from the lake. The gradient appears to be inverted from what is expected for all measured parameters except for the pH and the ratio of stable isotopes of water.
In early summer, L5 lake is fed by snow melt, increasing its level and producing flow towards the supra-permafrost aquifer. At the end of summer, if evaporation was sufficient, the level of the lake drops, reversing the flow and draining the aquifer. In this model, the influence of the lake on the composition of groundwater can be large in the vicinity, but will decrease with distance. During summer when sampling was carried out, the water flow was likely to consist of evaporative transfer from the lake into the atmosphere compensated by water flow from the supra-permafrost aquifer to the lake.
The isotopic composition data (Fig. 6) are consistent with the supra-permafrost aquifer flow into the lake. The waters of the lake are more separate from the LMWL (dex = -8.2) because of evaporation processes and, farther from the lake, groundwater samples converge on the LMWL until the furthest sample takes positive values (dex = 0.7). However, the behaviour of the E.C. is contrary to the expected. A groundwater sample taken next to the lake (GW23) shows an E.C. value of 7134 mS cm-1, the highest of all chlorinated Cape Lamb's samples, and this value decreases to 4804 μS cm-1 in the farthest sample, GW29. A similar behaviour is shown by the cations (Na+, Mg2+, Ca2+ and K+). In fact, the flow of water between the L5 lake and the supra-permafrost aquifer, contrary to that proposed above, does not appear to exist. If groundwater flowed into the lake, this would present a much higher dissolved salts content and, conversely, if the lake drained to the inland, groundwater would be less mineralized.
The springs in which GW31 and GW30 samples were taken, due to their position, could act as underground drains of L5 lake showing that there was hydrological continuity with the lake. However, their water composition was different to L5. In this case, L5 shows chloride sulfated calcium magnesium chemical facies, whereas GW31 and GW30 samples were sodium sulfated, the E.C. in L5 water is less than half of that observed in the springs. Finally, stable isotope analysis confirms the disconnection (Fig. 6) between the springs and L5: the strongly evaporated water of the lake differs from the global meteoric water line (GMWL), while the waters of the springs conform substantially to the GMWL. The fact that L5 lake is disconnected from the flow system is relevant. L5 is a relatively deep lake with a depth of 6.1 m at the depocentre, and logically should have an associated talik (Silva-Busso et al. Reference Silva-Busso, Moreno, Durán, Ermolin, López-Martínez, Cuchí and Martínez-Navarrete2010). Groundwater samples from near L6 show very different characteristics to those described above as they seem to be linked to the existence of biological activity. In fact, in the vicinity, moss growth is observed that incorporates OM into the environment with signs of microbial activity to this. The presence of nitrates, moderate pH and high HCO3 content support this. Samples from near L6 have different compositions depending on the distance to the centre of the depression. The GW35 sample is located in the centre and the GW36 sample outside. The small depression forms a closed talik and operates in a similar way to the L5 lake, but on a much smaller scale: the water accumulates in the talik and is evaporated, increasing the salt content. The important difference is that L6 lake is much shallower than L5. This allows the development of mosses and lichens in its bed when the lake dries and provides the soil with OM. As a consequence of the breadth of microorganisms that decompose this OM, the CO2 content of the medium increases. It is evident that further away from the lake shore, the water has the characteristics of supra-permafrost water.
The EFSO4 values in groundwater reach values as high as 80 in the GW29 sample and 62.6 in the GW24 sample. Groundwater lacks a marine aerosol signal and the predominant influence comes from the interaction with the solid matrix of the ground. The GW37 sample, from the B9 basin, is probably the exception to the rule with EFSO4 value of 1.1 and sodium chloride chemical facies. Figure 3 shows that B9 is a very small basin that was inactive. This was also the case for the B10 basin. There was no surface flow to the sea at the time of sampling, and it seems that these basins drained completely in a very short time and recharge water was from snow melting. This suggests that groundwater (GW35, GW36 and GW37) may not be associated with any of the groups described above. They are characterized by having a lower E.C., lower SO42- content and the lowest values of EFSO4.
The water sampled in these well-drained basins with lowered soluble salts contents was also marked by interaction with the solid matrix, but with less intensity than the rest. The high K contents observed in groundwater are explained as a product of the chemical alteration of muscovite, which is relatively abundant in the finer sediments.
Streams
Topographical observations of the area show that the streams are not fed by glaciers, except for S2, which clearly drains meltwater from the west glacier. In the west the B8 basin also drains glacial waters. On the whole, the composition of stream water shows more variety than any other sampled water because of its complex origin (snowmelt, glacial water, flow from moraines, permafrost flow) together with the travel distance and the mixing of waters of different origins. Many authors (e.g. Chinn Reference Chinn1981) have reported that the water composition in Antarctic hydrological basins usually arises from a mixture of waters from different sources: glacier outflow, a very variable flux from precipitation (rain or snow) and permafrost ablation in some cases. This complexity complicates the study methodology, hydrological assessment and the relationship between water flow and climatic variables. However, in Cape Lamb the question is simplified during summer by the absence of snow on the surface and the limited influence of glaciers, so that the main source of water to streams is provided by permafrost.
A glacial origin of the S2 stream is consistent not only with the physiographic position of the river but also with its sodium chlorinated chemical facies and its EFSO4 value, the lowest of all the streams measured. The dissolved solids of the stream's water generally increases from north to south, away from the west moraine and towards the sea. This is because the closer the sample site is to the sea, the longer the water residence time is and, therefore, the longer the contact time of water with the sediments transported by the river. Moreover, as we move away from the moraine, the influence of relatively un-mineralized water drained from the glacier is lost. Authors like Caulkett & Ellis-Evans (Reference Caulkett and Ellis-Evans1997), in a comparative analysis of water samples from streams of Signy Island, South Orkney Islands, found no significant differences between waters from different basins, concluding that basin characteristics did not affect the chemistry of streams. However, this is not the case of Cape Lamb where at least three groups of basins can be distinguished according to their water streams:
1) Basins with streams fed mainly by glacial meltwater. These basins were developed over the Recent moraine (basins of the S2 and S8 streams). The water of these streams is characterized by low E.C. (564 μS cm-1 and 441 μS cm-1). Both the SO42-/Cl- ratio (0.19 and 0.44 respectively) and EFSO4 (1.8 and 4.3) are the lowest measured in water streams. The SB8 stream is the only one with a pH above neutral (7.15). These also are the only river samples with chloride anion chemical facies. This group of water shows a limited interaction with the solid matrix and at the same time a significant marine influence. This indicates that the contribution of supra-permafrost aquifer water is relatively low in these streams.
2) The B3 basin is a special case of a complex system of water mixing. Stream waters found in the upper B3 basin include S3, which corresponds to water with a very high E.C. with the source exclusively from the active layer, and S40, which is water with intermediate E.C. and sourced from both permafrost ablation and snowmelt. In the middle basin a decrease in conductivity is evident as seen in S42 sample. This conductivity decrease can only be explained if low salt content water, sourced from glacier melt, is supplied through the west moraine. From the point at which the S42 sample was taken to the stream mouth (S43 sample), both the values of E.C. and EFSO4 are doubled. This stream stretch is fed by water from the active layer, as there are no tributary streams.
3) The B1, B4, B5, B6 and B7 basins. None of these is related to west glacier water flow and snow was not observed in the upper reaches of these basins. The water of these streams can only have come from drainage of the active layer. The most remarkable characteristic of this group of samples is the high E.C., which generally increases from inland to the sea. It was also observed that in general the salt content gradually increases away from the moraine. For example, in S7 and S6 streams E.C. increased to 5214 μS cm-1 and 6414 μS cm-1 respectively. The pH is always acidic with a wide variation ranging from 6.97 in the B4 basin to 3.97 in the S7 stream. Similarly to the E.C., the pH decreases away from the west moraine. The values for SO4/Cl and EFSO4 ratios are also diverse, but always showing a strong influence of interaction of water with the solid matrix. Clearly, these rates are higher where the water streams separate from the influence of the glacial meltwater or approach the permafrost water influence. The low carbonate content in this water group, null in B7 stream, is consistent with the low pH and the reactions that regulate carbonate balance (Appello & Postma Reference Appello and Postma2005).
It seems that the origin of most of the solutes transported by water streams in the area of Cape Lamb is from the interaction of water with the solid matrix of the active layer. In contrast to those found in nearby areas of Maritime Antarctica (South Orkney Islands) by Caulkett & Ellis-Evans (Reference Caulkett and Ellis-Evans1997), major cations such as Na+ and K+ come from the alteration of the solid matrix, not from the contribution of snow. The NO3- content appears to have a biological origin, probably bacterial nitrification, and it is not related to ornithogenic activity, which is insignificant on Cape Lamb.
Lakes
A notable feature of the lakes at Cape Lamb is the range in chemical composition in lakes that are geographically close and apparently subjected to the same hydrological processes. The main factors that determine the composition of lake water are: the origin of recharge water (glacier melt, snowmelt and streams), connection to other compartments, such as water supply to the lake from streams or from the aquifers, the evaporation rate and biological activity. Except for sporadic presence of birds (Catharacta antarctica Lesson and Sterna vittata Gmelin) at L6 and L5 lakes, no biological activity was observed in the lakes of Cape Lamb. It is anticipated that in deep lakes (generally more than 5 m deep), such as L5, an open talik structure develops that allows the connection of the lake with other bodies of water (Tolstikhin Reference Tolstikhin1941, Silva-Busso et al. Reference Silva-Busso, Moreno, Durán, Ermolin, López-Martínez, Cuchí and Martínez-Navarrete2010).
This connection of the lake with the groundwater system can lead to drainages located at some distance from the current location. This is the pattern that seemed to connect L5 with GW31 and GW30 sampling points, located close to the lake and at a lower elevation. However, the GW30 and GW31 samples present E.C. and EFSO4 values much higher than the lake. Additionally, the evidence of evaporation in L5 water was not observed in the GW30 and GW31 water samples. Presumably if L5 is not connected to groundwater flow, lakes of smaller areal extent and depth do not appear to be either. Obviously there must be a talik associated with each lake but its influence area is very local, of the order of metres. Returning to L5, it is observed that the lake water influence on groundwater is very local, restricted to within 4–5 m of the lake. Another notable characteristic of L5 is that it exists as an endorheic lake most of the time, except for when the water level rises high enough to overflow into the B4 basin.
From the physiographic position of L6 and L7 lakes (Fig. 3), it can be inferred that they are recharged mainly by water from the melting of the west glacier ice, after it has crossed the moraine. This is confirmed because the water of these lakes most clearly shows influence of sea aerosol together with evidence of less contact with the solid matrix. Water interaction with the solid matrix is minimal because the materials of the moraine that it crosses are very permeable and with very coarse textures. During the sampling campaign L6 covered a small area, and was only few decimetres deep due to intense evaporation.
L8 and L9 lakes are formed by thermokarst processes. They are the least mineralized lakes because they are fed directly from the west glacier meltwater. Despite their low dissolved salt content, their notable enrichments in SO42- (EFSO4 values of 4.2 and 4.5) prove that appreciable amounts of water from the melting of permafrost were added to the water from the glacier melting. There is no indication of the nature and extent of the associated talik, but the lake morphology suggests that it is deep.
L1, L2, L3 and L4 are a group of four small lakes located on the slope of the ‘Cape Lamb Crest’ at higher altitude than the rest of the lakes. Due to their physiographic position, all of them share recharge sources from both snow melting and permafrost melting. Snow seems to be the main water source for L2, according to its low dissolved salt content whereas buried ice melting seems to be a very relevant contribution, if not the main one, to the recharge in L3 and L4. All these lakes are located in low topographic positions with respect to their immediate surroundings and there were no surface drainage structures associated with them.
Ice
All ice samples contained a remarkable amount of dust which was visually evident. As chemical analyses have shown, the dust is the source of their high dissolved salt content. The original anionic chemical facies of water precipitation, which is either bicarbonate or chloride due to the influence of sea aerosol, changes to the observed sulfated chemical facies by interaction with dust. The high SO4/Cl ratio and high EFSO4, confirms the hypothesis that the ice salt content is due to dust contamination and not to the influence of sea aerosol or to the balance with atmospheric CO2. The very acidic pH in some of the samples (ID, IE) cannot be explained by means of equilibrium with the atmosphere, thus further supported by the idea of ice interaction with dust is provided. Sample ID is an extreme case in which the high SO42-/Cl- ratio along with the acid pH suggest that it is partly sourced from infiltration ice. This implies a water body that interacts strongly with the solid matrix as it infiltrates though the soil.
The composition of sample IE, which shows the highest value of EFSO4 and absence of Cl-, is easily explained by means of condensation ice. When ice sublimates, all the dissolved salts and any marine influence are left behind. When this water re-condensates, subsequent soil-water interactions determine a new water chemical facies. In summary, the IB sample corresponds to ice from the accumulated snow and the IC sample to ice buried in the old moraine, ID is infiltration ice and IE condensation ice. Finally, IF sample comes from ice taken inside an ice cave carved by the S3 stream.
D/18O and dex ratio
Figure 6 shows the δD/δ18O ratio. The Cape Lamb LMWL presents the same slope as the GMWL proposed by Craig (Reference Craig1961) δD = 8 * δ18O + 10‰ and somewhat lower than the slope for GMWL (8.17 ± 0.07) proposed by Rozanski et al. (Reference Rozanski, Araguds-Araguds and Gonfiantini1993). The strongly negative values of δ18O observed at Cape Lamb are within the range of other reported values in Antarctica (Rozanski et al. Reference Rozanski, Araguds-Araguds and Gonfiantini1993, Fernandoy et al. Reference Fernandoy, Meyer, Oerter, Wilhelms, Graf and Schwander2010). The observed results, except for the waters of the lakes, are similar to those described by Fernandoy et al. (Reference Fernandoy, Meyer, Oerter, Wilhelms, Graf and Schwander2010) in nearby areas of the Maritime Antarctic (Fildes Peninsula on King George Island and O'Higgins Station, northern Antarctic Peninsula). The studies carried out by Fernandoy et al. (Reference Fernandoy, Meyer, Oerter, Wilhelms, Graf and Schwander2010) and Uemura et al. (Reference Uemura, Matsui, Yoshimura, Motoyama and Yoshida2008), who analysed water vapour directly collected on the sea surface, have demonstrated the existence of a large variability in the deuterium excess values (dex) in coastal areas of East Antarctica. It was found that dex values fluctuate between -5% and +18% due to the mixing between marine water vapour and water vapour from continental sources. The dex value show great dispersion. In general, except sample IG whose dex is 8.4, the values are far below the world average value (dex = +10‰). The more negative values were measured in samples from lakes: L5 (dex -8.2), L2 (dex -16) and L6 (dex -18.8). In the rest of the samples the dex was between 4.4 and -7.8. These values are within the range found by other authors for samples from Antarctica (Schlosser et al. Reference Schlosser, Oerter, Masson-Delmotte and Reijmer2008).
In Cape Lamb, from the point of view of stable isotopes of water, two different groups of samples can be identified. A majority group is formed by samples with isotopic compositions that fit well to the GMWL. These samples have not undergone concentration processes by evaporation and are isotopically similar to the precipitation of the origin. A second set includes those samples with δD and δ18O values that fit a straight evaporation line, the slope of which is significantly lower than the LMWL. Most of the evaporated water samples are from the lakes: L2, L3, L5 and L7. A common feature shared by these lakes is that they are not fed by glacier water. They are endorheic lakes, fed mainly by direct snow precipitation and from a small watershed. Apart from L2 with an E.C. of 129 μS cm-1, the rest of these lakes have moderate E.C. values between 610 and 1518 μS cm-1 that are consistent with evaporation. L2 covers a very small area (about 30 m2) and is probably an ephemeral lake fed by water from snow melting and by the late summer has evaporated almost completely. The analysis of isotopic compositions on snow samples shows how in the same precipitation event the first fallen snow was significantly heavier isotopically than the fallen snow at the end of the event.
The summer hydrological cycle in Cape Lamb and conclusions
The results presented above show that in the northern Antarctic Peninsula there is a summer hydrological cycle, the particular characteristics of which are clearly reflected in the composition of surface water and groundwater. The most relevant features of this cycle are summarized below.
a) In the Cape Lamb area, supra-permafrost aquifer drainage and ice masses maintain an active surface flow network during the Antarctic summer independent of the existence of snow or the contribution of glacier meltwater.
b) Despite the proximity to the sea, a geology sourced signature prevails over any marine signature in the chemical composition of Cape Lamb waters. This is evident in groundwater but also in waters of lakes, streams and ice.
c) The concentrations of water stable isotopes, deuterium and oxygen 18, matches with those found in nearby areas by other authors. Only the highly evaporated waters of some lakes are an exception.
d) The main source of Na+ in waters of Cape Lamb are sodium silicates (mainly albite) from the soil matrix. This Na+ released from mineral weathering completely masks the possible influence of marine aerosols. Contrary to the recommended use of Na+ as a reference to determine the influence of seawater (e.g. Claridge & Campbell Reference Claridge and Campbell1977, Aristarain & Delmas Reference Aristarain and Delmas2002), not only at Cape Lamb but also in the area of Alph River (De Mora et al. Reference De Mora, Whitehead and Gregory1991) Na+ fails as an indicator of seawater influence and Cl- is preferred instead.
e) In the Cape Lamb area no evidence of infra-permafrost flow in the composition of surface waters was observed. The chemical composition of lakes and the uniformity of the chemical composition of L5 lake also seem to indicate that there is no significant flow between the lakes and the supra-permafrost aquifer.
f) The lakes are endorheic structures, only the L5 morphology suggests the existence of a hydrological connection with B4 basin during lake overflows. At the time of sampling the altitude of the surface water level of the lake was considerably below the overflow elevation.
g) Data analysis together with field observations suggest that in Cape Lamb surface water flow comes from the supra-permafrost aquifer and melting ice masses. Chemical analyses showed very variable water composition depending on the water source. Nevertheless, the contribution of ice to the solute content in stream water is difficult to quantify. The composition of the ice is highly variable depending on its origin and it is difficult to estimate the contribution of the ice to the flow of solutes. In some cases it was observed that a large amount of dust present in the ice confers a high dissolved salt content.
A final conclusion is the need to establish hydrological models for surface and groundwater systems in areas like the northern Antarctic Peninsula. This area is sensitive to warming and one way it reacts is by changing the behaviour of surface and groundwater systems. In locations such as Cape Lamb this results in an increased flow of leached solutes from inland to the sea. The consequences of this flow of nutrients needs to be evaluated.
Acknowledgements
This research has been supported by the projects: CGL2005-03256ANT and CTM2011- 26372 of the R+D Spanish National Plan, and PICTO 2005N36155, of the Secretariat for Science and Technology and the Argentinean Antarctic Institute. The fieldwork was conducted thanks to the logistic support of the Argentinean Air Force and Argentinean Antarctic Institute. The project PR20101-0166 of the National Human Resources Mobility Research 2010 (Spanish Ministry of Education) has facilitated the cooperation between the Spanish and Argentinean research teams. Authors also want to express their gratitude to the reviewers and the editor who helped to improve significantly the paper with their revision and useful remarks.


