


Introduction
Ecosystem engineers, such as epibenthic bivalves (e.g. oysters, mussels and scallops), not only support fisheries and enhance water clarity, but also increase habitat complexity, leading to increased biotic diversity (Gutiérrez et al. Reference Gutiérrez, Jones, Strayer and Iribarne2003). Environmental perturbations and climate change alter the growth of ecosystem engineers (e.g. Menge et al. Reference Menge, Chan and Lubchenco2008), which can cause cascading effects through biotic communities (Wild et al. Reference Wild, Hoegh-Guldberg, Naumann, Colombo-Pallotta, Ateweberhan and Fitt2013). The response of polar ecosystem engineers to changing environments remains unclear, as most studies have focused on temperate and tropical regions. Polar regions are particularly vulnerable to the effects of climate change (Turner et al. Reference Turner, Barrand, Bracegirdle, Convey, Hodgson and Jarvis2014), and recent studies show strong shifts in community composition in response to changing ice dynamics (Dayton et al. Reference Dayton, Jarrell, Kim, Ed Parnell, Thrush, Hammerstrom and Leichter2019, Kim et al. Reference Kim, Hammerstrom and Dayton2019); therefore, additional understanding of the growth and lifespan of these vital organisms is critical to predicting their response, and thus the response of polar ecosystems, to future environmental change.
The Antarctic scallop (Adamussium colbecki) helps structure coastal Antarctic ecosystems. Their shells are often the only hard substrate in soft-sediment environments, hosting a diverse array of biotic communities and providing major contributions of calcium carbonate biomass to the Antarctic regions where A. colbecki occurs (Cummings et al. Reference Cummings, Thrush, Norkko, Andrew, Hewitt, Funnell and Schwarz2006, Cerrano et al. Reference Cerrano, Bertolino, Valisano, Bavestrello and Calcinai2009, Hancock et al. Reference Hancock, Walker, Pérez-Huerta and Bowser2015). Circumpolar in distribution and locally abundant (sometimes reaching densities of over 90 individuals m-2), A. colbecki also plays an integral role in pelagic-benthic nutrient coupling by filter feeding, bio-depositing and re-suspending organic-rich detritus when phytoplankton production is insufficient to generate nutrients (Stockton Reference Stockton1984, Cattaneo-Vietti et al. Reference Cattaneo-Vietti, Chiantore and Albertelli1997, Chiantore et al. Reference Chiantore, Cattaneo-Vietti, Albertelli, Misic and Fabiano1998, Heilmayer et al. Reference Heilmayer, Brey, Chiantore, Cattaneo-Vietti and Arntz2003, Schiaparelli & Linse Reference Schiaparelli and Linse2006, Norkko et al. Reference Norkko, Thrush, Cummings, Gibbs, Andrew, Norkko and Schwarz2007).
Despite its ecological importance, the maximum lifespan of A. colbecki is not well constrained. Maximum lifespan estimates range from 6 years to over a century (Ralph & Maxwell Reference Ralph and Maxwell1977, Berkman Reference Berkman1990, Heilmayer et al. Reference Heilmayer, Brey, Chiantore, Cattaneo-Vietti and Arntz2003). In general, high-latitude bivalves have slower growth and live longer than temperate bivalves. Nevertheless, a century-long lifespan would make A. colbecki the longest-lived scallop by far. Furthermore, the highest growth estimates (K) derived from von Bertalanffy growth models (VBGMs) for this species are nearly triple the lowest growth estimates (Berkman Reference Berkman1990, Chiantore et al. Reference Chiantore, Cattaneo-Vietti and Heilmayer2003, Heilmayer et al. Reference Heilmayer, Brey, Chiantore, Cattaneo-Vietti and Arntz2003, Schiaparelli & Aliani Reference Schiaparelli and Aliani2019). Variation in estimates of lifespan and growth could result from a variety of factors, such as differences in age determination methods, environment (water temperature, primary production related to sea-ice conditions) and latitude (Stockton Reference Stockton1984, Heilmayer et al. Reference Heilmayer, Brey, Chiantore, Cattaneo-Vietti and Arntz2003, Hancock et al. Reference Hancock, Walker, Pérez-Huerta and Bowser2015).
Sea ice is critical in structuring polar ecosystems (Eicken Reference Eicken1992, Clark et al. Reference Clark, Marzinelli, Fogwill, Turney and Johnston2015), and bivalve growth reflects changes in sea-ice extent and duration in the Arctic (Sejr et al. Reference Sejr, Blicher and Rysgaard2009). The type of sea ice in an area (annual or multiannual) has important implications for primary production and therefore nutrient availability for Antarctic benthic organisms. Annual sea ice is thinner than multiannual sea ice, allowing more light penetration into the water column that facilitates phytoplankton blooms under the ice (Arrigo et al. Reference Arrigo, Perovich, Pickart, Brown, van Dijken and Lowry2012). Break out of annual sea ice also allows yet more light to penetrate the water column, further increasing primary productivity (Dayton Reference Dayton1990, Clark et al. Reference Clark, Marzinelli, Fogwill, Turney and Johnston2015), whereas multiannual sea ice dampens productivity (Norkko et al. Reference Norkko, Thrush, Cummings, Gibbs, Andrew, Norkko and Schwarz2007, Clark et al. Reference Clark, Marzinelli, Fogwill, Turney and Johnston2015). Additionally, primary productivity of sea-ice algae is higher under annual sea ice than under multiannual sea ice in Antarctica (Arrigo et al. Reference Arrigo, Worthen, Lizotte, Dixon and Dieckmann1997). Adamussium colbecki populations consume more detritus and less phytoplankton at sites with multiannual sea ice and more phytoplankton at annual sea-ice sites (Norkko et al. Reference Norkko, Thrush, Cummings, Gibbs, Andrew, Norkko and Schwarz2007). Nutrient limitation and low temperatures reduce metabolism and are thought to drive increased longevity and decreased growth rates in high-latitude bivalves (Moss et al. Reference Moss, Ivany, Judd, Cummings, Bearden and Kim2016), and caloric restriction, specifically, increases longevity across a wide range of animals (Fontana et al. Reference Fontana, Partridge and Longo2010). Thus, A. colbecki living under multiannual sea ice may be longer lived and slower growing than their counterparts under annual sea ice when seawater temperatures are similar.
Our study compares the growth and longevity of A. colbecki from two sites located within western McMurdo Sound, Antarctica, which vary in sea-ice duration but not seawater temperature. We postulate that scallops from the multiannual sea-ice site will have a longer maximum lifespan and slower growth than scallops from the annual sea-ice site. However, if growth and lifespan estimates are similar at both sites, then some other environmental variable (i.e. temperature; Menge et al. Reference Menge, Chan and Lubchenco2008) must be the overriding factor affecting their growth and, ultimately, their lifespan. Additionally, we compared our age estimates with results from previous studies that used alternative age estimates for A. colbecki to determine whether the age estimation method also influences lifespan estimates.
Methods
Background: longevity and growth in A. colbecki
Adamussium colbecki is endemic to the Southern Ocean, and its distribution is primarily restricted to coastal Antarctica (Schiaparelli & Linse Reference Schiaparelli and Linse2006). Sites where its growth and lifespan were examined span ~12 degrees of latitude within a seawater temperature range of ~4°C (Fig. 1). Nevertheless, growth and lifespan estimates have varied widely for this species (Ralph & Maxwell Reference Ralph and Maxwell1977, Stockton Reference Stockton1984, Berkman Reference Berkman1990, Heilmayer et al. Reference Heilmayer, Brey, Chiantore, Cattaneo-Vietti and Arntz2003, Berkman et al. Reference Berkman, Cattaneo-Vietti, Chiantore and Howard-Williams2004), which is possibly attributable to latitudinal differences among populations, the use of various methods to analyse growth and longevity in A. colbecki or other environmental factors not considered here (e.g. differences in pH, salinity, carbonate concentration, etc.).
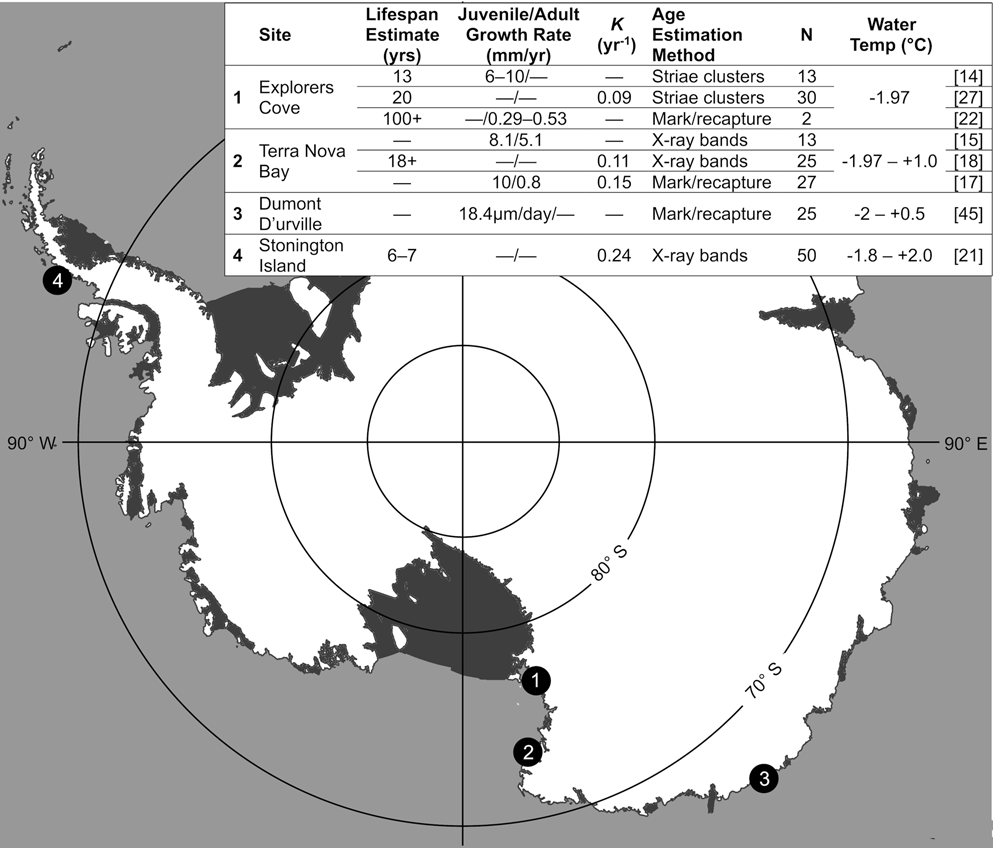
Fig. 1. Growth and lifespan estimates for Adamussium colbecki in Antarctica. Previous studies of A. colbecki longevity and growth from four Antarctic sites (Explorers Cove, Terra Nova Bay, Dumont d'Urville Station and Stonington Island) resulted in a range of lifespan and growth estimates. Study sites are indicated with numbered circles; numbers correspond to results in the table inset; N refers to sample size; water temperatures are from Stockton (Reference Stockton1984), Heilmayer & Brey (Reference Heilmayer and Brey2003), Lartaud et al. (Reference Lartaud, Chauvaud, Richard, Toulot, Bollinger, Testut and Paulet2010), Hancock et al. (Reference Hancock, Walker, Pérez-Huerta and Bowser2015) and Cziko (personal communication 2018).
Estimates of A. colbecki growth and lifespan were previously made at three sites: Explorers Cove (EC) at the southern end of western McMurdo Sound; Stonington Island, located off the west coast of the Antarctic Peninsula; and Terra Nova Bay, a polynya at the northern end of western McMurdo Sound (Fig. 1). Additionally, juvenile summer growth rates were measured at Dumont d'Urville Station, though lifespan was not estimated. Explorers Cove, the highest-latitude and coldest site, maintains temperatures near the freezing point of seawater (-1.97°C), and A. colbecki at that locality have the slowest growth and greatest lifespan estimates (Brody growth constant, K = 0.09 yr-1; 100+ yr lifespan; Berkman Reference Berkman1990, Berkman et al. Reference Berkman, Cattaneo-Vietti, Chiantore and Howard-Williams2004). Stonington Island, the lowest-latitude and warmest site, had the second highest growth estimate and the shortest lifespan (K = 0.24 yr-1; 6–7 yr lifespan; Ralph & Maxwell Reference Ralph and Maxwell1977). Lastly, Terra Nova Bay is intermediate between EC and Stonington Island in both latitude and temperature, as well as growth and lifespan estimates (K = 0.11–0.26 yr-1; 18+ yr lifespan; Chiantore et al. Reference Chiantore, Cattaneo-Vietti and Heilmayer2003, Heilmayer et al. Reference Heilmayer, Brey, Chiantore, Cattaneo-Vietti and Arntz2003, Schiaparelli & Aliani Reference Schiaparelli and Aliani2019). At all of the sites, A. colbecki growth slows through ontogeny, but multiple authors have remarked upon the high inter-individual variability in growth rates (Chiantore et al. Reference Chiantore, Cattaneo-Vietti and Heilmayer2003, Lartaud et al. Reference Lartaud, Chauvaud, Richard, Toulot, Bollinger, Testut and Paulet2010, Trevisiol et al. Reference Trevisiol, Bergamasco, Montagna, Sprovieri and Taviani2013).
Researchers have used two different valve features to analyse growth and lifespan, which may contribute to the disparate longevity and growth estimates. Small sub-annual bands (striae; Fig. 2a) were used either individually or in groups to analyse growth at EC. At that site, individual striae were counted and growth rates ranging from 0.29 to 0.53 mm yr-1 were estimated on recaptured scallops, leading the authors to conclude that the largest known A. colbecki (108 mm) could be over a century old (Berkman et al. Reference Berkman, Cattaneo-Vietti, Chiantore and Howard-Williams2004). Other studies, using grouped striae, suggest that A. colbecki lives for 13–20 years at EC (Stockton Reference Stockton1984, Berkman Reference Berkman1990). Rather than using striae, bands visible under X-ray (Fig. 2b) were used for A. colbecki from Stonington Island and Terra Nova Bay. Using X-ray bands, A. colbecki's lifespan could be 6–18+ years (Ralph & Maxwell Reference Ralph and Maxwell1977, Heilmayer et al. Reference Heilmayer, Brey, Chiantore, Cattaneo-Vietti and Arntz2003, Trevisiol et al. Reference Trevisiol, Bergamasco, Montagna, Sprovieri and Taviani2013, Schiaparelli & Aliani Reference Schiaparelli and Aliani2019). The disparity in growth and lifespan estimates for A. colbecki necessitates a comparison of estimates from various sites using a consistent method.
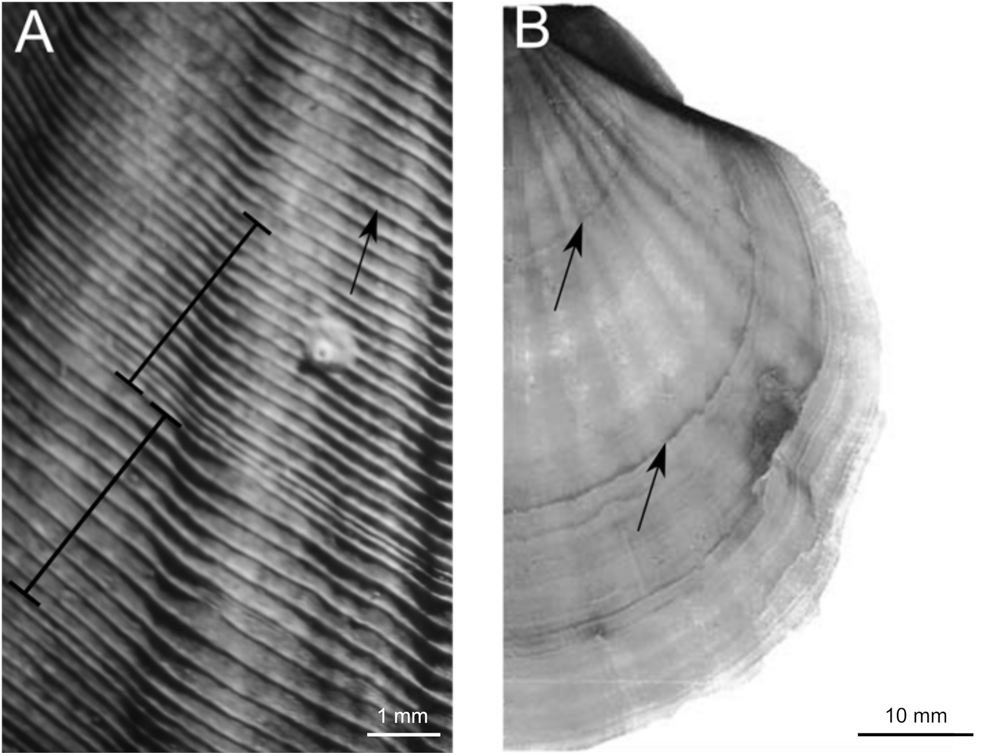
Fig. 2. Age estimation in Adamussium colbecki. Striae (small raised co-marginal ridges on valve surfaces) and X-ray bands are used for age estimation in A. colbecki. a. Grouped striae: 1 year is thought to represent a group of widely spaced striae coupled with a group of narrowly spaced striae (Stockton Reference Stockton1984, Berkman Reference Berkman1990). Black brackets span one widely spaced group and also one narrowly spaced group; a single stria is indicated by the arrow. b. X-ray bands: bands visible in X-ray are used as yearly markers (Ralph & Maxwell Reference Ralph and Maxwell1977, Cattaneo-Vietti et al. Reference Cattaneo-Vietti, Chiantore and Albertelli1997, Heilmayer et al. Reference Heilmayer, Brey, Chiantore, Cattaneo-Vietti and Arntz2003). Arrows point to X-ray bands.
Study site and collection
Adult scallops were haphazardly collected live by divers in November 2008 from water depths between ~9 and 18 m from areas totalling ~300 m2 from two sites in western McMurdo Sound, Ross Sea, Antarctica (Fig. 3). The sites were chosen based on similarity in water temperature (-1.97°C), proximity to each other and differences in sea-ice persistence. The lower valves of 37 scallops collected from EC and 19 collected from Bay of Sails (BOS) were used in this study. Scallops from EC were slightly smaller than scallops from BOS (EC mean valve height = 78.7 mm, 95% confidence interval (CI): 76.3–81.0 mm; BOS mean valve height = 80.7, 95% CI: 76.9–84.2 mm).
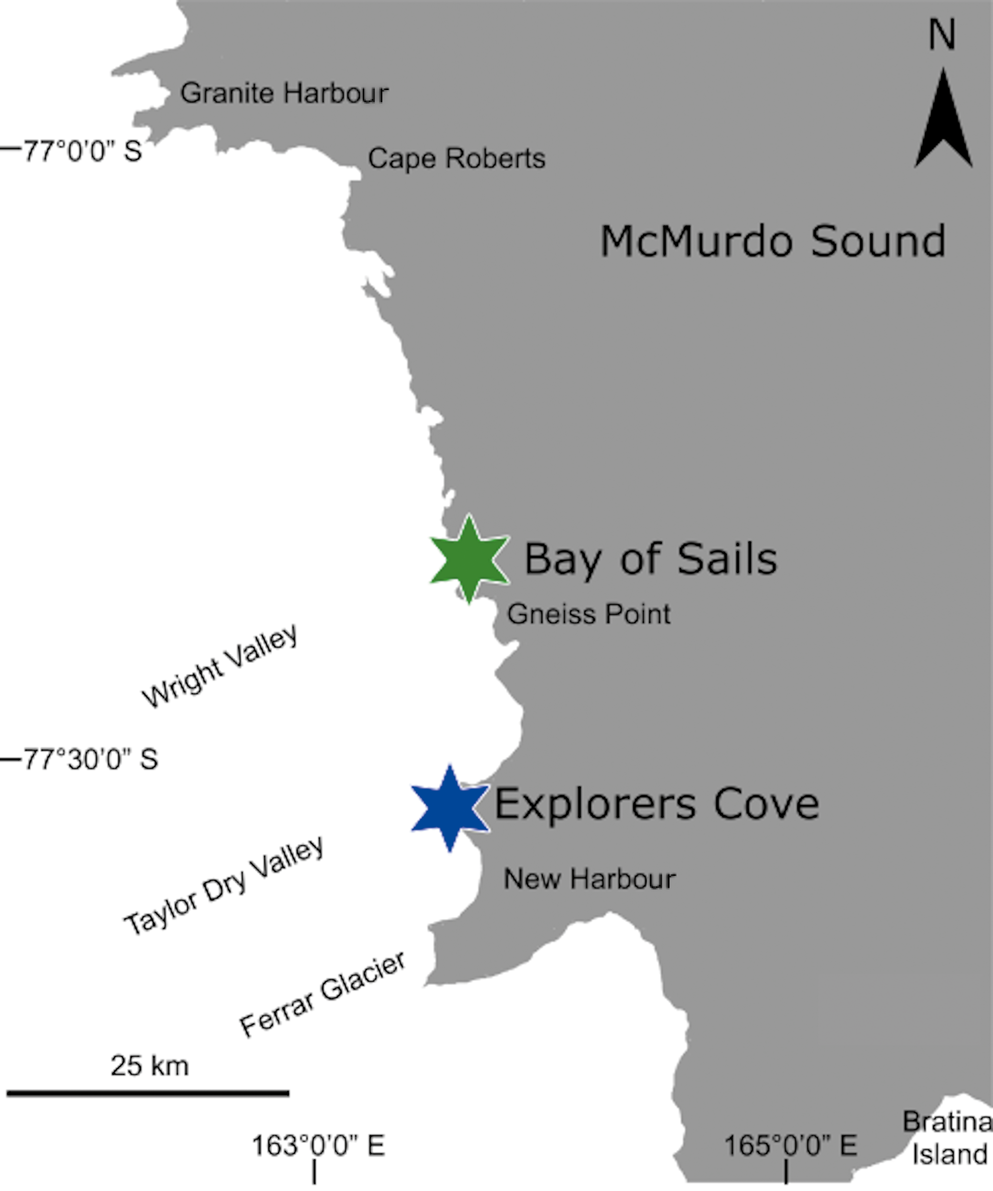
Fig. 3. Study sites of Explorers Cove and Bay of Sails, western McMurdo Sound, Antarctica. Explorers Cove (77°34.259′S, 163°30.699′E) is a marine embayment at the mouth of Taylor Dry Valley and is ~25 km south of Bay of Sails (77°21.911′S, 163°32.594′E). At Bay of Sails, sea ice melts annually, whereas sea ice at Explorers Cove persists for multiple years.
Both EC and BOS are characterized by gently sloping topography and negligible water currents except for tidal flow ranging from ~1.0 to 2.6 cm s-1 (Barry & Dayton Reference Barry and Dayton1988, Hancock et al. Reference Hancock, Walker, Pérez-Huerta and Bowser2015). Both sites are considered oligotrophic: organic carbon and diatom fluxes are two orders of magnitude lower than in eastern McMurdo Sound due to current flow under the Ross Ice Shelf (Leventer & Dunbar Reference Leventer and Dunbar1987).
Explorers Cove is an embayment located at the mouth of the Taylor Valley and maintains multiannual to decadal sea-ice cover. Sea ice broke out partially in 1999 and more extensively in 2002, but has otherwise remained intact since 1993. Sea ice at EC during the 1990–2011 field seasons was typically multiyear and ~3.25–4.00 m thick (Bowser, personal observations 1990–2011). Sediment at EC is composed of polymictic fine silty sands with a modal grain size of 125–300 μm (Radford et al. Reference Radford, Walker and Bowser2014). Additionally, an ice wall along the shoreline at ~5 m depth creates a moat containing nutrient-rich brackish water that enters EC periodically (during spring high tides) and supplies nutrients to areas within 100–200 m (Dayton et al. Reference Dayton, Jarrell, Kim, Ed Parnell, Thrush, Hammerstrom and Leichter2019). Scallops collected for this study were found within the area that would be influenced by the nutrients from the ice wall.
Bay of Sails is located ~25 km north of EC, offshore of Wilson Piedmont Glacier. Sea ice breaks out annually at BOS and iceberg disturbance is probably higher at BOS than at EC (Hancock et al. Reference Hancock, Walker, Pérez-Huerta and Bowser2015). Sediment at BOS is comprised of polymictic very fine sands with a modal grain size of 63–125 μm (Radford et al. Reference Radford, Walker and Bowser2014).
Annuli identification and growth increment measurement
We used annual bands visible on shell surfaces (annuli) to compare growth and lifespan at EC and BOS (after Merrill et al. Reference Merrill, Posgay and Nichy1966) for three reasons. First, though X-ray bands in A. colbecki valves have been validated as annual using δ18O (Heilmayer et al. Reference Heilmayer, Brey, Chiantore, Cattaneo-Vietti and Arntz2003), Heilmayer et al. (Reference Heilmayer, Brey, Chiantore, Cattaneo-Vietti and Arntz2003) also identified annuli on valve surfaces and found ~90% agreement between the numbers of X-ray bands and annuli per valve. Therefore, counts of X-ray bands and annuli should result in comparable lifespan estimates for A. colbecki. Second, we had difficulties interpreting X-ray bands in A. colbecki's thin shells, difficulties also encountered by a previous author (Stockton, Reference Stockton1984). We found annual X-ray bands were impossible to distinguish from other irregularities in growth that produced similar rings, possibly shock rings (Merrill et al. Reference Merrill, Posgay and Nichy1966). Third, annuli are commonly employed to age scallops in fisheries studies, making results from this method comparable to other scallop research.
Annuli were recognized by changes in valve colour and curvature. These annuli represent annual slowing or cessation in growth (Merrill et al. Reference Merrill, Posgay and Nichy1966). We found that A. colbecki had two distinct annuli types (Fig. 4). The first type of annuli appear as whitish rings in slight concave depressions against the brown surface colour of the shell, which we interpret as slower growth, but not growth cessation. The second type of annuli are still whitish rings, but also have a shingled appearance and occur during late adult growth (near valve margins). We interpret the second annuli type as growth cessation; the shingled appearance results from new growth beginning under, then growing past, the previous shell margin.

Fig. 4. Annuli identification on Adamussium colbecki valves. Annuli (indicated by arrows) appear as whitish rings in concave depressions against the brown, convex shell surface. Shingled annuli representing late adult growth are indicated by brackets.
The age of each valve was determined by counting discernible annuli. Median ages and 95% CIs for each site were calculated using bootstrap resampling and compared to determine whether sea-ice duration affected age.
The distance from the umbo to each annulus along the central axis of each valve was measured using electronic callipers (accuracy: ± 0.01 mm) yielding height-at-age measurements. Yearly growth increments (yearly growth rates) were calculated by subtracting the height at age t from the height at age t + 1.
Shell height-at-age measurements were also used to model A. colbecki growth using the VBGM. We used the typical von Bertalanffy growth equation in Eq. (1):
 $${\rm L}_t = {\rm L}_\infty \lpar {1 \,\hbox {-}\;e^{\hbox{-}K\lpar t\;\hbox {-}\;t0\rpar }} \rpar $$
where Lt is the shell height at time t, L∞ is the asymptotic average height (the theoretical maximum height of the average individual in a population and the asymptote that the curve approaches), the Brody growth constant (K) describes how quickly valve height approaches L∞ and t 0 represents the time at which the valve would have a height of zero. Curves were fitted to height-at-age data using non-linear least square regression (R Core Team 2017, https://github.com/droglenc/FSA).
The VBGM characterizes the average growth at each site and the typical VBGM equation is commonly used in A. colbecki studies (Ralph & Maxwell Reference Ralph and Maxwell1977, Berkman Reference Berkman1990, Chiantore et al. Reference Chiantore, Cattaneo-Vietti and Heilmayer2003, but see Heilmayer et al. Reference Heilmayer, Brey, Chiantore, Cattaneo-Vietti and Arntz2003, Schiaparelli & Aliani Reference Schiaparelli and Aliani2019). We therefore use the typical VBGM to compare our results to previous work. We fit VBGM curves to the height-at-age data for EC and BOS valves to compare average growth.
The similarity of the VBGM curves fitted to the EC and BOS height-at-age data was compared with maximum likelihood methods (Nelson Reference Nelson2017). First, four hypothetical curves were fitted to the EC and BOS data. Three of the hypothetical curves have identical values for a single VBGM parameter (K, L∞, t 0), positing that EC and BOS share a VBGM parameter in common. The fourth hypothetical curve has equal values for all three VBGM parameters, in essence positing that the growth at EC and BOS is indistinguishable. Second, the residual sum of squares is then calculated for the fit of all four hypothetical curves and for the actual curves fitted to the height-at-age data for each site. The curve, whether hypothetical or actual, with the smallest residual sum of squares is said to have the best fit, and support for each model was represented using the Akaike information criterion (ΔAIC), such that the lowest ΔAIC indicates the curve that best fits the data (Nelson Reference Nelson2017, R Core Team 2017).
We analysed individual variation in growth (K and L∞) using Ford-Walford plots for each valve. Ford-Walford plots are used to model individual growth when there is variability in K and L∞ within a population (Hart & Chute Reference Hart and Chute2018). In a Ford-Walford plot, height at age t is plotted against height at t + 1, and both K and L∞ can be calculated from a linear regression using Eqs (2) and (3):
 $$K = {\hbox {-}}{\rm ln\beta }$$
 $${\rm L}_\infty = {\rm \alpha }/1 {\,\hbox -}\, {\rm \beta }$$
where β is the slope and α is the y-intercept of the Ford-Walford linear regression (Walford Reference Walford1946). To alleviate ambiguity in reporting K and L∞ derived from two different methods, K VBGM and L∞VBGM will denote results from VBGM models and K FW and L∞FW will denote results from Ford-Walford plots. The means and 95% CIs of K FW and L∞FW for scallops from each site were calculated using bootstrap resampling. The coefficients of variation of K FW and L∞FW were calculated to evaluate the amount of individual variability for each site. Valves ≤ 70 mm in height were excluded from individual Ford-Walford analyses; therefore, 31 valves from EC and 14 valves from BOS were included.
Results
Lifespan estimates
Adult A. colbecki from EC and BOS had identical median ages of 14 years (Fig. 5), though BOS scallops had a greater maximum age (19 years) than EC scallops (18 years).

Fig. 5. Median valve ages by site. Points indicate median ages; lines delineate 95% confidence intervals on the medians.
Yearly growth rate estimates for A. colbecki at EC and BOS
As with other bivalves, A. colbecki yearly growth is fastest in juveniles and slows throughout ontogeny. At both sites, mean growth rates were fastest at 4 years of age and declined thereafter (Fig. 6a & b). Juvenile (≤ 6 years of age) mean yearly growth rate was slower at EC (8.6 mm yr-1) than at BOS (10.2 mm yr-1), but adult growth was faster at EC (3.6 mm yr-1) than at BOS (2.8 mm yr-1) (Fig. 6c).

Fig. 6. Growth rates by site. a. Mean yearly growth rates at Explorers Cove. b. Mean yearly growth rates at Bay of Sails. Open circles indicate the yearly growth rates for each individual and the line indicates the mean yearly growth rate. c. Mean juvenile and adult growth rates by site. Juveniles include valve growth rates for ages ≤ 6 years. Adult growth rates include growth rates for ages > 6 years. Points indicate mean growth rates; lines delineate 95% confidence intervals on the means.
von Bertalanffy growth models
Growth parameters calculated from fitted VBGM equations indicated that EC scallops have slower growth rates and greater maximum heights than BOS scallops (EC K VBGM = 0.15; BOS K VBGM = 0.21; EC L∞VBGM = 94.5 mm; BOS L∞VBGM = 89.7) (Fig. 7). Comparisons of VBGMs using likelihood methods suggested growth at EC and BOS is indeed dissimilar. Of the four hypothetical VBGMs, the model that posited EC and BOS share an identical t 0 best fit the data, but the model positing that no parameters were equal between the sites also had strong support (Table I). The hypothetical model with the weakest support posited that L∞ VBGM or K VBGM are equal for EC and BOS (Table I).

Fig. 7. von Bertalanffy growth models for Adamussium colbecki by site. a. Explorers Cove; b. Bay of Sails. Circles indicate individual height-at-age data points and solid lines indicate the von Bertalanffy growth models.
Table I. Likelihood ratio tests of von Bertalanffy models for Adamussium colbecki by site.

Bold ΔAIC values indicate the models with the strongest support (lowest ΔAIC).
AIC = Akaike information criterion.
Among individual valves, K FW and L∞FW were both more variable at EC than BOS, suggesting that there may be more inter-individual variability in growth at EC than BOS. The coefficient of variation for K FW and was higher at EC (0.32) than at BOS (0.13). Similarly, the coefficient of variation for L∞FW was higher at EC (0.11) than at BOS (0.07). Furthermore, the range of K FW was larger at EC (0.07–0.23 yr-1) than at BOS (0.14–0.22 yr-1), and the range of L∞FW was also higher at EC (86–135 mm) than at BOS (86–106 mm). Finally, the mean of individual K FW values was lower and the mean of individual L∞FW values was higher at EC than at BOS, supporting the results from the fitted von Bertalanffy equations indicating that EC scallops grow more slowly than BOS scallops (Fig. 8).
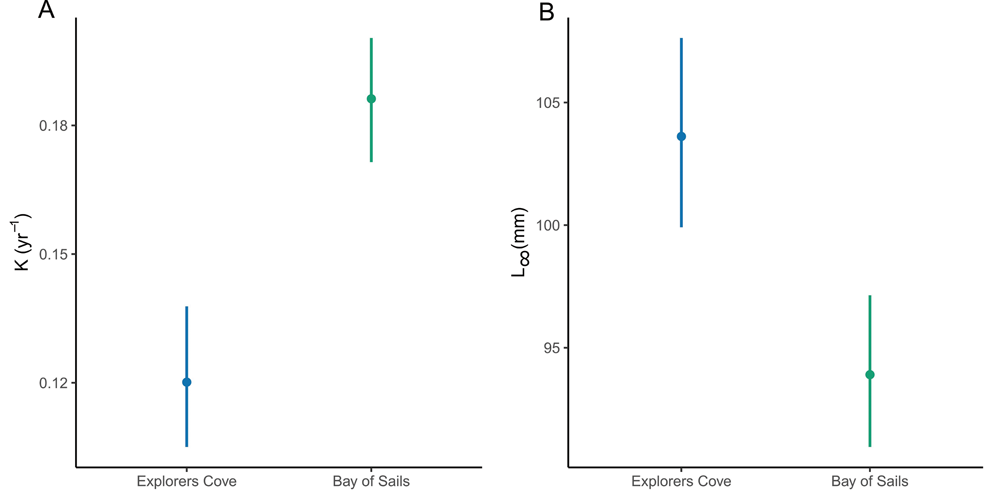
Fig. 8. Mean K and L∞ derived from Ford-Walford plots for individual valves. a. K comparison by site. b. L∞ comparison by site. Points indicate mean K and L∞ values; lines delineate 95% confidence intervals on the means.
Discussion
Effects of sea-ice persistence on lifespan
Sea-ice condition appears to have no effect on A. colbecki lifespan; the median age of individuals living under primarily multiannual sea ice (EC) was indistinguishable from that of those living under annual sea ice (BOS). If sea-ice condition is irrelevant, some other factor must control lifespan. The comparable water temperatures at BOS and EC are consistent with longevity being controlled by temperature.
Theoretical maximum lifespan
We found no direct evidence of extreme longevity in A. colbecki. Instead, we found < 20 year maximum ages at both western McMurdo sites of EC and BOS. Our maximum ages agree well with the 18+ year longevity estimate from Terra Nova Bay (Heilmayer et al. Reference Heilmayer, Brey, Chiantore, Cattaneo-Vietti and Arntz2003), but are considerably lower than the highest estimate from EC. The century-long age estimation for A. colbecki stems from measuring growth rates (0.24–0.53 mm yr-1) of marked and recaptured individuals at EC, then extrapolating the rates to the largest known A. colbecki (108 mm; Berkman Reference Berkman1990, Berkman et al. Reference Berkman, Cattaneo-Vietti, Chiantore and Howard-Williams2004). It should be noted that sea ice at EC was typically multiyear prior to the collection of these two scallops in 1986 (Bowser, personal communication 2018), but extrapolating from these very low growth rates may overestimate the A. colbecki maximum lifespan. For instance, if our average scallop (~14 years old, ~80 mm shell height) grew at 0.53 mm yr-1 for 76 years, it would be over 125 mm (> 15 mm larger than the largest known A. colbecki) when it reached 100 years old. On the other hand, if we assume the oldest scallop in our study (80 mm at 19 years) grew at its final yearly growth rate (0.24 mm yr-1) for 80 years, it would be just over 100 mm by 100 years of age. It is therefore theoretically possible to have a century-old A. colbecki, but this is improbable.
Nevertheless, maximum ages from our study should not be considered an upper limit on A. colbecki maximum lifespan for two reasons. First, our largest individual was ~12 mm smaller than the largest recorded A. colbecki, and this species can sustain very low growth rates over multiple years (Berkman et al. Reference Berkman, Cattaneo-Vietti, Chiantore and Howard-Williams2004, this study). Second, the maximum bivalve lifespan typically increases with latitude (Moss et al. Reference Moss, Ivany, Judd, Cummings, Bearden and Kim2016), and some species of lower-latitude scallops have higher recorded maximum ages, such as Chlamys islandica (35 years from Svalbard; Fevolden Reference Fevolden1992). A multi-decadal (≥ 20 year) lifespan for A. colbecki is therefore probable, though we did not observe direct evidence for this.
Age estimation methods compared
Age estimation methods appear to strongly affect lifespan estimates for A. colbecki. Maximum ages from our study (18–19 years) were more similar to the maximum age from Terra Nova Bay based on X-ray bands (18+ years; Heilmayer et al. Reference Heilmayer, Brey, Chiantore, Cattaneo-Vietti and Arntz2003) than to maximum ages from striae-based EC studies (13–100+ years; Stockton Reference Stockton1984, Berkman Reference Berkman1990, Berkman et al. Reference Berkman, Cattaneo-Vietti, Chiantore and Howard-Williams2004). Moreover, lifespan estimates are more variable for striae methods: maximum lifespans estimated from EC scallops were 13, 20 or 100+ years (Stockton Reference Stockton1984, Berkman Reference Berkman1990, Berkman et al. Reference Berkman, Cattaneo-Vietti, Chiantore and Howard-Williams2004). In contrast, maximum lifespans based on X-ray bands produced estimates of 6 years from Stonington Island (Ralph & Maxwell Reference Ralph and Maxwell1977) and 18+ years from Terra Nova Bay (Heilmayer et al. Reference Heilmayer, Brey, Chiantore, Cattaneo-Vietti and Arntz2003). Counting annuli provides a maximum age estimate of 19+ years (this study). The similarity between our age estimates and those from Terra Nova Bay suggests that discrepancies in age estimation methods might be contributing to the wide range of lifespans reported for A. colbecki.
Annuli- or X-ray-based age estimation methods produce more consistent lifespan estimates than striae-based methods, possibly due to incorrect assumptions about the timing of striae formation in adults. Adamussium colbecki striae accrete approximately fortnightly in juveniles (Lartaud et al. Reference Lartaud, Chauvaud, Richard, Toulot, Bollinger, Testut and Paulet2010), but fortnightly striae formation probably does not continue through adulthood. For example, in a mark-recapture study at EC, one adult scallop was recaptured after 8 years and another adult was recaptured after 12 years, but they had accreted 19 and 105 striae, respectively (Berkman et al. Reference Berkman, Cattaneo-Vietti, Chiantore and Howard-Williams2004). Their results suggest that striae do not form at consistent time intervals in adults. Estimating age in A. colbecki using the grouped striae method implicitly assumes that striae form at consistent time intervals throughout both juvenile and adult growth. Theoretically, the grouped striae method would underestimate scallop ages if striae form at irregular time intervals. For example, the largest known A. colbecki (108 mm) was estimated to be 20 years old based on extrapolation from a VBGM for EC scallops whose ages were determined using the grouped striae method (Berkman Reference Berkman1990); in contrast, our 19 year-old individual was ~80 mm. Striae do not appear to be reliable for age estimation in adult A. colbecki, and therefore annuli or X-ray bands should be used.
Effects of sea-ice persistence and temperature on growth
Sea-ice duration affects A. colbecki growth rates and variability; growth (proxied by K VBGM, K FW and mean juvenile growth rates) is slower and more variable at EC than at BOS. Seawater temperature is comparable at EC and BOS; we therefore postulate that growth differences result from differences in nutrient availability. Sea ice is a critical factor controlling nutrient supply to benthic organisms. Specifically, A. colbecki is known to consume more re-suspended detritus under multiannual sea ice at EC where less phytoplankton is available and more phytoplankton at Terra Nova Bay, which has a long open-water period (Norkko et al. Reference Norkko, Thrush, Cummings, Gibbs, Andrew, Norkko and Schwarz2007). Furthermore, phytoplankton consumption by A. colbecki decreases with increasing sea-ice duration (Norkko et al. Reference Norkko, Thrush, Cummings, Gibbs, Andrew, Norkko and Schwarz2007). In laboratory experiments, A. colbecki metabolism was higher for individuals provided with summer-like nutrient quantities than for individuals provided with winter-like nutrient quantities, even though temperature was held relatively constant (Heilmayer & Brey Reference Heilmayer and Brey2003). Therefore, it is plausible that sea-ice-mediated dietary differences resulting in fewer and more episodic nutrients may explain the slower and more variable growth at EC, our multiannual sea ice site.
Higher individual variability in K FW at EC reinforces our interpretation that overall slower growth at EC is caused by nutrient limitation related to persistent multiannual sea ice. K is negatively correlated with latitude in bivalves, a trend that is attributed to nutrient restriction (Moss et al. Reference Moss, Ivany, Judd, Cummings, Bearden and Kim2016). Higher individual variability in K FW at the multiannual sea-ice site may result from episodic, unevenly distributed nutrient availability under multiannual sea ice than under annual sea ice. In an overall lower-nutrient environment with episodic and patchily distributed input of sea-ice algae and nutrient-rich waters from behind the ice wall, we posit that some individuals will acquire more nutrients and grow faster than others, resulting in more individual variability in growth. Conversely, annual sea ice break out should supply phytoplankton consistently to an entire population and reduce individual variability in K FW, similarly to the results at BOS.
The slower adult growth rate in A. colbecki at BOS is reinforced by the higher K VBGM value at BOS. Though K VBGM is not a growth rate per se, it does describe how quickly the population approaches its theoretical maximum size (L∞VBGM). A higher K value indicates that a population reaches its maximum size faster than a population with a lower K value. If the BOS population approaches L∞VBGM more quickly than the EC population, as indicated by its higher K VBGM, then adult growth rates should be slower at BOS because the BOS scallops are slowing their growth as they approach their theoretical maximum size. Conversely, growth rates are higher at comparable adult ages at EC because the EC scallops included in this study are further from their theoretical maximum height. Based on the VBGM results, it is possible that EC scallops live longer than BOS scallops, but our directly aged samples did not corroborate this.
Despite generally slower growth at EC, yearly mean growth rates followed similar trajectories over ontogeny at both sites; mean yearly growth rate reached a maximum at year 4 and fell thereafter. Studies based on gonadal analysis and shell morphology from Terra Nova Bay placed A. colbecki sexual maturity at 6 or 7 years of age (Cattaneo-Vietti et al. Reference Cattaneo-Vietti, Chiantore and Albertelli1997). Peak growth rates during year 4 suggest that scallops might start devoting energy to gonad development by as early as year 5 at EC and BOS, but studies of gonadal tissue are needed to confirm this observation.
The effects of temperature on A. colbecki growth rates are supported by both laboratory and in situ studies. When shell growth was monitored for 1 week in laboratory conditions, juvenile A. colbecki kept in 3°C water grew faster than juvenile A. colbecki kept at 0°C under the same light and food regimes (Heilmayer et al. Reference Heilmayer, Honnen, Jacob, Chiantore, Cattaneo-Vietti and Brey2005). Moreover, when compared to temperate scallops, A. colbecki metabolism is low but proportional to the temperature and latitudinal context in which they live (Heilmayer & Brey Reference Heilmayer and Brey2003). Effects of temperature are also evident in growth over the entire lifetime of scallops, proxied by K. Based on previous reports, the shortest estimated lifespan and highest K occurred in A. colbecki living in the nearshore waters of Stonington Island, where summer water temperatures can reach 2°C (Ralph & Maxwell Reference Ralph and Maxwell1977). All other reports suggest that A. colbecki live longer and grow more slowly in the colder water around mainland Antarctica (Berkman Reference Berkman1990, Heilmayer et al. Reference Heilmayer, Brey, Chiantore, Cattaneo-Vietti and Arntz2003). Adamussium colbecki also has a low tolerance for increased water temperature, further supporting temperature effects on growth. For example, laboratory experiments demonstrated that swimming ability in A. colbecki declines at water temperatures > 0°C; temperatures of ~4°C resulted in 50% mortality at 19 days (Peck et al. Reference Peck, Webb and Bailey2004). Explorers Cove and BOS maintain A. colbecki populations near the freezing point of seawater, and populations can be found as far north as the Antarctic Peninsula, where seawater reaches 2°C during summer.
A combined role for temperature and nutrients determining growth would not be unusual. Temperature and nutrients were implicated as factors that determine growth in other scallop species (e.g. Pilditch Reference Pilditch1999). Additionally, a study comparing the strength of factors affecting the growth of the temperate ecosystem engineer Mytilus found that temperature accounted for 32.0% of growth variation and nutrients accounted for 12.5% (Menge et al. Reference Menge, Chan and Lubchenco2008). We posit that nutrient availability through sea-ice persistence affects A. colbecki growth, though temperature also plays a role.
Effects of growth estimation methods
Previously recorded A. colbecki growth rates for all juvenile growth overlap at EC, BOS and Terra Nova Bay, despite sea-ice, seasonal temperature and methodological differences (Stockton Reference Stockton1984, Cattaneo-Vietti et al. Reference Cattaneo-Vietti, Chiantore and Albertelli1997, Chiantore et al. Reference Chiantore, Cattaneo-Vietti and Heilmayer2003, Trevisiol et al. Reference Trevisiol, Bergamasco, Montagna, Sprovieri and Taviani2013, Schiaparelli & Aliani Reference Schiaparelli and Aliani2019). Juvenile growth rates from this study fall within the ranges from these previous studies. In contrast, previously reported adult growth rates vary widely among EC, BOS and Terra Nova Bay, but the differences appear to be driven mainly by the ontogenetic ages of the adult scallops included in each study. Including only young individuals in studies will increase reported adult growth rates, while exclusively using older individuals will decrease them, because A. colbecki growth slows over its lifetime. We excluded neither old nor young adults from our calculations, and therefore adult growth rates from our study are higher than those previously reported from an EC study that included only older adults (Berkman et al. Reference Berkman, Cattaneo-Vietti, Chiantore and Howard-Williams2004) and lower than those previously reported from a Terra Nova Bay study that included only younger adults (Chiantore et al. Reference Chiantore, Cattaneo-Vietti and Heilmayer2003, Trevisiol et al. Reference Trevisiol, Bergamasco, Montagna, Sprovieri and Taviani2013).
Estimates of K allow for more direct comparison among the sites, but VBGMs are modelled from size-at-age data, and size-at-age data depend upon the age determination method. Consequently, comparison among studies of the same species that use various age determination methods should be made carefully. Our K VBGM results from BOS scallops were closer to reported K values from studies using X-ray bands, though the sites (Terra Nova Bay and Stonington Island) are seasonally warmer than EC and BOS (Ralph & Maxwell Reference Ralph and Maxwell1977, Chiantore et al. Reference Chiantore, Cattaneo-Vietti and Heilmayer2003, Schiaparelli & Aliani Reference Schiaparelli and Aliani2019), and our EC K VBGM results were higher than the reported K values from an EC study (Berkman Reference Berkman1990) using the grouped striae method. The grouped striae method therefore appears to underestimate K compared to annual band methods (annuli or X-ray).
Conclusions
No evidence was found suggesting that sea-ice persistence controls A. colbecki lifespan, but growth was slower and more variable for scallops living under multiannual sea ice than for scallops living under annual sea ice. Large discrepancies in age estimates are probably the result of using various and incompatible age estimation methods for this species. Based on counting annuli, the maximum lifespan of A. colbecki from our sites is probably 19+ years and is in good agreement with estimates using X-ray bands from Terra Nova Bay. We recommend the use of either annuli or X-ray bands for age estimation in this species, although we found X-ray bands difficult to interpret. Counting groups of striae is a common method for ageing A. colbecki at EC, but it may lead to misestimates of lifespan and growth.
A comparison of the growth and lifespan of historical and modern populations on Stonington Island, where climate change-induced temperature increases are more pronounced, is warranted to predict A. colbecki's future in a warmer Antarctica. Warmer water and reduced sea-ice duration would increase primary productivity but may also dramatically alter the life history of this Antarctic ecosystem engineer and the biotic communities that depend on it.
Acknowledgements
The authors thank two anonymous reviewers whose comments improved this manuscript. We gratefully acknowledge the staff at McMurdo Station and the crew of Petroleum Helicopters, Inc., Steve Clabuesch, Cecil Shin, Shawn Harper, Henry Kaiser, Doug Coons and Karen Sterling, for logistical support, field assistance and diving expertise.
Author contributions
KEC developed the concepts and approach used for data collection and analysis, performed the analyses and prepared the manuscript. SEW and SSB designed the field sampling and original concept and managed field operations and specimen collection. KEC, SEW, RM, ASC and MCL developed the approach used for scallop age determination. KEC, SEW, RM, ASC and SSB edited the manuscript.
Financial support
Fieldwork and analysis was funded by NSF Polar Programs grants ANT 0739512, OPP 1745057 and PLR 1341612, as well as grants from the Paleontological Society and the Geological Society of America.
Details of data deposit
Data and code for analysis will be available at http://dx.doi.org/10.17632/59h4dxwdzn.1.


