


Introduction
The East Antarctic ice sheet (EAIS) is traditionally considered a stable feature characterized by slow-moving interior ice with drainage through ice shelves across a grounding line and by a few faster-moving outlet glaciers. This idea of stability is based on the fact that the ice sheet is not a marine ice sheet, in contrast to the West Antarctic ice sheet (WAIS), which is grounded well below sea level in much of its interior (Weertman Reference Weertman1974, Mercer Reference Mercer1978, Schoof Reference Schoof2007). However, in many places in Dronning Maud Land, the EAIS is drained by large outlet glaciers with their bedrock lying well below sea level. Most of these so-called continental ice streams also exhibit a rather complex ice flow, where effects of longitudinal stress coupling cannot be ignored (Rippin et al. Reference Rippin, Bamber, Siegert, Vaughan and Corr2003, Pattyn & Naruse Reference Pattyn and Naruse2003, Pattyn et al. Reference Pattyn, de Brabander and Huyghe2005). These ice streams cut through large gaps within a chain of mountains surrounding the East Antarctic continent that stretches from the Borg Massif in western Dronning Maud Land (5°W, 73°S) to the Yamato Mountains in eastern Dronning Maud Land (35°E, 72°S). Most of the ice flowing from the polar plateau is blocked by mountain ranges, which force ice flow either around (Pattyn et al. Reference Pattyn, de Brabander and Huyghe2005) or through the mountain terrain (Pattyn et al. Reference Pattyn, Decleir and Huybrechts1992, Pattyn & Decleir Reference Pattyn and Decleir1995).
East Antarctic outlet glaciers of Dronning Maud Land show signs of accelerated mass loss. The Shirase Glacier drainage basin, making up the border between eastern Dronning Maud Land and Enderby Land, drains through one of the fastest Antarctic glaciers, at flow speeds of > 2700 m a-1 (Fujii Reference Fujii1981). The central basin is characterized by large submergence velocities (Naruse Reference Naruse1979, Pattyn & Naruse Reference Pattyn and Naruse2003), and measurements further downstream (Nishio et al. Reference Nishio, Mae, Ohmae, Takahashi, Nakawo and Kawada1989, Toh & Shibuya Reference Toh and Shibuya1992) record thinning rates of 0.5 to 2.0 m a-1 below the 2800 m elevation contour. This thinning rate is confirmed by satellite radar altimetry for the period 1992–2003 (Wingham et al. Reference Wingham, Shepherd, Muir and Marshall2006). However, no distinctive increase in net mass loss across the grounding line has been observed (Rignot et al. Reference Rignot, Bamber, Van Den Broeke, Davis, Li, Van De Berg and Van Meijgaard2008). The thinning upstream and the associated increase in mass transport toward the grounding line may be counterbalanced by large melting rates at the grounding line. Large melting rates underneath the Shirase Glacier ice tongue have been reported by Rignot & Jacobs (Reference Rignot and Jacobs2002). The result is a negative mass balance, but a relatively stable grounding line position.
Further to the east, the Ragnhild Glaciers (Fig. 1) are the major drainage features, diverting flow around the Sør Rondane massif. Flow speeds attain 100 m a-1 more than 200 km upstream of the grounding line (Pattyn et al. Reference Pattyn, de Brabander and Huyghe2005), relatively high for East Antarctic glaciers. The ice shelf downstream of the Ragnhild glaciers shows signs of change: a comparison between 1965 Belgian maps and recent RADARSAT imagery (Jezek & RAMP Product Team 2002; http://nsidc.org/data/nsidc-0103.html) points to an acceleration in the west and a deceleration toward the east along the Princess Ragnhild Coast, indicating an eventual stoppage of the glaciers in the centre and the east of the catchment area. This may be provoked by ice piracy due to increased subglacial melting over the whole drainage basin (Pattyn et al. Reference Pattyn, de Brabander and Huyghe2005).
The Sør Rondane Mountains are a 220 km long, east–west trending mountain range, situated 200 km from the coast. These mountains dam the main flow coming from the polar plateau (Fig. 1). This damming effect is clearly depicted by i) the stepwise topography of the glaciers (“ice fall”) at the southern rim where they cut through the Sør Rondane (Fig. 2), ii) the divergent ice flow pattern, and iii) the reduced mass transport through the mountain range (Pattyn et al. Reference Pattyn, Decleir and Huybrechts1992).
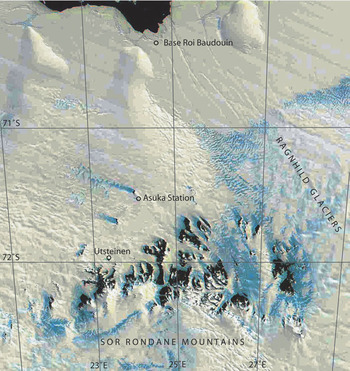
Fig. 1 MODIS image of the Sør Rondane Mountains including Breid Bay. Situation of the former Belgian Roi Baudouin Base, the former Japanese Asuka Station and the Utsteinen site of the new Belgian Princess Elisabeth Station (71°57′S; 23°20′E).

Fig. 2 Upper: Surface mass balance between 73°S and 70°S along the 23°E meridian, based on regional atmospheric climate modelling (van de Berg et al. Reference Van de Berg, Van Den Broeke, Reijmer and Van Meijgaard2006). The grey dot shows the mass balance at Utsteinen. Lower: Surface and bedrock topographic profile along the same transect, based on Bamber et al. (Reference Bamber, Gomez-Dans and Griggs2009) (surface topography) and Lythe & Vaughan (Reference Lythe and Vaughan2001) (BEDMAP bed topography).
Construction of Princess Elisabeth Station (PES) began just north of the Sør Rondane Mountains in 2006. This new Belgian research station is situated on a small, relatively flat, granite ridge (Utsteinen Ridge, 71°57′S; 23°20′E; 1390 m a.s.l.), approximately 1 km north of Utsteinen Nunatak, 173 km inland from the former Roi Baudouin base and 55 km from the former Japanese Asuka Station (Figs 1 & 3). Utsteinen Ridge - oriented in a north–south direction - is 700 m long, approximately 16 m wide and protrudes 20 m above the surrounding snow surface. The nearby Utsteinen Nunatak lies a few kilometres north of the Sør Rondane Mountains. This granite rock culminates at an elevation of 1564 m a.s.l.
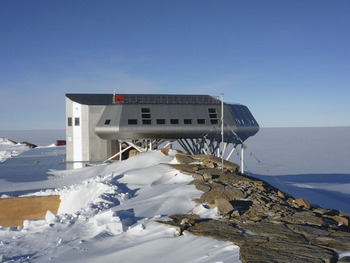
Fig. 3 View to the north of the Utsteinen Ridge and the Princess Elisabeth Station. The main wind direction is from the east (right side of the picture). Drifting snow fills the west side (left side of the picture) of the ridge. The main structure is 22 by 22 m and elevates 2–5 m above Utsteinen Ridge.
During two consecutive reconnaissance surveys in November 2004 and 2005, the initial glaciological and meteorological conditions of the vicinity of the station were investigated. We set up an automatic weather station, measured the ice thickness around the nunatak, and established a snow-stake network. In November 2008 the site was revisited and completely remeasured.
In this paper we report on the glaciological and meteorological results obtained from these three field seasons, which aims at defining the initial environmental conditions. We will show that this particular area i) experiences little effect of ice flow and ice flow change, due to the unique position of the Sør Rondane Mountains with respect to the overall dynamics of the Antarctic ice sheet, and ii) is very well sheltered from direct katabatic wind exposure.
Meteorological conditions
From December 2004 to February 2006, an Automatic Weather Station (Aanderaa AWS 2700) was operational on the ridge. It measured the 2 m air temperature (range: -60 to -30°C; accuracy: 0.1°C), atmospheric pressure, wind speed and gust (range: 79 m s-1; accuracy: 0.2 m s-1), and wind direction (threshold speed < 0.3 m -1; accuracy: < 5°) at 10 min time intervals.
Figure 4 shows the monthly mean air temperatures compared to the measured temperatures at Asuka Station, recorded more than a decade earlier (JARE 1993). Although Utsteinen Ridge lies 466 m higher than Asuka, the 2005 air temperatures are in close agreement with the Asuka measurements. Moreover, during the winter months, Utsteinen temperatures are close to the warmest winter records of the former Japanese station. A reason may be the relatively low adiabatic gradient in the foothills of the mountains. Annual mean temperatures extracted from a regional climate model (van den Broeke Reference Van Den Broeke2008) along the 23°E meridian yield a temperature gradient of 4.5 K km-1 for elevations below 2000 m, while for elevations higher than 2300 m, this gradient is 17.1 K km-1.
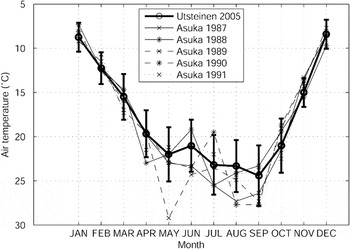
Fig. 4 The 2005 record of monthly mean air temperatures at Utsteinen compared to the temperatures recorded at Asuka station in the period 1987–91. Error bars show the standard deviation of daily average temperatures.
Although the Utsteinen temperature regime is relatively mild compared to the lower lying Asuka Station and to Roi Baudouin Station (-15°C, near sea level and 173 km further north), the yearly variation of the temperature curve exhibits the typical coreless winter of more continental stations (Thompson Reference Thompson1970, Connolley & Cattle Reference Connolley and Cattle1994), i.e. a winter with no well defined minimum temperature. It is characterized by a rapid drop in temperature in autumn, a first minimum in May, a second (more important) minimum in August–September and a very steep rise toward the December–January maximum. The day-to-day variability in atmospheric temperature is much greater during winter than during summer as shown by the error bars in Fig. 4, again very similar to continental stations, such as South Pole (Town et al. Reference Town, Waddington, Von Walden and Warren2008). The reason for both the coreless nature and higher temperature variability in winter is given by Town et al. (Reference Town, Waddington, Von Walden and Warren2008): i) winters in the southern hemisphere are stormier than summers, ii) the larger cyclonic activity results in more heat and moisture advection to the interior, iii) due to the lack of solar heating in winter, temperature inversions are more frequent under clear skies. Because these inversions are sensitive to changes in wind speed, more short timescale fluctuation arise in winter than in summer. This larger variability biases the mean temperature during winter, hence the lack of a well-defined minimum temperature. While one year of measurements is not representative to define the climate of the Utsteinen area, comparison with long-term datasets of other stations in the Antarctic revealed that 2005 was a ‘normal’ year with respect to temperature and wind speed.
Utsteinen Ridge benefits from the protection of the mountains and is, due to its position at the western side of the range, less influenced by high katabatic wind speeds. Nevertheless, the site is not overprotected as it protrudes northwards from the northern rim of nunataks and therefore still benefits from a more constant wind flow. The mean wind speed recorded at Utsteinen is 6 m s-1, which is half the mean wind speed recorded at Asuka Station. Mean summer wind speeds are around 4.5 m s-1.
The primary wind direction at Utsteinen is from the east, a katabatic wind regime coming from Jenningsbreen, one of the major outlet glaciers cutting through the range. Somewhat less frequent are winds from the south-east, coming from Gunnestadbreen, the outlet glacier closest to the site. The whole sector E–SSE accounts for more than 90% of winds at Utsteinen (Fig. 5). Variable winds occur only at very low wind speeds, while higher wind speeds (> 15 m s-1) are dominantly from the E and ESE (Fig. 5). The near absence of a northerly component indicates little near-surface influence of cyclones or air masses associated with the low pressure trough bordering Antarctica.
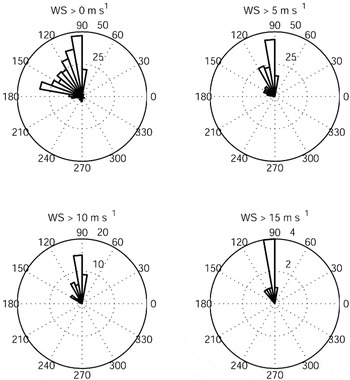
Fig. 5 Wind direction histograms for different wind speeds at Utsteinen, compiled from mean daily values (0° = north, 90° = east).
Mass balance and ice flow
In 2005 a series of stakes were set out perpendicular to Utsteinen Ridge extending more than 2 km to the east and west, respectively, hence aligned with the main wind direction (Fig. 6). Their position was precisely measured using a Leica System 1200 differential GPS (L1/L2). They were remeasured exactly three years later with a Leica SR20 differential GPS (L1 only). The same reference point was used on solid rock (Utsteinen Ridge) and baselines were less than 5 km. Horizontal position errors with the GPS system are of the order of 10–20 cm (measurement based on known geodetic points using the lowest accuracy system, SR20). The height of the stakes was also recorded. Local mass balance rates were inferred from the latter (Fig. 7). The reported values are not corrected for snow density, hence given in snow depth. They show accumulation to the east of the ridge and ablation to the west, at the downwind side of the ridge. This spatial pattern is also confirmed from the GPS-measured elevation changes (see below).

Fig. 6 Position and horizontal flow speed of the stake network near Utsteinen Ridge. Contours show the topography with an interval of 2.5 m. Maximum horizontal flow speed is 1.13 m a-1. Stakes that are marked by a cross only (without circle), did not exist in 2008. The thick dashed line shows the position of the radar profile given in Fig. 8. PSN = Pink Shrimp Nunatak.
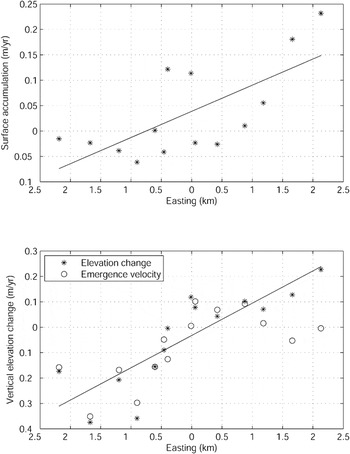
Fig. 7 Surface mass balance (snow depth) derived from stake length changes (upper panel) and vertical elevation change/emergence velocity (lower panel) for the stakes depicted in Fig. 6. The ridge is situated at the origin of the abscissa. Regression lines are shown to underline the general east–west tendency.
The relatively low local mass balance in this area of the foothills of the Sør Rondane Mountains is not abnormal. Figure 2 displays the surface mass balance between 73°S and 70°S along the 23°E meridian, determined by regional atmospheric climate modelling (van de Berg et al. Reference Van de Berg, Van Den Broeke, Reijmer and Van Meijgaard2006). The coastal area - ice shelf and inland slope - is characterized by accumulation rates of 0.2–0.3 m a-1 w. eq. Values of around 0.2 m a-1 occur upstream from the mountain range, decreasing toward the interior ice sheet. The foothill area, just downstream of the Sør Rondane, is characterized by very low to negative surface accumulation rates, in agreement with our mass balance stake measurements. Ablation is a very common feature in this region, as witnessed by the occurrence of extensive blue ice fields. These bare ice areas occur where the accumulation is reduced due to wind scouring and reduced snowdrift at the lee sides of nunataks. Once they are established they survive by increased ablation, due to the low surface albedo, longwave radiation of the nearby rocks, high temperatures caused by adiabatic heating, and wind erosion (Pattyn & Decleir Reference Pattyn and Decleir1993). Some surficial lakes are observed on the outlet glaciers, reaching depths of 5–10 cm. Year-to-year variations in blue ice extension occur, but the main ice areas remain persistent features (Pattyn & Decleir Reference Pattyn and Decleir1993). Near Utsteinen, however, the whole area is covered by a substantial layer of snow, albeit that 3 km to the west of Utsteinen blue ice patches appear, hence confirming the ablation characteristics.
Horizontal velocity markers show a diverging pattern of ice flow around the ridge, characterized by very low velocities closest to the ridge, increasing both east- and westward. Highest velocities are encountered at the eastern side, as the ice flow in the west is buttressed by Pink Shrimp nunatak (unofficial name), a small nunatak 1.5 km to the west of Utsteinen Ridge. The maximum ice flow speed is 1.13 m a-1, more than 2 km east from the ridge. Contrasting with the slow horizontal speeds, vertical elevation change on both sides of the ridge is quite substantial, leading to submergence velocities of the order of 0.2 to 0.3 m a-1 in the west (Fig. 7). This probably points to extensional flow as the ice passes through the corridor between Utsteinen Ridge and Pink Shrimp nunatak. To the east of the ridge emergence/submergence velocities are close to zero.
The low horizontal ice velocities in this area arise from the damming effect of the mountain range (Van Autenboer & Decleir Reference Van Autenboer and Decleir1974, Reference Van Autenboer and Decleir1978). The total ice discharge, based on measurements of ice flux on each of the outlet glaciers that cut through the range, amounts to 1.76 km3 a-1, which corresponds to a mean mass flux of 0.01 km2 a-1, calculated over the 180 km long northern boundary of the mountains (Pattyn et al. Reference Pattyn, Decleir and Huybrechts1992). This mass flux is especially low if we compare this value with the mean mass flux for the periphery of Antarctica. As noted by Van Autenboer (Reference Van Autenboer1964) and Nishio et al. (Reference Nishio, Ishikawa, Ohmae, Takahashi and Katsushima1984), the reduced ice flow through the mountains is probably the reason for the sheltered and crevasse-free inland ice slopes, northwards from the mountains to the coast. The mass flux of the ice shelf at the coast is much larger than the 0.01 km2 a-1 and estimated at 0.06 km2 a-1 for the length of the shelf (Pattyn et al. Reference Pattyn, Decleir and Huybrechts1992). Therefore, the horizontal mass divergence of 0.05 km2 a-1 should - in case of equilibrium - be balanced by both the accumulation between the mountains and the coast and the flow of glaciers around the mountain range. In view of the relative low accumulation rates (Fig. 2), the mass transport by the outlet glaciers surrounding the mountains should be quite substantial. Balance flux calculations confirm that the area is close to equilibrium conditions (Pattyn et al. Reference Pattyn, de Brabander and Huyghe2005), but future measurements should narrow down the uncertainties, in view of the already observed mass changes of the glaciers diverting the mountain range.
Radar profiling
Preliminary radar profiles were obtained in 2005 using a 5 MHz (central frequency) ice penetrating radar (Narod & Clarke Reference Narod and Clarke1994), consisting of a monopulse transmitter generating 1600 V pulses across a resistively-loaded 10 m dipole antenna. These preliminary data gave a first idea of the ice thickness in the vicinity of Utsteinen Ridge (not shown). Subsequent radar profiling was made in 2008 with a 5 MHz impulse radar system (Matsuoka et al. Reference Matsuoka, Thorsteinsson, Bjornsson and Waddington2007). The transmitter and receiver were put in line and separated by 45 m. Radio wave propagation speed is assumed 179 m μs-1 to account for the densification process (Herron & Langway Reference Herron and Langway1980), and the associated uncertainty in bedrock elevation is ∼6%.
The radar profile (Fig. 8) starts at Pink Shrimp nunatak (see Fig. 6 for profile location). From here, the ice thickens rapidly, reaching a depth of approximately 350 m, from where it rises again toward Utsteinen Ridge. This ice thickness is rather shallow compared to the ice thickness of the larger outlet glaciers that cut through the range. The major outlet glaciers are more than 1000 m thick and have a bedrock lying well below sea level (Van Autenboer & Decleir Reference Van Autenboer and Decleir1978, Pattyn & Decleir Reference Pattyn and Decleir1995), revealing a fjord-like subglacial landscape. These shallow depths in combination with low surface slopes limit the ice motion in the area around Utsteinen.
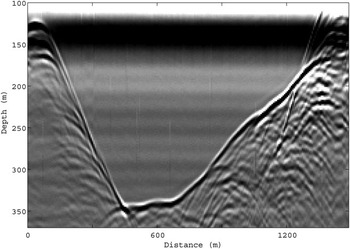
Fig. 8 Radargram showing the ice thickness variations. Depth is derived for the propagation speed of 179 m μs-1. The position of the profile is given in Fig. 6, starting near Pink Shrimp Nunatak (left) and running to Utsteinen Ridge.
Snow surface elevation change
The expected lifetime of the Princess Elisabeth Station is estimated at 25 years, so accumulation of drifting snow around the construction should be limited. Several design characteristics were tested in a series of wind tunnel experiments during the development phase of the project (Sanz et al. unpublished). Prior to the construction of the station, a kinematic GPS survey was made using a Ski-Doo travelling at 10 km h-1 in order to measure the surface topography in the vicinity of Utsteinen Ridge. However, the error in such kinematic measurements is much higher than the one obtained from static GPS measurements. Using two consecutive measurements of the same profile, we calculated an RMS error of 15.23 cm. In 2008, the snow surface was remeasured to evaluate the impact of the construction of the station on the (re)distribution of snow in its vicinity (Fig. 9). We are at present lacking precise measurements of wind speed during the 2008 winter season, but comparison with other stations reveals that 2008 was not an exceptional year.

Fig. 9 Surface topography measured in 2008 of the Utsteinen Ridge and immediate surroundings. Contour interval is 2 m. Measurement tracks are displayed in white (left), Height difference (m) between 2008 and 2004 (right).
The impact of the construction of the station on the surrounding snow surface is essentially concentrated near the station site itself, mainly due to the construction of the garage just below the ridge and the snow platform in front that elevates 2.5 m higher than before. Other changes are apparent in the southern sector of the ridge where the temporary camp is built every year. However, further downwind the station’s effect is marginal and within the error of the measurements. It can thus be concluded that the new station has minimal influence on patterns of snowdrift, accumulation, and ablation.
Conclusions
Basic meteorological and glaciological parameters of the site of the Princess Elisabeth Station, Antarctica, were measured in 2004, 2005 (prior to the construction) and 2008 (after the construction). The site is well protected from katabatic winds coming down from the polar plateau, with the major wind component from east to south-east. The lack of northern winds points to the limited influence of coastal storms. The temperature record reveals the coreless winter, typical for inland stations. Air temperatures are comparable with those measured at the former Japanese Asuka Station, although PES lies 466 m higher. Utsteinen Ridge is situated in a low mass balance area (ablation island), characterized by a slight positive mass balance to the east (windward side) and a slight negative balance to the west of the ridge. Due to the small ice thickness and surface slopes, ice motion around the station is low, with maximum values ∼1 m a-1 2 km to the east, and diverting around the ridge. Finally, a comparison of the snow surface topography before and after the construction of the station reveals that only the immediate site is influenced due to construction works, but that further away from the ridge the drifting snow pattern is hardly influenced.
Acknowledgements
This paper forms a contribution to the Belgian Research Programme on the Antarctic (Belgian Federal Science Policy Office), Project no. EA/11/3A ‘Belgian Ice Sheet - Shelf Ice Measurements in Antarctica (BELISSIMA)’. K.M. was partly supported by a University of Washington Royalty Research Fund (project 4208). The authors are indebted to Alain Hubert, Nathalie Pattyn and Maaike Vancauwenberghe for their valuable assistance with field measurements. The authors wish to thank Christina Hulbe and an anonymous referee for their remarks that considerably improved the manuscript.


