


Introduction
What controls the distribution of lichens and bryophytes, the dominant vegetation types, in Antarctica? There is now considerable interest in answering this question because of the need to anticipate the effects of climate change, a phenomenon that is expected to be more extreme at high latitudes and that is already known to be influencing plant distribution in the Antarctic Peninsula (Smith Reference Smith1994). We know that there is a marked decrease in terrestrial vegetation biodiversity as one moves south along the Antarctic Peninsula (Peat et al. Reference Peat, Clarke and Convey2007). Only a relatively small number of species continue their distribution out of the maritime Antarctic into the main continent and the higher latitudes of the Ross Sea, with about 20–30 species of bryophytes and 90 species of lichens compared to 100–115 and ∼ 350, respectively, in the maritime Antarctic. The number of hepatics falls from 27 species in the South Shetland Islands to one species with a southern limit at Botany Bay, 77°S, in the Ross Sea (Ochyra et al. Reference Ochyra, Lewis Smith and Bednarek-Ochyra2008, Øvstedal & Lewis Smith 2001; see also Hills et al. Reference Hills, Stevens and Gemmill2010). The decrease in biodiversity is matched by a fall in vegetation cover from continuous lichen and moss areas in the South Shetlands to very small, isolated patches in the Ross Sea (Green et al. Reference Green, Schroeter and Sancho2007). It has also been shown that there is a massive difference in crustose lichen growth rate (over 100 times) between species on Livingston Island, 63°S, and in Taylor Valley, 77°S (Sancho et al. Reference Sancho, Green and Pintado2007). What is not at all certain at the moment is the main environmental factor, or factors, that produce these large differences in species number, cover and growth.
The obvious environmental factors that directly affect both productivity and performance are temperature, light and precipitation. Temperature shows a general decline with latitude with mean annual temperatures of -1.5°C at Livingston Island (Ramos & Vieira Reference Ramos and Vieira2009) and -18°C at McMurdo near the Dry Valleys (Green et al. Reference Green, Schroeter and Sancho2007). Many lichens in Antarctica have an optimal temperature for net photosynthesis of around 12°C, which suggests that they should have much better performance in warmer latitudes (Longton Reference Longton1988, Kappen & Schroeter Reference Kappen and Schroeter2002, Green et al. Reference Green, Schroeter and Sancho2007). The situation for bryophytes is less clear with 15–22°C being suggested as the range for maximal growth for Bryum argenteum (Longton & MacIver Reference Longton and MacIver1977, Smith Reference Smith1999, Green et al. Reference Green, Schroeter and Seppelt2000) although Pannewitz et al. (Reference Pannewitz, Green, Maysek, Schlensog, Seppelt, Sancho, Türk and Schroeter2005) measured an optimal temperature of 6.6°C for the same species. As well as a direct effect on photosynthetic rate there is also the metabolic cost of meeting the stress associated with surviving and functioning at low temperatures. Light is more of a puzzle as levels are overall much lower in the maritime Antarctic than in continental areas where lichens and bryophytes are subject to levels above full sunlight whilst active because the meltwater only flows, or snow only melts, when exposed to direct sunlight (Green et al. Reference Green, Schroeter and Sancho2007). The costs of protection from excess light may outweigh the gains from the extra light. The response of photosynthesis to light depends on the habitat and response curves, similar to both shade and sun forms of higher plants (Green et al. Reference Green, Schroeter and Seppelt2000, Sancho et al. Reference Sancho, Pintado, Green, Pannewitz and Schroeter2003). Periods of continuous potential sunlight occur in summer within the Antarctic Circle.
Precipitation shows a strong decline from the maritime areas of Antarctica to the continental plateau (Green et al. Reference Green, Schroeter and Sancho2007). Annual precipitation can be around 600 mm yr-1 at the north of the Peninsula falling to less than 100 mm yr-1 in the McMurdo Dry Valleys. The low precipitation within continental Antarctica makes the region a cold desert and probably explains the confinement of any vegetation to microhabitats which can provide a reliable water supply, warmth and protection; the endolithic community is the most extreme example of such a microhabitat, and a very common one in the Ross Sea region (Friedmann & Ocampo Reference Friedmann and Ocampo1986). The photosynthetic response to thallus hydration of Antarctic lichens and bryophytes is little different from that found in temperate species but it does appear that acclimation or adaptation to different water regimes is possible, at least in mosses (Robinson et al. Reference Robinson, Wasley, Popp and Lovelock2000).
Whilst much research has concentrated on the direct effects of these environmental factors on photosynthesis (Kappen Reference Kappen1993, Schroeter et al. Reference Schroeter, Kappen, Green and Seppelt1997) there can also be indirect effects over which the organisms have little control. A good example is the occurrence of meltwater which is, to some extent, both temperature and light dependent with delivery depending greatly on the landscape.
An excellent method to investigate the performance of lichens or mosses is to use continuous monitoring systems that allow non-contact chlorophyll a fluorescence or gas exchange measurements. Some good examples of the technique are the long term monitoring by chlorophyll fluorescence of Usnea aurantiaco-atra (Jacquinot) Bory (Schroeter et al. Reference Schroeter, Kappen, Schulz and Sancho2000) and Pseudocyphellaria photosymbiodeme (Green et al. Reference Green, Schlensog, Sancho, Winkler, Broom and Schroeter2002) and by gas exchange and chlorophyll fluorescence for Lecanora muralis (Schreber) Rabenh. and other species (Lange Reference Lange2003a, Reference Lange2003b). Such systems allow a distinction to be made between overall climatic conditions and those that occur when the organism is active which might give a better understanding of the external factors that are important.
In this paper we take advantage of partial datasets from two projects that used chlorophyll fluorescence systems to continually monitor lichen performance. The projects were independently established but their time coverage overlaps and thus allows comparisons to be made. The first is in the maritime Antarctic on Livingston Island, 62°39′S, off the Antarctic Peninsula, and was established in 1992 (Schroeter Reference Schroeter1997) and has run almost continuously since then. The second was in continental Antarctica at Botany Bay, 77°00′S, in Granite Harbour, Ross Sea region and was operational for three years from 2002 (Schroeter et al. Reference Schroeter, Green, Pannewitz, Schlensog and Sancho2010). The locations are separated by over 14 degrees of latitude and possibly the greatest difference in climate across Antarctica with one site in the maritime zone and the other in the continental zone (Peat et al. Reference Peat, Clarke and Convey2007). These were apparently the only long-term monitoring experiments in Antarctica at that time and thus provide a unique opportunity for ecophysiological comparisons.
Methodology
Maritime Antarctic
Research site: a research site was established at a coastal rock c. 200 m north-east of the Spanish Antarctic Station, Juan Carlos I, on Livingston Island, 62°39′48′′S, 60°23′W, (Figs 1 & 2a). The north-eastern face of this rock was covered by Usnea aurantiaco-atra accompanied by Umbilicaria antarctica Frey & Lamb, Lecidea sciatrapha Hue, Rinodina petermanni (Hue) Darb., Tortula princeps De Not., Deschampsia antarctica Desv. and other species. A detailed account of the vegetation of the area is given by Sancho et al. (Reference Sancho, Schulz, Schroeter and Kappen1999).
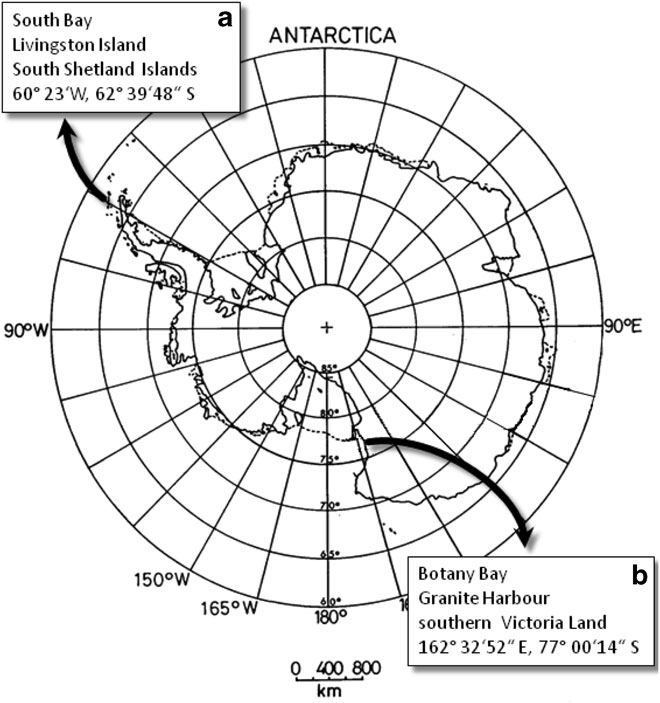
Fig. 1 Map of Antarctica showing the locations of the two research sites: a. Spanish Antarctic Station, Juan Carlos I, Livingston Island, 62°39′48′′S, 60°23′W, b. Botany Bay situated in the south-western corner of Granite Harbour, southern Victoria Land, at 162°32′52′′E, 77°00′14′′S.

Fig. 2 Photographs of the two monitoring sites, Upper panel = Livingston Island, actual fluorometer is out of sight at lower side of picture. Lower panel = Botany Bay. The fluorometer is fixed to the rock surface and powered by batteries located some 20 m away; the microclimate datalogger was in the weatherproof box below the fluorometer.
Plant material: the chlorophyll a fluorescence measurements were made on a specimen of Usnea aurantiaco-atra a widespread and abundant species on Livingston Island (Schroeter et al. Reference Schroeter, Kappen and Moldaenke1991, Reference Schroeter, Kappen, Schulz and Sancho2000).
Lichen activity: periods of lichen activity (i.e. when the lichen was hydrated) were recorded using a fluorescence system (FL-1, BBE-Moldaenke GmbH, Germany, see Moldaenke Reference Moldaenke1989) specially designed for continuous unattended, automatic monitoring (Schroeter et al. Reference Schroeter, Kappen and Moldaenke1991) using the pulse amplitude modulation technique (see Schreiber et al. Reference Schreiber, Bilger and Neubauer1994). The machine has separate fibre optics that deliver the modulated measuring light and actinic pulse to the lichen and receive the induced fluorescence from the Photosystem II reaction centres of the chloroplasts. Measurements were made every 5 min and were recorded and averaged to 30 min intervals by a datalogger (SQ1259, Grant, UK). At each measurement a low intensity modulated light was first applied and minimal fluorescence in the light measured (F). An actinic light pulse then followed and the fluorescence again recorded (Fm′). Normally the apparent quantum use efficiency of PS II {ΔF/Fm′ = (Fm′ – F)/Fm′} of the photobionts can be calculated as the actinic light pulse is saturating and closes all active centres. However, in this case, in order to minimize power use, a non-saturating actinic pulse was used and a false quantum use efficiency calculated. For this reason the recorded fluorescence data are interpreted solely as the lichen being active or inactive. Chlorophyll a fluorescence of F < 14 relative units, with no difference between F and Fm′ was considered as an indication of inactivity (Schroeter et al. Reference Schroeter, Kappen and Moldaenke1991, Reference Schroeter, Green, Seppelt and Kappen1992, Schroeter Reference Schroeter1997, Pannewitz et al. Reference Pannewitz, Schlensog, Green, Sancho and Schroeter2003). Measurements are reported for the 28 month period from January 2001–April 2003.
Microclimate: thallus temperature was recorded by microthermistor probes (0.3 mm diameter, Grant, UK). The tip was inserted in the lichen thallus about 2 to 3 cm below the top of the thallus. A quantum sensor (SKP215, Skye, UK) was used to measure photosynthetic photon flux density (PPFD, μmol m-2 s-1) with the sensor mounted on the vertical rock face which faced north-east. Relative humidity (RH) was measured by capacity probes (HMP 35A, Vaisala, SF) fixed on the rock 1 cm from the lichen thallus. Every sensor was recalibrated by means of factory supplied standard methods. Measurement were made every 5 min, and averaged and recorded every 30 min by a datalogger (SQ1259, Grant, UK). Air temperature was not recorded and data is used from the station Juan Carlos I, however, it covers only the main summer months, December to about April. These were supplemented with air temperature data measured at Bellinghausen Station, Fildes Peninsula, 62°12′S, 58°58′W, on King George Island about 90 km to the north.
Continental Antarctica
Research site: Botany Bay is situated in the south-western corner of Granite Harbour, southern Victoria Land, at 162°32′52′′E, 77°00′14′′S, c. 100 km north-west of Ross Island (Figs 1 & 2b). The area consists of raised boulder beach terraces, weathered rocky steppes and irregular rock platforms around Cape Geology, rising rapidly to the south to include a well-defined elevated cirque containing a small ice field. The area faces north and is well protected from strong winds. The impact of the sun is also magnified by the ice sheet in Granite Harbour that normally remains until about the end of January so that light levels are very high. Botany Bay, in particular, is much warmer than expected and air temperatures can reach almost 10°C. Botany Bay is ASPA 154 (Antarctic Specially Protected Area No 154) and is a restricted zone within the McMurdo Dry Valleys ASMA (Antarctic Specially Managed Area) (Antarctic Treaty Secretariat: http://www.ats.aq/e/ep_protected.htm). The Area is extremely rich botanically for such a high-latitude location - it is also one of the richest sites in the whole of continental Antarctica. There is a high diversity and abundance of lichens (more than 30 species) and mosses (nine species), and the structure and development of these communities are similar to those found several degrees of latitude further north (Seppelt et al. Reference Seppelt, Tuerk, Green, Moser, Pannewitz, Sancho and Schroeter2010, Schroeter et al. Reference Schroeter, Green, Pannewitz, Schlensog and Sancho2010).
Plant material: the chlorophyll a fluorescence measurements were made on the lichen Umbilicaria aprina Nyl. a widespread and locally abundant species in the Ross Sea region. The particular specimen monitored in this investigation grew on a sloping granite boulder at the back of the bay and was surrounded by many other large thalli. Prior observations indicated that this represented a typical habitat for the species and that rehydration was from meltwater sourced from the ice cap in the corrie behind and above Botany Bay.
Lichen activity: a pulse amplitude fluorometer (BBE-Moldenke GmbH, Germany) similar to the one installed at Livingston Island but upgraded to allow saturation pulses (for further detail see Schroeter et al. Reference Schroeter, Kappen and Moldaenke1991, Reference Schroeter, Green, Pannewitz, Schlensog and Sancho2010). At each measurement a low intensity modulated light was first applied and minimal fluorescence in the light measured (F). A saturating light pulse followed and the maximal fluorescence with all reaction centres closed obtained (Fm′). Normally the apparent quantum use efficiency of PS II {ΔF/Fm′ = (Fm′ – F)/Fm′} of the photobionts can be calculated. However, it proved impossible to be certain that a full strength saturation pulse had been achieved due to battery voltage limitations. For this reason the recorded fluorescence data are again interpreted solely as the lichen being active or inactive. Chlorophyll a fluorescence of F < 14 relative units, with no difference between F and Fm′ was considered as an indication of inactivity (Schroeter et al. Reference Schroeter, Kappen and Moldaenke1991, Reference Schroeter, Green, Seppelt and Kappen1992, Schroeter Reference Schroeter1997, Pannewitz et al. Reference Pannewitz, Schlensog, Green, Sancho and Schroeter2003). Measurements were made in a similar manner to those at the Livingston Island, but less often, every two or three hours, an interval chosen to provide sufficient pulses to establish daily patterns of activity but also large enough to save on battery power, especially at low temperatures as the system had to work unattended for a period of 8–9 months under harsh environmental conditions. In addition, it was programmed to go dormant at temperatures below -20°C to prevent possible electronic damage due to the very low temperatures and to save battery power. Permanent power was supplied by a north-facing solar panel (BP 240F; BP Solar, New Zealand) and stored using 75 Ah gel cell batteries. Measurements are reported for the 27 month period from February 2001–April 2003.
Microclimatic data
Climatic data were recorded every hour using CR10X data logger specified to -50°C (Campbell, UK) for the same time period as the chlorophyll fluorescence and using similar probes for temperature, photosynthetic photon flux density (PPFD), and humidity as at the maritime site. At this site the PPFD sensor was mounted so that its receptive surface was parallel with the surface of the lichen meaning that it faced towards the north. Botany Bay lies well within the Antarctic Circle and has periods of continuous potential sunshine in summer (27 October–17 February) and continuous darkness in winter (28 April–16 August).
Results
The measuring period reported here spans 28 months starting from January 2001 and running to April 2003. At Botany Bay, unfortunately, the measurements started one month later in February 2001 and were not always continuous, the chlorophyll fluorescence equipment shut down at temperatures below -20°C and the datalogger also stopped when there was no incident light to charge the batteries. The measurement period was effectively the summer from September–April, inclusive.
This is not unusual; the two sites differ by 14 degrees of latitude, one is within the Antarctic circle while the other outside, resulting in some clear differences in climate. Total monthly PPFD, mol m-2 month-1, showed the expected distinct annual cycle through the year (Fig. 3, upper panel). In the summer months, November–March, it was considerably higher, up to four times, at Botany Bay (Fig. 3). At Botany Bay the highest total PPFD was in December, with a very sharp peak, whilst at Livingston Island, it occurred in November or December with a broad peak. In the winter total PPFD was zero at Botany Bay and very low at Livingston Island. PPFD was measured near the lichen thallus and at Botany Bay there was a strong effect of spring snow which, when present, delayed the spring increase in PPFD (see September, October in 2002, Fig. 3; Schroeter et al. Reference Schroeter, Green, Pannewitz, Schlensog and Sancho2010).
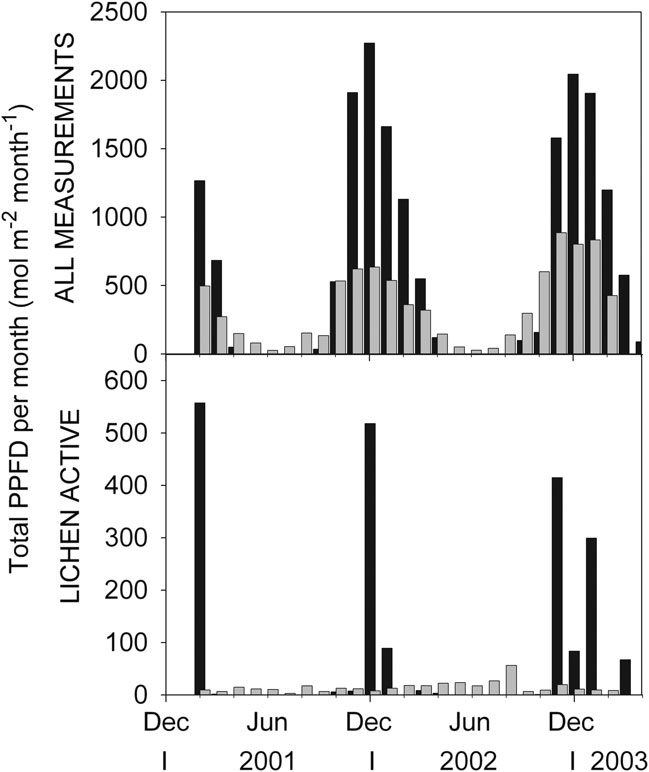
Fig. 3 Comparison of total PPFD income per month (mol m-2 month-1) at Botany Bay (black columns) and Livingston Island (grey columns) for Umbilicaria aprina and Usnea aurantiaco-atra. Upper panel, means of all measurements; and lower panel, while the lichens were active; X-axis is date in months starting with December 2000 and running to April 2003.
Mean monthly air temperatures (°C) were only available for the summer months at Livingston Island so data for Bellinghausen Station, on Fildes Peninsula, King George Island, 62°12′S, 58°58′W, are presented as well (Fig. 4, upper panel). The summer values for Bellinghausen and Livingston Island correspond well (Fig. 4) so it appears reasonable to use the winter values from Bellinghausen as a guide for conditions at Livingston Island. Mean monthly air temperatures showed a distinct annual cycle somewhat different from that of PPFD (Figs 3 & 4). Midsummer air temperatures were similar at the two sites being about 0.1°C at Livingston and 0.5°C at Botany Bay. However, the period of warmer temperatures was much longer at Livingston, lasting up to six months above zero, whereas it lasted, at most, two months at Botany Bay. Winter temperatures were very different being rarely below -10°C at Livingston (Bellinghausen data) but reaching -22.5°C at Botany Bay within the period when measurements were possible and -40°C at a nearby automatic weather station (ANTO 10 AWS). Annual mean air temperature is -15 to -19°C for Botany Bay (ANTO 10 AWS) and -1.5°C for Livingston Island, a difference of around 16°C compared to only 0.4°C in December.
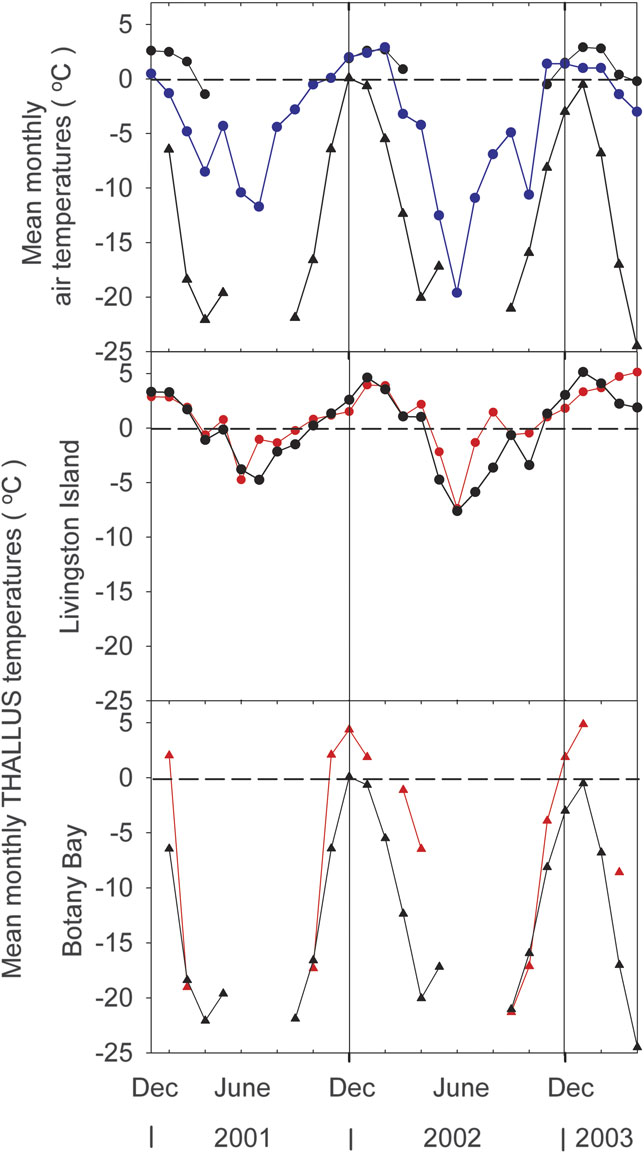
Fig. 4 Mean monthly temperature data for the two measuring sites. Upper Panel: Mean monthly air temperatures (°C) for Livingston Island, black circles and lines; Botany Bay, black triangles and lines, and Bellinghausen Station, King George Island, blue circles and lines (data for Livingston Island and Botany Bay are for summer months only, see text for explanations). Middle Panel: mean monthly thallus temperatures for Livingston Island, black circles = all measurements, red circles and lines = active lichen. Lower Panel: mean monthly thallus temperatures for Botany Bay, black triangles = all measurements, red triangles and lines = active lichen.
There were major differences in the extent and timing of lichen activity between the two sites. The lichen at Livingston was active to some extent in every month whilst activity at Botany Bay was confined to the period September to April, still a somewhat surprising 8 months (Fig. 5). For the whole 27 month period activity totalled 897 hours (4.6% of the entire measuring period) at Botany Bay with 89% of these active hours occurring in the period, November to February inclusive, the main summer months (Table I). At Livingston Island activity totalled 3694 hours (18.1% of the entire measuring period and about four times that at Botany Bay) of which only 42% occurred in the 4 month summer period. There was a clear peak of activity in early spring in September and October (Fig. 5). Number of active hours was highly variable from month to month at both sites and also year to year at Botany Bay (e.g. February 2001 with 200 hours, and February 2002 and 2003 with zero hours). Maximal number of hours active per month was 242 at Botany Bay and 470 at Livingston. However, all active hours at Botany Bay were photosynthetic whereas at Livingston Island 41% were dark respiration so that photosynthetically active hours were only about twice as numerous at Livingston Island.
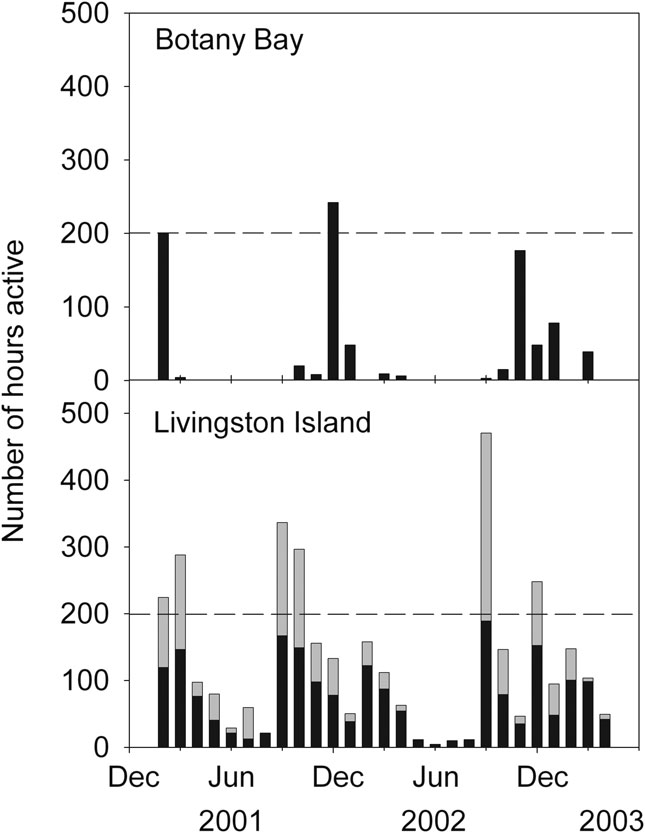
Fig. 5 Active hours over the same period from February 2001–April 2003 for Umbilicaria aprina thallus in Botany Bay (upper panel) and for Usnea aurantiaco-atra at Livingston Island (lower panel): Y axis is number of hours active per month and X-axis is date as month of year. Black bar means photosynthesis and grey bar is dark respiration. The total height of the bar is photosynthesis plus respiration and indicates the total activity in hours for that month.
Table I Comparison of lichen activities, temperature and light conditions of the lichens at the two research sites.
Because of the two different patterns of activity, Botany Bay with peak activity at midsummer with very high PPFD (Fig. 3) compared to an early spring peak at Livingston Island with low PPFD, the total amount of PPFD incident on the lichens when active was very different between the two sites (Fig. 3, lower panel). In December 2001 the lichen at Botany Bay, when active, had a total PPFD of 557 mol m-2 s-1, about 29 times more than the 19.3 mol m-2s-1 at Livingston Island (Fig. 3, lower panel). In the winter the lichen at Livingston Island still received light whilst it was dark at Botany Bay. A comparison of total monthly incident PPFD (mol m-2 month-1) when active to mean total incident PPFD also shows this difference between the sites (Fig. 3, compare upper and lower panels). At Livingston Island, during spring and summer, the lichen had substantially lower total incident PPFD when active than the total incident value, 9% of incident for November 2001 and 30% of incident (54 mol m-2 month-1) for the spring/summer period. By contrast, at Botany Bay, mean monthly total PPFD when active was over 247 mol m-2 month-1 for the summer period (Table I). These differences reflect the difference in source of water at the two sites. At Livingston Island the lichen receives rain and snow whilst cloudy in the spring and summer whereas at Botany Bay the lichen is activated almost solely by meltwater that flows only when the sun shines.
Mean thallus temperature when active at Livingston Island was, in summer, very similar to air temperature (Fig. 4, middle panel) probably because of the low PPFD environment with little radiation-driven thallus warming. In winter the temperatures when active typically remained within a degree or so of 0°C and well above the air temperature that fell to around -10°C (Fig. 4, upper panel). At Botany Bay mean thallus temperature when active in the summer months was above air temperature, up to 4.5°C above, almost certainly a result of the very high incident PPFD (Fig. 4, lower panel). In winter the lichen was not active but in spring and autumn activity was recorded down to -20°C, however this occurred for only a small number of hours, < 5% of the total. For three months around midsummer (November–January) thallus temperatures of the measured lichens were remarkably similar at Botany Bay and Livingston Island at 2.9 and 2.6°C, respectively (Fig. 3, Table I). Mean maximal temperatures occurred in December at Botany Bay but one to two months later at Livingston Island.
Discussion
These datasets provide a unique opportunity to make ecophysiological comparisons between lichen habitats and lichen activity at locations separated by just over 14 degrees of latitude with possibly the greatest difference in climate across Antarctica, one site being in the maritime zone and the other in the continental zone. However, such comparisons must be made with caution. Only a single lichen was monitored at each site and, although they were two different species, the lichens selected were the most common and visibly most productive species. The comparison is, therefore, opportunistic rather than planned. It does, however, have validity because the extensive records over several years provide information about variability at each site whilst the patterns of activity can be interpreted using the concurrent microclimate data. In the event, lichen activity, climate, and microclimate all showed marked similarities and differences between the two sites.
As expected Botany Bay was much colder than Livingston Island with an annual mean air temperature of -18°C compared to -1.5°C. Mean thallus temperatures were also much lower at Botany Bay, -9.5°C compared to -0.1°C at Livingston Island (Table I). However, in contrast, thallus temperatures when active were very similar at the two sites, 0.1 and 0.9°C for all active times. Total incident PPFD was much higher at Botany Bay, mean monthly incident PPFD of 940 versus 353 mol m-2 month-1 (Table I) and the sites differed when the mean monthly total PPFD were calculated for active periods remaining high at Botany Bay but falling to very low values at Livingston Island. As a result, total accumulated incident PPFD was very much higher (about 50 times) at Botany Bay then at Livingston Island, (Fig. 3, Table II). Total active hours were about four times greater at Livingston Island (3694 versus 897 hours) with photosynthetic hours just over double those at Botany Bay. The lichen at Livingston Island was also active in every month of the year whilst the lichen at Botany Bay had 89% of active hours in the four summer months November–February, inclusive.
Table II Comparative performance in terms of active hours and PPFD absorbance for the lichens at Botany Bay, Livington Island, Sweden and Portugal. Original data in left-hand columns and, in right-hand columns, normalized to a measurement period of 10 000 hours. Iwet (accumulated irradiance) calculated as total mol photons m-2 incident for the hours active in light.
* information from Gaio-Oliveira et al. (Reference Gaio-Oliveira, Dahlman, Maguas and Palmqvist2004).
The explanation for the above differences is almost certainly the different water relations of the lichens imposed by type and timing of hydration as well as site characteristics. Livingston Island is very cloudy and precipitation is spread through the whole year as (snow in winter, and rain and snow in summer) with a total of c. 600 mm rainfall equivalent. Lichen thallus temperatures close to or above zero can occur in any month but especially so in spring and summer (Schroeter et al. Reference Schroeter, Kappen, Schulz and Sancho2000). The most active period for the lichen was in spring (October–November) when the hydration regime improves due to early melt combines with snowfall and very slow desiccation rate because of low radiation regime (Schroeter et al. Reference Schroeter, Kappen, Schulz and Sancho2000). In contrast, at Botany Bay the weather was often clear and sunny and the most active period was in November–January (early and mid-summer) when very high irradiances led to warm lichens and substantial water from melt sources. The net result is very similar thallus temperatures when active at the two sites but extremely different PPFD. It appears that Botany Bay, during the summer, could be one of the brighter locations in the world as the mean instantaneous incident PPFD in the summer months is 681 μmol m-2 s-1, or about one third nominal full sunlight. The lichens and mosses respond by being highly pigmented in order to screen high light when active (Kappen et al. Reference Kappen, Schroeter, Green and Seppelt1998, Green et al. Reference Green, Schroeter and Sancho2007). The major stress for the active lichen in the continental Antarctic appears to be high irradiances rather than cold temperatures.
There are few published studies of long-term monitoring of lichen activity and the presentation of data for active periods is even rarer. One research project took place at about the same time (2001, 2002) in Portugal and Sweden in which Lobaria pulmonaria (L.) Hoffm. growth was compared to microclimate (Gaio-Oliveira et al. Reference Gaio-Oliveira, Dahlman, Maguas and Palmqvist2004). A comparison between the results from that research and those obtained here are summarized in Table II. Botany Bay has by far the lowest lichen active period being, respectively, 25% and 10% of the values at Livingston Island and Sweden and Portugal (Table II). Gaio-Oliveira et al. (Reference Gaio-Oliveira, Dahlman, Maguas and Palmqvist2004) calculated Iwet, the total accumulated mol photons for the active period, and showed it was much higher in Portugal where the lichens also had a faster growth rate. The inference is that the greater the absorbed photons then the greater the potential carbon fixation and growth. Growth rate is only given on an area basis but if samples around 8 cm diameter were used then radial growth can be calculated to have been just over 10 mm per year (70% annual area increase) for the Portugal lichens. Livingston Island lichens appear to have very high growth rates, the values for crustose lichens are close to or the fastest in the world (Sancho et al. Reference Sancho, Green and Pintado2007) but they have a substantially lower Iwet than the Portugal lichens. The difference in Iwet is enormous for Botany Bay where it is 12 to 50 times more than at the other sites and even greater if mol photon per active hour is calculated. However, lichen growth rates are probably lowest at Botany Bay, and the biodiversity is only a fraction of that of Livingston Island. The comparison points out the weakness of the Iwet concept. Iwet is interpreted as if all the absorbed photons have a photosynthetic worth. This is clearly not correct as only a proportion reaches the photobiont in a normal lichen (45–88% for a hydrated cortex, Dietz et al. Reference Dietz, Büdel, Lange and Bilger2000) and probably much less in the highly pigmented continental Antarctic lichens. Iwet would be useful if the compared lichens have the same transmission values for light to reach the photobiont, but we rarely know this as transmission is almost never measured and, in addition, the lichens can be dynamic in changing their pigmentation to suit the light environment (Hill & Woolhouse Reference Hill and Woolhouse1966, Gauslaa & Solhaug Reference Gauslaa and Solhaug2001, Nybakken et al. Reference Nybakken, Asplund, Solhaug and Gauslaa2007).
Active hours also do not appear to correlate well with the growth rate in the comparison in Table II. The lichens at the Swedish site had the highest active period but a much lower growth rate. All of these comparisons suggest that other factor(s) are influencing growth and the most likely candidates are stress factors like high light and low temperatures. Response to these stresses will have a metabolic cost which will limit growth with the result that, in continental sites, the lichens may pursue a survival, rather than a growth, life strategy. Although offering considerable potential in ecophysiological studies the use of general indices like Iwet or active hours need to be approached with care especially if comparisons are being made between very different locations and lichens.
The monitoring results certainly provide us with some ideas about what factors may be important when considering future climate changes. Temperature seems to have little direct effect (i.e. by influencing photosynthetic rates) as thallus temperatures were almost identical when the lichens were active at both sites. Light, as well, can scarcely be a major controller when there is much less available light at Livingston Island than at Botany Bay yet the lichens grow rapidly. We suggest that the important factor is an indirect one and is the provision of liquid water which is influenced in timing and quantity by both light and temperature, and offers an explanation for the main differences in activity between the sites. Length of active period is also linked to the period over which warm temperatures occur and we suggest some indicator like the length of the warm period, rather like degree days in agriculture, might be useful (Kennedy Reference Kennedy1995). Temperature, therefore, seems to act through differences in the availability of water and length of active period rather than as a direct influence on photosynthetic rate.
Another major difference between the two sites is the proportion of the active time when dark respiration occurs. Because wetting is confined to the periods with potential continuous sunshine, the lichen at Botany Bay never showed any time with dark respiration. If it was active then it was always photosynthetic. At Livingston Island about 41% of active time was dark respiration. Analysis of the same lichens over the years 1995–96 showed that the extent of dark respiration had a large effect on the annual carbon gain for the lichen, in particular, the winter months showed carbon loss due to low PPFD when active, 18% of the 3 yr carbon gain (Schroeter et al. Reference Schroeter, Kappen, Schulz and Sancho2000). Dark respiration can show a strong response to temperature and it was calculated that any general warming could lead to greater carbon losses and reduced growth, especially in the winter. At Botany Bay, because of the 24 hr sunshine in summer, it seems that any warming should improve productivity through lengthening of the active season. However, there will be no gain in productivity without improvement in the water regime. Both sites show lowered activity in late summer due to desiccation (see data for February in 2002 and 2003 and calculations in Schroeter et al. Reference Schroeter, Kappen, Schulz and Sancho2000). At Botany Bay this is because the melt resource of winter snow runs out later in the summer season. Increased winter snow would extend the active time but will potentially also have a negative effect because of season shortening at both sites (Winkler & Schulz Reference Winkler and Schulz2000, Pannewitz et al. Reference Pannewitz, Schlensog, Green, Sancho and Schroeter2003, Schroeter et al. Reference Schroeter, Green, Pannewitz, Schlensog and Sancho2010). Increased snowfall in late summer would probably result in productivity gains at both sites, but prediction of such changes is not yet possible although there are indications of increased snowfall in the maritime Antarctic (Thomas et al. Reference Thomas, Marshall and McConnell2008). The results emphasize the importance of microclimate and that the decrease in biodiversity from the Antarctic Peninsula to the Ross Sea region is almost certainly a result of confining organisms to ever smaller areas with suitable conditions.
The monitoring results also provide a warning by showing the considerable variation in activity between months in the same year and the same month in different years, previously shown for Antarctic invertebrates (McGaughran et al. Reference McGaughran, Convey, Redding and Stevens2010). Long term predictions based on results obtained during a single season, or worse, part of a single season, are not likely to be valid.
Acknowledgements
B.S., S.P., L.G.S and M.S. gratefully acknowledge financial support by Deutsche Forschungsgemeinschaft (DFG SCHR 473/4-3) and by Spanish MCI (CTM2009-12838-C01). TGAG thanks Professor Bryan Gould, Vice-Chancellor of Waikato University for continual funding of the Antarctic research programme. Antarctica New Zealand is thanked for providing logistics both for the research in Antarctica and movements to Antarctica and their staff for assisting with reading and removal of the monitoring equipment. TGAG was supported by a Ramon y Cajal Fellowship at Vegetal II, Farmacia, Universidad Complutense, Madrid, Spain, and by FRST grant: Understanding, valuing and protecting Antarctica’s unique terrestrial ecosystems: Predicting biocomplexity in Dry Valley ecosystems, during the writing of this paper. M. Lücken, Kiel, is thanked for help with Fig. 1. A special thanks goes to Professor Ute Harms, IPN, Kiel, Germany, for support to BS. Permits: sampling, entry into protected areas and equipment deployment were approved by the New Zealand authorities; the monitoring equipment has since been removed.


