Introduction
The continental margin plays a prominent role in marine biogeochemical carbon cycling (Smith et al. Reference Smith, Peloquin and Karl2010). The massive deposition and active remineralization of organic matter at the sediment-water interface are especially important steps in this cycle. Storage in coastal sediments controls the transport of organic matter from the biosphere to the geosphere and thus influences global carbon and nutrient cycles. About 50% of global benthic remineralization occurs at the continental margin, which occupies < 10% of the global ocean surface (Middelburg et al. Reference Middelburg, Soetaert and Herman1997). The benthic boundary layer on the continental shelf is therefore an important site for recycling nutrients back into the water column. This recycling also exerts a major control on pelagic productivity as it supplies 50% or more of the nutrient requirements and influences the trophic status of the system (Klump & Martens Reference Klump and Martens1983).
Low water column production and high levels of benthic faunal biomass are distinct features of the Antarctic continental shelf (Smith et al. Reference Smith, Mincks and DeMaster2006). Highly seasonal variations in sunlight, sea ice, hydrodynamic circulation, and water column stratification produce extreme seasonality in primary production, resulting in low annual production in the water column and low organic input to the sediment. Benthic faunas in the polar regions are characterized by slow growth rates, extended maturation time, and long life spans (Nedwell et al. Reference Nedwell, Walker, Ellis-Evans and Clarke1993b, Nedwell & Walker Reference Nedwell and Walker1995). These life history traits may partly explain the presence of high benthic macrofaunal biomass and low pelagic primary production. Few studies have investigated the dynamics of the fluxes and budgets of biogenic elements at the sediment-water interface in the coastal environment of a polar region (Nedwell et al. Reference Nedwell, Walker, Ellis-Evans and Clarke1993b, Renaud et al. Reference Renaud, Riedel, Michel, Morata, Gosselin, Juul-Pedersen and Chiuchiolo2007). Low environmental temperature and organic matter degradation were found to broadly balance organic matter production at Signy Island, South Orkney Islands (Nedwell et al. Reference Nedwell, Walker, Ellis-Evans and Clarke1993b). On Arctic shelves, ice algae production makes an important contribution to the benthic carbon demands (Renaud et al. Reference Renaud, Riedel, Michel, Morata, Gosselin, Juul-Pedersen and Chiuchiolo2007). However, benthic communities in the Antarctic region are still severely carbon limited, and carbon flux to the seafloor is a primary constraint on benthic community development (Smith et al. Reference Smith, Mincks and DeMaster2006).
Marian Cove (3.5 km long and 1.2 km wide) is a small fjord with a maximum depth of c. 100 m situated in front of the Korean Antarctic Station, King Sejong, on King George Island, one of the South Shetland Islands. Kang (Reference Kang1998) reported that the carbon budget at the sediment-water interface of the subtidal benthic environment in Marian Cove is unbalanced between supply and demand, especially in summer. Primary productivity at Marian Cove also seems to be relatively low compared with other Antarctic regions (c. 0.53 g C m-2 d-1, Kang Reference Kang1998). A dense bloom of phytoplankton (such as micro-sized diatoms) usually develops for a short period, as does a longer but less intense bloom of nanoplankton (predominantly autotrophic nanoflagellates, such as Phaeocystis antarctica Karsten) (Ahn et al. Reference Ahn, Chung, Kang and Kang1997, Kang et al. Reference Kang, Kang, Chung, Lee, Lee, Chung, Kim and Kim1997). Despite low water column primary productivity, the benthic faunal biomass values of Marian Cove are relatively high compared with those measured in other Antarctic regions (Kang Reference Kang1998). In particular, dense populations of a sea urchin, Sterechinus neumayeri (Meissner) and an Antarctic clam, Laternula elliptica (King & Broderip), were observed on and in muddy substrates at 20–30 m depths in the cove (> 1000 g m-2; Chung et al. Reference Chung, Ahn, Kang and Kim1998, Kang Reference Kang1998). Previous calculations have found that the summer phytoplankton production levels and organic content of the water column may not be sufficient to support all the benthic organisms (Ahn Reference Ahn1993, Kang Reference Kang1998).
Our objective was to understand better the biogeochemical cycle of elements and to quantify the mass balance of organic matter in the subtidal benthic environment of Marian Cove. With these goals in mind, we examined: 1) whether the benthic metabolic rate is actually low, 2) whether food supply from surface production is a major organic source, and 3) whether tight coupling between benthic organic carbon demand and supply exists at the sediment-water interface of the cove.
Materials and methods
Study area
Marian Cove is situated south of the Antarctic Polar Front but is free of sea ice for most of the year, with light pancake ice or strong annual ice only in winter. Surface temperatures and salinity ranged from -2 to 2°C and 32–35‰, with averages of -0.37°C and 33.8‰, respectively. Monthly average chlorophyll a (chl a) concentrations which were measured in surface water daily, ranged from 0.28–1.32 μg l-1, with high values in spring and summer (MOMAF 1999, 2000). The timing and scale of the spring bloom are highly variable in Marian Cove (Kang et al. Reference Kang, Kang, Lee, Choi and Lee2000, Reference Kang, Kang and Park2002). The annual mean total chl a concentrations in 1998 and 1999 (0.65 and 0.47 μg l-1, respectively) were much lower than the value in 1996 (1.38 μg l-1), when massive biomass of microplankton occurred in November and December (2.09–2.83 μg l-1). Irradiance and water stability were suggested to be the most important factors causing massive blooms in Marian Cove, rather than temperature or nutrient concentration (Kim et al. Reference Kim, Yang, Pae and Shim1998, Shim et al. Reference Shim, Han, Kang and Kim2005).
Experimental design
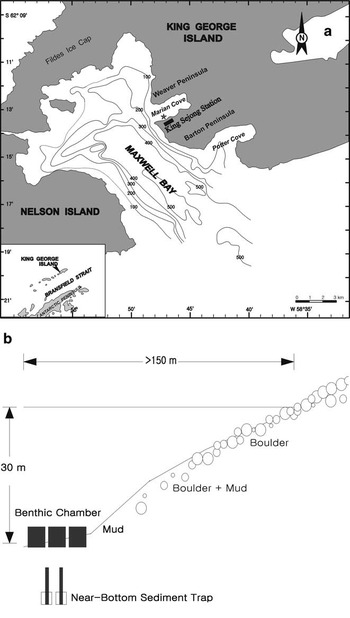
Figure 1 shows the study site and a schematic diagram of the flux-oriented experiment in the benthic environment. To measure chemical fluxes, benthic chambers and sediment traps were deployed on the seafloor, and sediment cores were used to sample the upper sediment at depths of 25–30 m over several years (Table I). Two in situ incubation experiments with two to five benthic flux chambers were conducted in December 1995 and 1996. Two near-bottom sediment traps were deployed, and several sediment cores were also taken around the chambers during the experimental periods. Following that, a year round sediment trap experiment was carried out from 28 February 1998–21 January 2000 for a total of 694 days. The design and procedural details of the chamber experiment and seasonal variability of the trapped material have been described by Kang & Shim (Reference Kang and Shim1997) and Shim et al. (Reference Shim, Han, Kang and Kim2005), respectively.

Fig. 1 a. Location of the study site, Marian Cove, King George Island, Antarctica. The star symbol marks the chamber site, where benthic experiments were conducted in the cove during summers of 1995–96 and 1996–97 and in 1998–2000. b. Schematic diagram showing the benthic experiments. Benthic flux chambers and near-bottom sediment traps were deployed in subtidal benthic environments c. 30 m below the surface of the cove.
Table I Timetable of flux oriented experiments conducted at the sediment-water interface of the subtidal benthic environment in Marian Cove from 1995–2000. The figures are the number of replicate experiments.

Benthic chamber experiments
Each benthic chamber was c. 30 cm in diameter and 40 cm high and had a volume of about 21 l when deployed c. 10 cm into the sediment by skilled SCUBA divers. Because disturbance of the bottom and chamber water inevitably affect the chemical and biological reaction rates in the chamber water throughout the incubation experiment, the benthic chamber bodies were initially deployed without lids and were then carefully covered after it was confirmed that the bottom condition had recovered with few suspended particles. Water samples both from the benthic chambers and from ambient bottom water were taken manually by SCUBA divers using a set of 50 ml all plastic syringes (eight or ten syringes) at time intervals of six to nine hours when starting the experiment, 12 hours one day later, and 24–36 hours at the end of the benthic incubation experiment (about ten days, a much longer duration necessitated by inclement weather conditions for SCUBA diving). A 400–500 ml sample volume is enough for various chemical analyses (e.g. dissolved oxygen (DO), ammonium (NH4+), nitrate (NO3-), nitrite (NO2-), phosphate (PO4+3), and silicate (Si(O2)), and other elements). Ambient bottom water was automatically introduced into the chamber when sampling the chamber water. All chamber concentrations were corrected for dilution due to withdrawal of the sample from the chamber and subsequent volume replenishment with ambient water. Chemical fluxes for the chamber experiments were calculated by linear regression of the corrected data versus incubation time for the initial three to four data points multiplied by the chamber height. Only the initial three to four points (c. < 50 hours) were used for the regression because after these measurements, the DO concentrations within most of the chambers decreased to 20–50% of the initial concentrations. At such low concentration levels, chemical reactions might not be representative of ambient conditions.
After carefully dispensing the samples from syringes into DO bottles with no bubbles, DO was determined by the Winkler-azide titration method (Parsons et al. Reference Parsons, Maita and Lalli1984). For nutrient analysis, water samples taken from both the benthic flux chambers and from ambient bottom water were immediately filtered through an Acrodisc filter with 0.2 μm pore size in the laboratory. The ammonium concentration was determined by standard spectrophotometric techniques (Parsons et al. Reference Parsons, Maita and Lalli1984). The other nutrient species were measured by a flow injection auto-analyser (model QuikChem AE, Lachat Instruments, Loveland, CO, USA) and calibrated using standard brine solutions (CSK Standard Solutions, Wako Pure Chemical Industries, Osaka, Japan). Duplicate analyses suggest that measurement precisions for nitrate+nitrite, phosphate, and silicate were 3%, 3%, and 5%, respectively.
Sediment trap experiments
The near-bottom sediment trap was composed of three parts: 1) the main PVC trap body 7 cm in diameter and 100 cm long, 2) the removable 2 l polyethylene sample bottle, and 3) a stainless steel tripod for supporting the trap. The sample bottle was retrieved and replaced with a new one approximately monthly by SCUBA divers. Previous studies reported some degree of underestimation of elemental species and chelate metal formation when commonly used preservatives including formalin, azide ions, and mercuric ions were added to prevent microbial activities (Hedges et al. Reference Hedges, Lee, Wakeham, Hernes and Peterson1993). Hence, no preservatives were added to the sample bottles, but the loss of organic material due to microbial activities was probably minimal because of the relatively short deployment duration and low water temperature. The treatment procedures after retrieving the trap sample have been detailed by Shim et al. (Reference Shim, Han, Kang and Kim2005). Particulate organic carbon, nitrogen, organic phosphorus, and biogenic silica levels were quantified for each sample. After removal of inorganic carbon by treatment with 8% H2SO3, the organic carbon component and particulate nitrogen levels were determined with a Carlo Erba CHNS analyser (Verardo et al. Reference Verardo, Froelich and McIntyre1990). Particulate organic phosphorus was calculated from the difference between the total phosphorus extracted from ignited samples (500°C for two hours) and the inorganic phosphorus extracted from fresh samples after addition of 1 N HCl for 14–18 hours (Aspila et al. Reference Aspila, Agemian and Chau1976). Biogenic silica (BSi) was extracted by time-series dissolution with 0.5 N NaOH at 85°C for five hours, a procedure modified from Mortlock & Froelich (Reference Mortlock and Froelich1989) and Müller & Schneider (Reference Müller and Schneider1993).
Sediment core samples
Sediment core samples were taken manually using a syringe type sediment corer made of a 50 ml disposable syringe in 1995 and an acrylic corer in 1996. Compression of the uppermost sediment could have occurred when pushing the plunger of the syringe corer into the sediment, whereas the rubber cork of the acrylic corer would have caused relatively little sediment disturbance. Sediment core samples were sectioned in 0.5–1.0 cm intervals to determine the vertical profiles of particulate organic materials. The divided sediment core subsamples were dried at 110°C for five to six hours, and water content was evaluated from the weight loss from the sediment samples. Organic carbon and nitrogen in the dry sediment were estimated by the same methods used for the sediment trap samples.
Results and discussion
Benthic fluxes of oxygen and nutrients at the sediment-water interface
To understand the effects and degree of organic matter metabolism after arriving at the sediment, elemental fluxes at the sediment-water interface were measured using the in situ benthic chambers. Changes in concentration as a function of incubation time were measured for DO, NH4, NO3+2, PO4, and Si(O2) at the sediment-water interface in Marian Cove. In most chambers, oxygen concentration decreased steadily for about 100 hours, after which the rate of oxygen decrease slowed, dropping to below c. 3 mg l-1 after 200 hours (Fig. 2a). The oxygen consumption rate ranged from 11.8 to 35.9 mmol m-2 d-1 up to c. 50 hours, during which time 20–50% of the initial concentration was lost. Fluxes were not calculated after this time because the chemical reactions might not represent those under natural conditions. The chamber with the highest flux had values nearly double those of the chamber with the lowest flux: -35.9 and -16.6 mmol m-2 d-1 in December 1995 and -29.5 and -11.9 mmol m-2 d-1 in December 1996, respectively. The averaged oxygen fluxes for each year were -28.5 ± 8.4 and -20.4 ± 8.8 mmol m-2 d-1 in December 1995 and 1996, respectively. The high values in 1995 might have resulted from increased organic input (see the section on vertical fluxes), but the flux difference between 1995 and 1996 was within the standard deviation for the values.

Fig. 2 Concentration changes in chamber waters for a. dissolved oxygen (mg l-1), b. ammonium (μmol l-1), c. nitrate + nitrite (μmol l-1), d. phosphate (μmol l-1), and e. silicate (μmol l-1) during in situ incubation experiments at Marian Cove in December 1995 (open circle) and December 1996 (closed circle).
The benthic oxygen respiration at Marian Cove is comparable to that of temperate regions and also to results from other regions, as shown in Table II. Although the values for Marian Cove are lower than those of Signy Island (80–90 mmol m-2 d-1 in summer) and the Iberian Peninsula (98–199 mmol m-2 d-1 as an annual base range for five littoral ecosystems along the coast that receive large amounts of organic matter from urban and industrial sources), they are similar to or higher than those measured in various coastal environments. Furthermore, values for Marian Cove are higher than those measured in other high latitude regions (2–23 mmol m-2 d-1; Rysgaard et al. Reference Rysgaard, Thamdrup, Risgaard-Petersen, Fossing, Berg, Bondo and Dalsgaard1998, Renaud et al. Reference Renaud, Riedel, Michel, Morata, Gosselin, Juul-Pedersen and Chiuchiolo2007). These comparisons with other regions in the world indicate that the metabolism at the sediment-water interface in Marian Cove was active, though the production of organic matter in the water column was limited and sporadic due to the severe weather conditions at this high latitude site.
Table II Comparison of benthic oxygen uptake rates (mmol O2 m-2 d-1) in various coastal sediments.

The ammonia concentration in the individual chambers increased with incubation time from almost zero (c. 2 μM) to 20–45 μM (Fig. 2b). Like the trend in oxygen change, ammonia also increased rapidly until 100 hours following deployment, after which the rate of increase was slower. Ammonia fluxes were always from the sediment to the bottom water (i.e. were positive) and ranged from 0.78–2.75 mmol m-2 d-1 if calculated for the first c. 50 hours. The average fluxes were 1.79 ± 0.72 and 1.77 ± 0.97 mmol m-2 d-1 in December 1995 and 1996, respectively. In contrast to ammonium, the nitrate + nitrite concentration in the chamber waters decreased with time (Fig. 2c). Nitrate + nitrite fluxes calculated until c. 50 hours varied between influx and outflux from the sediment in the range of -0.8 to 0.9 mmol m-2 d-1. The decrease of the nitrate + nitrite concentration in some chambers might reflect an increased denitrification process and decomposition of amino acids associated with oxygen decrease within the chamber water and sediment (Belias et al. Reference Belias, Dassenakis and Scoullos2007). Therefore, the ammonium flux accounted for more than c. 76% of the total inorganic nitrogen (TIN = NH4+ + NO2- + NO3-) efflux from the sediment, suggesting a predominance of nitrogen release by ammonification.
Like oxygen and ammonia, phosphate tended to increase in most chambers for the first 50 hours (Fig. 2d). The reduced rate of increase and/or lack of change in the phosphate patterns after c. 50 hours suggest that various processes could affect the concentration of phosphate in chamber water. For example, the reduction of Fe(III) to Fe(II) releases PO43- ions into the overlying seawater by the transformation of insoluble FePO4 into more soluble Fe3(PO4)2, and phosphates adsorb or coagulate onto precipitating colloidal iron hydroxides (Fe(OH)x) (Rozan et al. Reference Rozan, Taillefert, Trouwborst, Glazer, Ma, Herszage, Valdes, Price and Luther2002, Belias et al. Reference Belias, Dassenakis and Scoullos2007). Silicate also showed increasing but undulating trends in most chambers (Fig. 2e). The fluxes ranged from 1.4–11.6 mmol m-2 d-1 when calculated for c. 50 hours. The difference in the silicate trend compared to those of other nutrients was not unexpected because biogenic silica is remineralized by inorganic dissolution reactions, whereas organic matter is decomposed primarily by microbial processes (DeMaster et al. Reference DeMaster, Ragueneau and Nittrouer1996).
Although benthic oxygen respiration rates do not directly represent all the respiration in/on the sediment, the rates showed positive correlations with effluxes of ammonia (r 2 = 0.67), phosphate (r 2 = 0.57), and silicate (r 2 = 0.51), respectively (Fig. 3). This suggests that oxygen consumption rates may be a good indicator of organic respiration and elemental efflux across the sediment-water interface of Marian Cove. When calculating carbon flux from DO by multiplying by the respiratory quotient (0.85; Rowe et al. Reference Rowe, Boland, Phoel, Anderson and Biscaye1994), carbon fluxes were estimated to range from 10.1–30.5 mmol m-2 d-1. From this, the C:N:P:Si ratio in the chamber efflux was 106:11.5:1.15:27, a value close to the Redfield ratio. These results indicate that the fresh organic matter was actively remineralized on the upper sediment of Marian Cove during the study periods.

Fig. 3 Relationships between a. dissolved oxygen flux and ammonium flux, b. dissolved oxygen flux and phosphate flux, and c. dissolved oxygen flux and silicate flux from in situ benthic incubation experiments in 1995 and 1996.
Organic carbon and nitrogen profiles and diagenetic fluxes in the upper sediment
The distributions of organic components in the cored sediment can provide clues to the fate of organic matter through the diagenetic pathway. Figure 4 presents the profiles of total organic carbon (TOC) and total nitrogen (TN) content in the upper sediment. Core sediments were recovered from the surface to a depth of 9–15 cm using syringe corers in 1995 and using acrylic corers in 1996. The TOC and TN concentrations in replicate cores in 1995 decreased exponentially with depth when the disturbed parts of the cores were not included. Between the surface sediment (1–2 cm) and a depth of 8–9 cm, TOC and TN concentrations varied from 0.31–0.18% and from 0.063–0.033%, respectively. Both concentrations in sediments sampled in 1996 ranged from 0.47–0.15% and from 0.10–0.022%, respectively, between the surface sediment (0–1 cm) and 15–16 cm. The differences in the ranges of TOC and TN concentrations between 1995 and 1996 might have been due to the quality of core samples (e.g. the state of the surface and core length) rather than to the interannual variability of the chemical species distribution. The trend of TOC decrease with depth was steep in the uppermost 0–3 cm, gradual between 3 and 8 cm, and showed little change below 8 cm. The trend of TN was similar to that of TOC. These results imply that the labile organic fraction is remineralized within the upper sediment (above c. 8 cm) and the more refractory fraction is buried in the deep sediment (> 8 cm).

Fig. 4 Solid phase profiles and curve fits for organic carbon and nitrogen in the core sediments sampled in the subtidal environment of Marian Cove in December 1995 (open symbols) and 1996 (closed symbols). Two cores were processed during each cruise period and are identified by different symbols (circle and triangle).
The best-fit curves for all TOC and TN vertical distributions in 1995 and 1996 (Fig. 4) were obtained by an error minimization fitting of the diagenetic model equation (Berner Reference Berner1980),
where G(z) is the organic fraction at any given depth z, G0 is the initial organic fraction on the surface sediment, G∞ is a refractory portion in deep sediment, and α (cm-1) is an attenuation coefficient. The values of G0 and G∞ obtained from kinetic modelling indicate that about 67% and 74%, respectively, of TOC and TN inputs to the surface sediment were remineralized within the upper sediment (from the surface to 8–15 cm). This means that about 33% and 26% of the total incoming TOC and TN, respectively, were not degraded and were subsequently buried in the deep sediment. The attenuation coefficients for TOC and TN showed very similar ranges (0.31 cm-1 for TOC and 0.26 cm-1 for TN), although the biogeochemical reactivities and pathways of C and N differ largely in sediment (Farías Reference Farías2003). One of the sediment cores sampled in 1996 was analysed for biogenic silica. The content of biogenic silica in the sediment decreased with depth, but the decreasing trend was somewhat different from those of carbon and nitrogen. There was little change at 0–8 cm with a range of 1.79–1.95%, gradual decrease from 8–12 cm, and little change below c. 12 cm with a range of 1.25–1.35%. Although this one core result might not represent the state of the study site as a whole, we considered the value as depositional fractions and used them to calculate burial flux for biogenic silica at this study site.
From these estimated fractions, diagenetic fluxes were obtained by multiplying by the sediment accumulation rate (R, g cm-2 yr-1) (Martens & Klump Reference Martens and Klump1984) as follows:
where ø is the porosity in volume of pore water per unit volume of total sediment and is calculated as ø = ρs W/{ρw (1-W) + ρs W}, ρs and ρw are the densities of total solids and pore water solution (g cm-3) in the sediment, respectively, ω is the burial velocity of solid particles below the sediment-water interface (cm yr-1), and W is water content (%). For ρs and ρw, common reasonable values for coastal environments were applied: 2.45 g cm-3 and 1.02 g cm-3, respectively (Berner Reference Berner1980). Water content (W) was about 0.35, the average in the upper sediment. Unfortunately, the sedimentation rate (ω) was not measured at the study site. The only measurement available for Marian Cove was a value of c. 0.07 cm yr-1 at the central basin (depth c. 100 m) (Kim Reference Kim1989). We could also obtain another conceivable sedimentation rate of 0.35 cm yr-1 if the year round mass flux measured from March 1998–January 2000 by the near-bottom sediment trap (see next section) were assumed to be the sediment accumulation rate (R). However, neither value was considered directly applicable for the study site because of the likelihood of underestimating and/or overestimating the real value. For high rates of biological production and terrestrial input, the study site would have a much greater input of settling particles compared with the central basin of Marian Cove. Moreover, although the sediment trap was deployed near the bottom, we cannot assume that all the trapped particles would have settled immediately under the trap site. Therefore, we considered the two values to be extremes at both ends of the sedimentation rate at the study site. We thus applied both sedimentation rates (0.07 cm yr-1 and 0.35 cm yr-1) and obtained the following estimates from the above equation: 1) the extremes of the burial rate (Jburial, R × G∞) for organic carbon within the sediment were 0.29 and 1.45 mmol m-2 d-1, and those for nitrogen were 0.04 and 0.18 mmol m-2 d-1, 2) the remineralization rate extremes (R × (G0-G∞)) within the sediment were 0.60 and 3.0 mmol m-2 d-1 for organic carbon and 0.11 and 0.53 mmol m-2 d-1 for nitrogen. These results suggest that more than two thirds of the organic input underwent degradation just on and in the upper sediment (< c. 10 cm), and imply that the biogeochemical cycling of biological elements is quite rapid and efficient in Marian Cove. However, the burial flux for biogenic silica ranged from 2.4–12.5 mmol m-2 d-1 depending on the sedimentation rate (0.07–0.35 cm yr-1). This high depositional efficiency reflects the diatom dominated production in the water column and the characteristic biogeochemical cycle of silica in this Antarctic environment.
Vertical (settling) fluxes of particulate biogenic elements
Because of the small likelihood of degradation in the short distance through the water column to the seafloor, the organic matter arriving on the seafloor is relatively fresh and labile and thus serves as a major source for benthic organic demands. Monthly averaged distributions of settling particulate organic carbon (POC), particulate nitrogen (PN), particulate organic phosphorus (POP), and biogenic silica (BSi) fluxes at Marian Cove from March 1998–January 2000 are shown in Fig. 5. During the study period, the monthly averaged POC, PN, POP, and BSi fluxes ranged from 4.6–19.0 mmol m-2 d-1, 0.5–3.0 mmol m-2 d-1, 12.4–110.0 μmol m-2 d-1, and 1.2–17.3 mmol m-2 d-1, respectively. All biogenic particles showed very similar seasonal patterns: high in spring and summer (November–January) and low in winter (July–September), with the highest peak in November (Shim et al. Reference Shim, Han, Kang and Kim2005). High values of BSi flux were sustained for a longer period, until late summer (December–March), than that of POC flux. The peaks in settling fluxes of biogenic elements, which preceded those of lithogenic particles, might have resulted from a spring phytoplankton bloom occurring at that time (Shim et al. Reference Shim, Han, Kang and Kim2005). This suggestion is also supported by the positive relationship between POC flux and chl a (r 2 = 0.58, Fig. 6), if two extreme values are excluded. The result indicates that the POC originated directly from the water column biomass and production, and that biogenic community debris rapidly settled to the sediment with less degradation in the water column.

Fig. 5 Monthly variations in the flux (mmol m-2 d-1) of particulate organic carbon (closed circle), nitrogen (open circle), organic phosphorus (-), and biogenic silica (+) measured at Marian Cove from 1998–2001. The closed squares are organic carbon fluxes measured in December 1995 and 1996. All values are monthly averages, and values for phosphorus are multiplied by 20.

Fig. 6 Relationship between the chl a concentration (μg l-1) in surface water and particulate organic carbon flux (mmol m-2 d-1) measured at Marian Cove during 1998–2001. All values are monthly averages.
On the basis of the sediment trap results, annual organic inputs to the seafloor were 3.50, 0.44, 0.014, and 2.7 mol m-2 for POC, PN, POP, and BSi, respectively, and the organic C:N:P:Si ratio was 246:30.8:1:190 (or 106:13.3:0.43:82). The organic C:N ratio of particle flux ranged from 6.4–10.5, with a tendency to be low in summer and high in winter. The C:P ratio was more than two times higher than the Redfield ratio (106). This result suggests that fresh organic debris settled in the summer with less chance for degradation in the water column, while settling particles in winter underwent more degradation in nitrogen and phosphorus. The extremely high C:P ratio reflects the relatively high lability of organic P and/or adsorption of PO4 onto particles (Klump & Martens Reference Klump and Martens1987, Ducklow et al. Reference Ducklow, Erickson, Kelly, Montes-Hugo, Ribic, Smith, Stammerjohn and Karl2008). The organic C:Si ratio of particle flux ranged from 0.74–3.92, with a tendency to be low in summer and high in winter. The summer C:Si ratios were similar to those measured at the so-called ‘silicate ocean’ in the Southern Ocean (0.71–0.83) (Nelson et al. Reference Nelson, DeMaster, Dunbar and Smith1996, Ragueneau et al. Reference Ragueneau, Tréguer, Leynaert, Anderson, Brzezinski, DeMaster, Dugdale, Dymond, Fischer, François, Heinze, Maier-Reimer, Martin-Jézéquel, Nelson and Quéguiner2000), implying that summer production in Marian Cove was dominated by diatoms.
Although there were relatively few sampling days (about 10–20 days, Table I), the POC fluxes measured at the same time with benthic chamber experiments in December 1995 and 1996 were also comparable (23.3 mmol m-2 d-1 in 1995 and 14.3 mmol m-2 d-1 in 1996) to those measured in 1998 and 1999 (13.0 ± 2.3 mmol m-2 d-1). The high fluxes of settling POC and benthic oxygen consumption (see the section on benthic fluxes) in 1995 might have resulted from a more massive microalgae bloom than in 1996 (Dr J.-S. Kang, personal communication 1996), suggesting that water column production was rapidly transferred to the seafloor, which in turn affected the rate of benthic metabolism. This result suggests that the biogeochemical cycles of organic elements are linked closely and effectively between the water column and benthic environment of Marian Cove.
Budget of biogenic elements at the sediment-water interface
We examined biogeochemical fluxes at the benthic boundary layer in an Antarctic coastal environment. Specifically, we used sediment traps to obtain the depositional flux of organic matter (input flux, Jin), benthic chambers to measure the efflux of remineralized elements (output flux, Jout), and core analysis to investigate the incorporation of the refractory fraction in the upper sediment into the deeper sediment (burial flux, Jburial). The budgets for organic carbon, nitrogen, phosphorus, and silica at the sediment water interface were calculated from the average fluxes of two summer seasons and are listed in Table III. The sums of Jout and Jburial were 22.0–23.2 mmol m-2 d-1 for carbon (Fig. 7), 2.39–2.53 mmol m-2 d-1 for nitrogen, > 0.15–0.31 mmol m-2 d-1 for phosphorus, and 7.9–18.0 mmol m-2 d-1 for silicon with varying sedimentation rates (0.07–0.35 cm yr-1). The value of Jin was somewhat smaller than the sum of Jout and Jburial and represented c. 69–72% of carbon and 80–84% of nitrogen. This result implies that in the summer season, organic carbon and nitrogen supplied from the water column alone were not able to sustain the high organic demand of the benthic community of the cove. The shortage may have been compensated for by organic input supplied to the benthic environment by processes of lateral input and/or benthic microalgal production. Some lateral transport from the upper slope was possible at the study site, but the effect might not have been significant because the silty sand and gravel that compose the upper slope are more difficult to transport and contain less organic matter than the mud of the study site. On the other hand, benthic diatoms are dominant species in summer at Marian Cove, accounting for > 90% of the diatom carbons at the nearshore stations (Ahn et al. Reference Ahn, Chung, Kang and Kang1997). Kang (Reference Kang1998) also suggested that benthic microalgal production might be an organic source for the benthic community of Marian Cove and found apparent high benthic microalgal productivity in a laboratory incubation. Therefore, benthic microalgal production might be responsible for balancing the low organic carbon supply from the surface water and high organic demand of the benthic community of Marian Cove, at least during summers.
Table III Annual budgets for carbon, nitrogen, phosphorus and silicon at the sediment-water interface of Marian Cove in summer. The unit is mmol m-2 d-1.


Fig. 7 Schematic diagram of the organic carbon budget at the sediment-water interface of the subtidal benthic environment in Marian Cove in summer. The unit is mmol m-2 d-1.
On the other hand, phosphorus and silica showed markedly uncoupled balances between input and output fluxes. Jin was only 32% of Jout for phosphorus, but was 225% of Jout for silica. From this, we could consider two possible explanations: underestimated influx and/or overestimated outflux for phosphorus, and vice versa for silica. As noted previously, phosphorus has biogeochemically characteristic properties of preferential degradation and adsorption onto particles (Klump & Martens Reference Klump and Martens1987, Ducklow et al. Reference Ducklow, Erickson, Kelly, Montes-Hugo, Ribic, Smith, Stammerjohn and Karl2008). During trap deployment, organic phosphorus should have undergone more degradation than carbon or nitrogen in the trap bottle, which had no preservation reagent. This is supported by very high C:P and C:N ratios (247 and 31, respectively) in the trap flux. On the other hand, the C:P ratio (82) in the chamber flux was lower than the Redfield ratio (106), or close to 106 if we consider that the carbon efflux was calculated by DO rather than by all oxidants in the sediment. Moreover, the adsorption properties in a suboxic environment prevents the efflux of phosphate. Thus, the possibility of overestimation of phosphorus efflux is not convincing.
The preservation efficiency of biogenic silica is controlled by several biogeochemical processes, including the sedimentation rate, bioturbation intensity, and kinetic (dissolution rate) and thermodynamic (solubility) properties of opal dissolution (Ragueneau et al. Reference Ragueneau, Tréguer, Leynaert, Anderson, Brzezinski, DeMaster, Dugdale, Dymond, Fischer, François, Heinze, Maier-Reimer, Martin-Jézéquel, Nelson and Quéguiner2000). For these properties of silica, decoupling between the cycles of silica and carbon is an important phenomenon in the world ocean and especially in the Southern Ocean. The preservation efficiency of silica is more than one order of magnitude larger than that of organic carbon. Nelson et al. (Reference Nelson, DeMaster, Dunbar and Smith1996) also reported that a higher preservation efficiency by a factor of 30 for silica than for carbon resulted from the progressive enrichment in silica from surface production and sinking flux to seabed burial on the Ross Sea. Thus the high ratio (Jin/Jout) for silica at the present study site might also have resulted from the high preservation efficiency of silica in the sediment, consistent with the silica cycle in the Southern Ocean.
Although the fluxes used were not measured over complete seasons, the estimated elemental budgets at the sediment-water interface in the summer season were balanced at about 70–80% for carbon and nitrogen, to some extent suggesting pelagic-benthic coupling in Marian Cove. This result means that pelagic production could serve as a major organic source to the benthic environment and that most remineralization occurs within several centimetres of the sediment (approximately from the surface to c. 10 cm), re-supporting the biological activity of the upper water column.
Conclusions
At the benthic boundary layer of an Antarctic coast, Marian Cove, biogeochemical cycles of elements were examined by flux-oriented experiments using benthic chambers, sediment traps, and sediment corers, and material budgets were evaluated. The benthic oxygen respiration rates were correlated very closely with effluxes of nutrients (ammonia, phosphate, and silicate) and were comparable to those of the temperate region, supporting the idea that benthic oxygen uptake is a good indicator of organic respiration and elemental efflux and that benthic remineralization is active enough to support water column production. Analysis of the sediment profiles also suggested that two thirds of organic carbon and nitrogen sedimented in the sea floor were remineralized within c. 10 cm depth, while the rest were buried below. Elemental budgets at the sediment-water interface of Marian Cove for summer indicated that a broad balance exists between organic inputs to the sediment and remineralized inorganic outputs from the sediment for carbon and nitrogen. These findings suggest that reasonable benthic-pelagic coupling is established in the subtidal benthic environment of Marian Cove.
Acknowledgements
The authors thank the 9th–12th Korean Antarctic over wintering team members for their encouragement and technical support. We are particularly grateful to the professional divers who collected the samples (Hyun-Soo Kim and Seong-Soo Han). We also thank three anonymous referees for their constructive comments on the manuscript. This work was supported by KOPRI projects (PE09040 and PP09040), and in part by BK21 (SEES, Seoul National University) and the National Fisheries Research and Development Institute (RP 2010-ME-040).